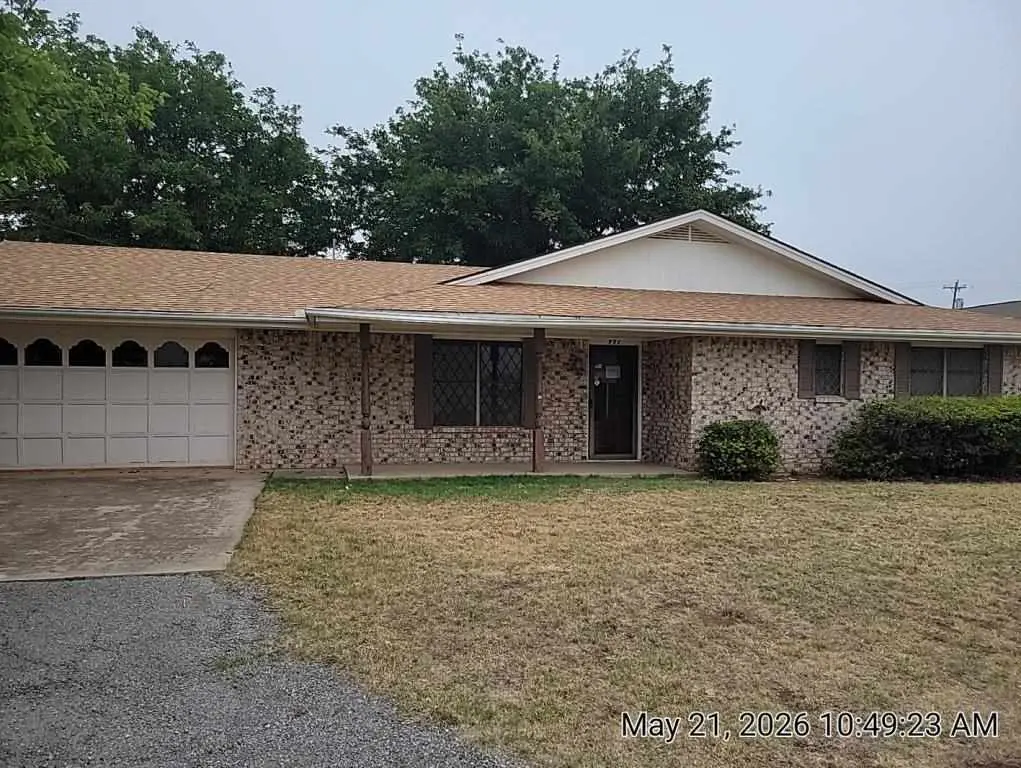
711 W C St · Eldorado, OK
Flood risk 1/10 · Minimal
- FEMA flood zone
- X (unshaded)
- Chance of flooding over 30 yrs
- 0.0%
- Est. flood insurance / yr
- $507 – $1,088
Fire risk 4/10 · Minor
- Est. fire insurance / yr
- $2,463 – $4,575
Heat risk 7/10 · Major
- Hot days now (above 109°F)
- 7 days/yr
- Hot days in 30 yrs
- 20 days/yr
Wind risk 3/10 · Minor
- Chance of severe wind over 30 yrs
- 4.0%
Air-quality risk 1/10 · Minimal
- Unhealthy air days now
- 0 days/yr
- Unhealthy air days in 30 yrs
- 0 days/yr
Risk factors via First Street. Map © Google.
Why this score? — see what drove the B+ grade
The composite is a weighted blend of 9 inputs, each scored 0–100. Each bar is that input's sub-score; the figure is the points it added to the 100-point composite (weight × sub-score).
- Cash flow +30.0/30.0
- 1% rule +10.0/10.0
- DSCR +10.0/10.0
- ARV discount +7.5/15.0
- Appreciation +7.2/10.0
- Schools +5.0/10.0
- Livability +3.1/5.0
- Rent growth +2.5/5.0
- Condition / age +2.5/5.0
$41,000
🖨 Deal sheet (PDF) 📄 Offer letter ✓ Due diligence
Listing remarks MLS
White brick home on corner lot in Eldorado. Three bedrooms with two baths, large living area, dining area, large utility room. Two nice metal storage units in backyard. LARGE mature trees, chain length fenced backyard. Seller will leave the refrigerator, dishwasher, cookstove. Home has oversized two car garage with entry to storm cellar/basement in the garage. Private well for outside watering. Home has been well maintained.
Key facts
- Kitchen dining
- Brick home
- Storm cellar
Tags
Property features AI
Exterior
- Parking: 2 total parking spaces; 2 covered spaces; 2-car garage
- Utilities: Public water; Public sewer; Natural gas available
- Home design: Single family residence; One level
- Construction: Brick veneer construction; Composition roof; Slab foundation; Built as a residential single family home
- Exterior features: Chain link fencing; Shed(s)
Interior
- Kitchen: Oven; Range hood
- Flooring: Carpet
- Bathrooms: 2 full bathrooms
- Heating & cooling: Central heating (natural gas); Central electric air conditioning
- Interior features: Gas water heater; Oven; Range hood; No fireplace
- Laundry & utility: Washer hookup
Neighborhood map
What this means for you Summary
Snapshot
- This is a 3-bed/2.0-bath single-family listed at $41k.
Deal economics
- At list price, monthly cash flow is $611 ($7k/yr) — positive.
- The deal already cash-flows at list — no discount required.
- Meets the 1% rule at list price ($1k rent vs $41k).
- Recommended offer: $40k (1.5% below list) — sets the bar for market timing.
Location & tenants
- Location reads 61/100 on livability (#276 in OK) — a middle-class / working-renter tenant base. Strengths: crime A+, cost of living A+; Watch: amenities F, commute F, employment D-.
- Zoned schools: Olustee-Eldorado Es (math 8% / reading 12%, grade F, #711 of 845 statewide, top 87%, 154 students, 0% FRL); Olustee-Eldorado Hs (math 24% / reading 24%, grade F, #150 of 447 statewide, top 48%, 42 students, 0% FRL).
- Market conditions: 4 active listings in the ZIP; 8 units permitted in Jackson County in 2024 (0 in 5+ unit buildings).
Forward outlook
- In year one you build about $2k of equity ($283 loan paydown + $2k appreciation (4.5% local appreciation)).
- Jackson County population projected to shrink 6% by 2050 — rents likely to lag national; underwrite the cash flow, not the appreciation.
- At projected returns (4.5% appreciation + 3.0% rent growth), your $11k cash investment doubles in ~2 years — after that, you're playing with house money.
Negotiation context
- It's been on market 21 days — a 2% lower offer ($40k) is reasonable based on typical stale-listing flexibility.
- 2 sale attempts since 4y ago with the ask held roughly flat each time — persistent listings suggest the price (not the market) is what's stuck; bring a comps-based counter.
Risks & watch-outs
- Watch-outs: property tax is 2.9% of price.
- Climate carrying-cost: extreme-heat days projected 7→20/yr by 2055 (HVAC capex compounding) — expect insurance premiums to compound above CPI over the hold.
Questions for the listing agent
- Property tax is high relative to price — has the assessment been appealed recently, and will the sale trigger a re-assessment?
- Is there a deadline driving the sale (1031 exchange, divorce, estate, relocation)? That informs how much negotiation room exists.
- Schools are D-rated, which usually means shorter tenancies and higher turnover. Who's the typical renter profile here, and what's been the actual vacancy rate?
- What's the average days-on-market for RENTAL listings here right now (not sales)? A rising rental-DOM trend means longer vacancies and softer asking-rent achievability than the comps imply.
- What's the recent tenant-quality profile in this submarket — average credit score on applications, eviction rate, late-payment / NSF rate, and stable-employment percentage? A property-management company in the area should have these aggregated.
- How much new for-sale + rental construction is in the pipeline within 1–3 miles? Heavy new supply typically softens prices + rents 12–24 months out; constrained supply supports both.
Investment metrics
- 1% rule
- 2.91% ✓
- Cap rate
- 24.19%
- Cash-on-cash
- 63.90%
- DSCR
- 3.84
- GRM
- 2.9
CMA / ARV
No comps found within radius.
Projected returns pro-forma
4.46% appreciation · 3.0% rent growth · sell at horizon
- IRR
- 70.1%
- Equity multiple
- 5.11×
- Total profit
- $47,180
- Equity at exit
- $21,901
- IRR
- 68.5%
- Equity multiple
- 10.55×
- Total profit
- $109,691
- Equity at exit
- $36,740
Cash invested: $11,480 (down + closing). Projections, not guarantees.
Landlord ↔ Tenant lean methodology
- Overall (STATE)
- 83 Strongly Landlord-Friendly
- State Oklahoma
- 83 Strongly Landlord-Friendly · R+20
- County
- — inherits STATE
- City
- — inherits STATE
ZIP-level market 73537
- Home prices YoY
- 2.5%
- Active inventory
- 4
- Price-to-rent
- 2.9×
Monthly cashflow live
- Estimated rent
- $1,192 medium interval (Pro) →
- Mortgage (P&I)
- −$215
- Tax from tax record
- −$98 /mo · $1,176/yr
- Insurance
- −$17
- HOA
- −$0
- Vacancy / Maint / Mgmt
- −$250
- Net cashflow
- $611
Break-even live
Sensitivity live
| Price | -10% $635 | -5% $623 | +0% $611 | +5% $600 | +10% $588 |
|---|---|---|---|---|---|
| Rent | -10% $517 | -5% $564 | +0% $611 | +5% $658 | +10% $705 |
| Rate | -1.0pp $632 | -0.5pp $622 | base $611 | +0.5pp $601 | +1.0pp $590 |
UW: 25.0% down · 7.5% · 30yr · 1.5% tax · 5.0% vac · 8.0% maint · 8.0% mgmt
Financing live
Cash to close
- Down payment
- $10,250
- Closing costs
- $1,230
- Reserves months
- —
- Total cash needed
- —
Loan-product check · same deal, 3 products live
Conventional
25% down · 7.5% · 30yr
- Down + closing
- —
- Monthly P&I
- —
- Monthly cashflow
- —
- DSCR
- —
- Eligible?
- —
Personal DTI + credit; lowest rate.
DSCR
20% down · 8.5% · 30yr
- Down + closing
- —
- Monthly P&I
- —
- Monthly cashflow
- —
- DSCR
- —
- Eligible?
- —
No personal income docs; deal must DSCR.
Hard money
10% down · 12.0% · 12mo
- Down + closing
- —
- Monthly P&I
- —
- Monthly cashflow
- —
- DSCR
- —
- Eligible?
- —
Short-term bridge; refi at stabilization.
Listing history 16 events
-
2026-06-22days on market $41,000 Active 21 DOM
-
2026-06-21days on market $41,000 Active 20 DOM
-
2026-06-21days on market $41,000 Active 19 DOM
-
2026-06-18days on market $41,000 Active 17 DOM
-
2026-06-17days on market $41,000 Active 16 DOM
-
2026-06-16days on market $41,000 Active 15 DOM
-
2026-06-15days on market $41,000 Active 14 DOM
-
2026-06-13days on market $41,000 Active 12 DOM
-
2026-06-12days on market $41,000 Active 11 DOM
-
2026-06-09days on market $41,000 Active 8 DOM
-
2026-06-08days on market $41,000 Active 7 DOM
-
2026-06-08days on market $41,000 Active 6 DOM
-
2026-06-05days on market $41,000 Active 4 DOM
-
2026-06-04days on market $41,000 Active 2 DOM
-
2026-06-01remarks 243-char remark
-
2026-06-01$41,000 Active 1 DOM
ⓘ Source: listings_history table (triggers on properties + properties_extension) + one-shot
backfill from property_details.listing_events for pre-trigger history.
Tax reassessment forecast OK · Resets to sale price
- Current annual tax
- $1,176 · $98/mo
- Projected year-2 tax
- $1,176 · $98/mo
- Expected delta
- $0/yr ($0/mo · 0.0%)
ⓘ Screening estimate from a state-policy table — verify with the county assessor before closing.
Climate risk First Street
- Flood 1/10 Low FEMA zone X (unshaded) · 0% chance over 30 yrs
- Wildfire 4/10 Moderate
- Heat 7/10 Severe 7 d/yr ≥109°F today · 20 d/yr by 30 yrs out
- Wind 3/10 Moderate 4% chance of damaging wind over 30 yrs
- Air quality 1/10 Low 0 unhealthy d/yr today · 0 by 30 yrs out
Nearby sold comps map
Loading sold comps map…
Walkable amenities ~0.75 mi
Loading nearby amenities…
Taxation est. · year 1
- Rental income
- $14,300
- − Mortgage interest
- −$2,297
- − Property taxes
- −$1,176
- − Insurance
- −$205
- − Repairs & maintenance
- −$1,144
- − Management
- −$1,144
- − Depreciation
- −$1,193
- Taxable income
- $7,142
- Est. tax owed @ 24.0%
- −$1,714
- After-tax cash flow
- $5,622/yr
For passive investors: Depreciation is non-cash, so a rental often shows a tax loss while cash-flowing — sheltering income. Rental losses are passive: they offset passive income freely, and up to $25,000/yr can offset ordinary (W-2) income if you actively participate and your MAGI is under $100k (phasing out to $0 by $150k); unused losses carry forward. On sale, claimed depreciation is recaptured at up to 25%, and gains may owe capital-gains tax (a 1031 exchange can defer both). Figures are a year-1 estimate at your 24.0% rate — not tax advice; consult a CPA.
Schools (NCES district)
No district data.
Livability — Eldorado
- Score
- 61/100
- State rank
- #276
- US rank
- #17362
Category grades
Schools grade is shown separately in the Schools card above.
Census & demographics
- Census place
- Eldorado, OK
- Population (ZIP)
- 503
Population outlook (Jackson County) Hauer SSP2
- Today (2025)
- 24,084 people
- By 2030
- 23,476 · -2.5%
- By 2040
- 22,731 · -5.6%
- By 2050
- 22,586 · -6.2%
- By 2075
- 25,413 · +5.5%
- By 2100
- 31,069 · +29.0%
Race, ethnicity, and origin ACS 2023
- Neighborhood character
- Predominantly White (67%)
- Race & ethnicity
- White 67% Hispanic / Latino 26% Two or more races 4% Native American 4%
- Hispanic origin (detail)
- Mexican 21% Dominican 3%
- Common ancestry
- Scotch-Irish 2% Italian 2% Slovak 2%
- Foreign-born
- 10% · Canada
- Languages at home
- 68% English-only · Spanish 32%
Political lean MEDSL · Jackson
- 2024 margin
- Solid R (+58.3) · D 19.9% · R 78.2% · Other 1.9%
- 2008→2024 swing
- -8.7pp toward R · 2008: -49.6pp · 2024: -58.3pp
- All cycles
- 2024: R+58.3 2020: R+57.7 2016: R+57.6 2012: R+50.7 2008: R+49.6
Not yet ingested
- Civics
- —
Market trends
- HPI YoY
- ▲ 4.46%
- Current HPI
- 180.5358
- Rent YoY
- —
- Metro
- —
- State GDP YoY
- ▲ 1.55%
- F500 in state
- 6
Industry mix (Fortune 500 HQ in OK)
| Industry | F500 HQs | Revenue |
|---|---|---|
| Energy | 3 | $48B |
|
||
Price history
-17.2% since first listed8 events — show timeline
- 2026-06-01 Listed $41,000 LBRMLS
- 2022-12-28 Sold (Public Records) $85,000 Public Records
- 2022-12-22 Sold (MLS) $85,000 MLSOK
- 2022-11-17 Pending — MLSOK
- 2022-11-01 Listed $85,000 MLSOK
- 2008-03-11 Sold (Public Records) $63,000 Public Records
- 2006-10-18 Sold (Public Records) $65,000 Public Records
- 1999-05-21 Sold (Public Records) $49,500 Public Records
Property tax history
+8.0%/yrLatest (2025): $1,176 · +4.9% YoY. Source: county tax records.
Cash-flow waterfall
monthlySold comps — $/sqft
last 12 mo · ≤1 miLoading sold comps…