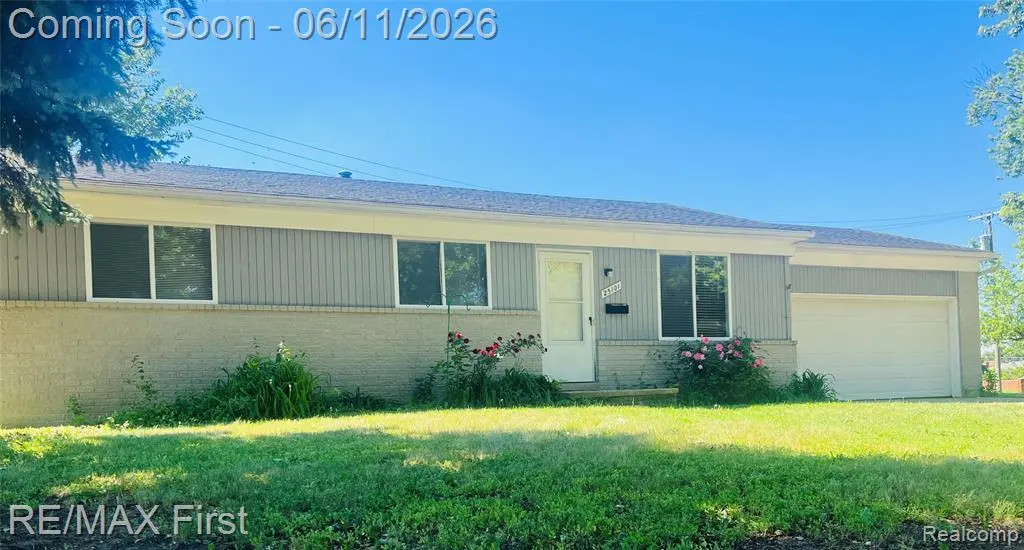
25101 Masch Ave · Warren, MI
Flood risk 3/10 · Minor
- FEMA flood zone
- X (unshaded)
- Chance of flooding over 30 yrs
- 0.16%
- Est. flood insurance / yr
- $473 – $860
Fire risk 1/10 · Minimal
- Est. fire insurance / yr
- $784 – $1,456
Heat risk 3/10 · Minor
- Hot days now (above 97°F)
- 7 days/yr
- Hot days in 30 yrs
- 15 days/yr
Wind risk 1/10 · Minimal
- Chance of severe wind over 30 yrs
- —
Air-quality risk 3/10 · Minor
- Unhealthy air days now
- 3 days/yr
- Unhealthy air days in 30 yrs
- 5 days/yr
Risk factors via First Street. Map © Google.
Why this score? — see what drove the D+ grade
The composite is a weighted blend of 9 inputs, each scored 0–100. Each bar is that input's sub-score; the figure is the points it added to the 100-point composite (weight × sub-score).
- Cash flow +13.8/30.0
- ARV discount +12.0/15.0
- 1% rule +4.3/10.0
- DSCR +4.2/10.0
- Livability +3.7/5.0
- Rent growth +3.1/5.0
- Condition / age +2.5/5.0
- Schools +1.8/10.0
- Appreciation +0.0/10.0
$149,999
🖨 Deal sheet (PDF) 📄 Offer letter ✓ Due diligence
Listing remarks MLS
3 bedroom brick ranch needs alittle work bur priced accordingly. Appears to have good bones. Located at end of cul-de-sac & close to elementary school. Nice sized yard! Ask your agent about Homesteps buyers incentives!!!
Key facts
- 0.24 acre lot
- 2 garage spots
- Built 1995
Property features AI
Finance
- Other: Lot acreage about 0.24 acre; Frontage approx. 81 feet; Subdivision: Sharon Sub; Located in Warren (city)
Exterior
- Parking: Attached 2-car garage
- Utilities: Public water; Public sewer at street; Natural gas; Electric service (standard)
- Home design: Residential property; One-story structure; Built in 1995; Entry-level living areas
- Construction: Brick construction; Basement foundation; 1995 construction
- Exterior features: Brick exterior; Paved street frontage
Interior
- Kitchen: Kitchen on entry level (15 x 13)
- Bedrooms: Bedroom 1 on entry level (13 x 12); Bedroom 2 on entry level (12 x 11); Bedroom 3 on entry level (approx. 11 wide)
- Bathrooms: 1 full bathroom on entry level (approx. 8 x 7)
- Heating & cooling: Forced air heating; Central air conditioning; Natural gas heat/fuel
- Interior features: 6 total rooms; Partially finished basement
- Laundry & utility: Basement present
Neighborhood map
What this means for you Summary
Snapshot
- This is a 3-bed/1.0-bath single-family listed at $150k.
Deal economics
- At list price, monthly cash flow is $15 ($181/yr) — positive.
- The deal already cash-flows at list — no discount required.
- To meet the 1% rule (rent ≥ 1% of price), the offer needs to be $140k (6.6% below list).
- Recommended offer: $140k (6.6% below list) — sets the bar for 1% rule.
- Cap rate 6.4% vs local median 5.2% in Warren — meaningfully above typical; check what's discounted (condition, days-on-market, listing class) to confirm the premium yield is real.
Location & tenants
- Location reads 74/100 on livability (#171 in MI, #4,491 nationally) — a middle-class / working-renter tenant base. Strengths: commute A+, cost of living A+, housing A+; Watch: schools D, amenities D, employment D.
- Center Line Public Schools (suburban): math 14% / reading 29% proficiency, ranked #459 of 540 in MI (top 85%) — low school quality limits family demand, transient renter base, plan for 1-2y turnover; 60% free/reduced lunch — lower-income household profile, screen leases tightly.
- Market conditions: Rents rising (+2.4%/yr); 169 active listings in the ZIP; 8 comparable units currently listed for rent nearby; rentals at typical pace (median 26d on market — plan ~3-4 weeks tenant-placement turnaround); 1,321 units permitted in Macomb County in 2024 (86 in 5+ unit buildings).
- This rent runs 31% of the median local income ($54k/yr) — at the standard rent-burdened threshold; future hikes will face affordability resistance.
Forward outlook
- Local home prices are declining (-3.0%/yr); year-one equity from $1k of loan paydown is wiped out by about $4k of value loss. Plan a longer hold.
- Macomb County population projected at +9% by 2050 — modest demand growth; plan on rents tracking national, not racing it.
Negotiation context
- Only 4 days on market — expect competitive offers; lowballing is unlikely to land.
- 7 sale attempts since 23y ago; this cycle's ask is 201% above the opening price — seller raised mid-cycle; expect resistance to lowballs.
- Current owner paid $48k; list at $150k implies a 216% gain — meaningful room to come down on a strong offer.
Questions for the listing agent
- Is there a deadline driving the sale (1031 exchange, divorce, estate, relocation)? That informs how much negotiation room exists.
- Schools are D-rated, which usually means shorter tenancies and higher turnover. Who's the typical renter profile here, and what's been the actual vacancy rate?
- Crime grade is D in this area — have there been break-ins, vandalism, or insurance claims at this property in the last 3 years? What carrier currently insures it and at what premium?
- The area grade is low — what's the realistic commute time and amenity access for the typical tenant pool here? Any planned neighborhood developments (good or bad) we should know about?
- What's the average days-on-market for RENTAL listings here right now (not sales)? A rising rental-DOM trend means longer vacancies and softer asking-rent achievability than the comps imply.
- What's the recent tenant-quality profile in this submarket — average credit score on applications, eviction rate, late-payment / NSF rate, and stable-employment percentage? A property-management company in the area should have these aggregated.
- How much new for-sale + rental construction is in the pipeline within 1–3 miles? Heavy new supply typically softens prices + rents 12–24 months out; constrained supply supports both.
Investment metrics
- 1% rule
- 0.93% ✗
- Cap rate
- 6.41%
- Cash-on-cash
- 0.43%
- DSCR
- 1.02
- GRM
- 8.9
CMA / ARV
- ARV (on-the-fly)
- $166,656
- Comps found
- 12
Show comp detail 12 sales within ~0.75 mi
| Address | Dist | Beds/Ba | Sqft | Sold | Price | $/sf | Match |
|---|---|---|---|---|---|---|---|
| 24849 Curie St | 0.33mi | 3/1.0 | 1,018 (+3%) | 11mo | $195,000 | $192 | 71 |
| 4251 Dolores Ave | 0.57mi | 3/1.0 | 960 (-3%) | 3mo | $161,000 | $168 | 65 |
| 26379 Audrey Ave | 0.59mi | 3/2.0 | 1,000 (+1%) | 3mo | $215,000 | $215 | 65 |
| 24596 Eureka Ave | 0.37mi | 2/1.0 (-1) | 1,005 (+1%) | 13mo | $139,000 | $138 | 65 |
| 24746 Cunningham Ave | 0.27mi | 3/1.5 | 1,105 (+11%) | 4mo | $138,200 | $125 | 63 |
| 25838 Masch Ave | 0.32mi | 3/1.0 | 1,115 (+12%) | 7mo | $216,000 | $194 | 58 |
| 24044 Cunningham Ave | 0.60mi | 3/1.0 | 1,050 (+6%) | 9mo | $145,000 | $138 | 54 |
| 5234 Andriths Ave | 0.63mi | 3/1.0 | 1,037 (+4%) | 13mo | $230,000 | $222 | 52 |
| 23930 Eureka Ave | 0.70mi | 3/1.5 | 1,037 (+4%) | 10mo | $200,000 | $193 | 50 |
| 4259 Stephens Rd | 0.68mi | 2/1.0 (-1) | 950 (-4%) | 14mo | $128,800 | $136 | 45 |
| 4144 Norbert Ave | 0.68mi | 3/1.0 | 1,080 (+9%) | 13mo | $152,000 | $141 | 43 |
| 24248 Cunningham Ave | 0.47mi | 2/1.0 (-1) | 845 (-15%) | 7mo | $99,000 | $117 | 42 |
Match score weights: distance 35% · size 25% · config 20% · recency 20%. Top-matched comps best support the ARV.
Projected returns pro-forma
-3.0% appreciation · 2.35% rent growth · sell at horizon
- IRR
- -16.3%
- Equity multiple
- 0.42×
- Total profit
- $-24,204
- Equity at exit
- $22,365
- IRR
- -9.2%
- Equity multiple
- 0.45×
- Total profit
- $-23,306
- Equity at exit
- $12,969
Cash invested: $42,000 (down + closing). Projections, not guarantees.
Landlord ↔ Tenant lean methodology
- Overall (STATE)
- 62 Landlord-Friendly
- State Michigan
- 62 Landlord-Friendly · EVEN
- County
- — inherits STATE
- City
- — inherits STATE
ZIP-level market 48091
- Rents YoY
- 2.4%
- Active inventory
- 169
- Price-to-rent
- 8.9×
Monthly cashflow live
- Estimated rent
- $1,402 high interval (Pro) →
- Mortgage (P&I)
- −$787
- Tax from tax record
- −$243 /mo · $2,918/yr
- Insurance
- −$62
- HOA
- −$0
- Vacancy / Maint / Mgmt
- −$294
- Net cashflow
- $15
Break-even live
Sensitivity live
| Price | -10% $100 | -5% $58 | +0% $15 | +5% $-27 | +10% $-70 |
|---|---|---|---|---|---|
| Rent | -10% $-96 | -5% $-40 | +0% $15 | +5% $70 | +10% $126 |
| Rate | -1.0pp $91 | -0.5pp $53 | base $15 | +0.5pp $-24 | +1.0pp $-63 |
UW: 25.0% down · 7.5% · 30yr · 1.5% tax · 5.0% vac · 8.0% maint · 8.0% mgmt
Financing live
Cash to close
- Down payment
- $37,500
- Closing costs
- $4,500
- Reserves months
- —
- Total cash needed
- —
Loan-product check · same deal, 3 products live
Conventional
25% down · 7.5% · 30yr
- Down + closing
- —
- Monthly P&I
- —
- Monthly cashflow
- —
- DSCR
- —
- Eligible?
- —
Personal DTI + credit; lowest rate.
DSCR
20% down · 8.5% · 30yr
- Down + closing
- —
- Monthly P&I
- —
- Monthly cashflow
- —
- DSCR
- —
- Eligible?
- —
No personal income docs; deal must DSCR.
Hard money
10% down · 12.0% · 12mo
- Down + closing
- —
- Monthly P&I
- —
- Monthly cashflow
- —
- DSCR
- —
- Eligible?
- —
Short-term bridge; refi at stabilization.
Rent comps 8 comps
| Address | Beds | Baths | Sqft | Rent | $/sqft | DOM | Units | Dist |
|---|---|---|---|---|---|---|---|---|
| 4652 E 10 Mile Rd Warren, MI | 2.0 | 1.0 | 950 | $1,200 | $1.26 | 45d | 1 | 0.20mi |
| 4385 Frazho Rd Warren, MI | 1.0–2.0 | 1.0 | 825 | $1,305 | $1.58 | 4d | 6 | 0.45mi |
| 3840 Bart Ave Warren, MI | 3.0 | 1.0 | 1062 | $1,350 | $1.27 | 25d | 1 | 1.08mi |
| 22580 Masch Ave Warren, MI | 3.0 | 1.0 | 988 | $1,450 | $1.47 | 25d | 1 | 1.24mi |
| 25005 Lawrence Ave Center Line, MI | 1.0–2.0 | 1.0–1.5 | 1000 | $955 | $0.95 | 45d | 1 | 1.25mi |
| 22622 Panama Ave Warren, MI | 3.0 | 1.5 | 920 | $1,395 | $1.52 | 12d | 1 | 1.33mi |
| 2709 Capitol Ave Warren, MI | 3.0 | 2.0 | 1056 | $1,649 | $1.56 | 45d | 1 | 1.39mi |
| 25151 Dequindre Rd Madison Heights, MI | 3.0 | 2.0 | 1088 | $1,279 | $1.18 | 25d | 1 | 1.48mi |
Listing history 5 events
-
2026-06-15statusdays on market $149,999 Pending 4 DOM
-
2026-06-13statusdays on market $149,999 Active 3 DOM
-
2026-06-09days on market $149,999 Coming Soon 2 DOM
-
2026-06-08remarks 699-char remark
-
2026-06-08$149,999 Coming Soon 1 DOM
ⓘ Source: listings_history table (triggers on properties + properties_extension) + one-shot
backfill from property_details.listing_events for pre-trigger history.
Tax reassessment forecast MI · Partial reset (capped growth)
- Current annual tax
- $2,918 · $243/mo
- Projected year-2 tax
- $2,918 · $243/mo
- Expected delta
- $0/yr ($0/mo · 0.0%)
ⓘ Screening estimate from a state-policy table — verify with the county assessor before closing.
Climate risk First Street
- Flood 3/10 Moderate FEMA zone X (unshaded) · 16% chance over 30 yrs
- Wildfire 1/10 Low
- Heat 3/10 Moderate 7 d/yr ≥97°F today · 15 d/yr by 30 yrs out
- Wind 1/10 Low
- Air quality 3/10 Moderate 3 unhealthy d/yr today · 5 by 30 yrs out
Nearby sold comps map
Loading sold comps map…
Walkable amenities ~0.75 mi
Loading nearby amenities…
Taxation est. · year 1
- Rental income
- $16,820
- − Mortgage interest
- −$8,402
- − Property taxes
- −$2,918
- − Insurance
- −$750
- − Repairs & maintenance
- −$1,346
- − Management
- −$1,346
- − Depreciation
- −$4,364
- Taxable loss
- −$2,305
- Est. tax savings @ 24.0%
- +$553
- After-tax cash flow
- $734/yr
For passive investors: Depreciation is non-cash, so a rental often shows a tax loss while cash-flowing — sheltering income. Rental losses are passive: they offset passive income freely, and up to $25,000/yr can offset ordinary (W-2) income if you actively participate and your MAGI is under $100k (phasing out to $0 by $150k); unused losses carry forward. On sale, claimed depreciation is recaptured at up to 25%, and gains may owe capital-gains tax (a 1031 exchange can defer both). Figures are a year-1 estimate at your 24.0% rate — not tax advice; consult a CPA.
Schools (NCES district)
- District
- Center Line Public Schools
- NCES district ID
- 2608580
- Math proficiency
- 14% ▼ -8.00%
- Reading proficiency
- 29% ▼ -3.00%
- Median HH income
- $38,011
- Composite
- 17.95/100
- National rank
- #8992
- State rank
- #459 of 540 in MI
Livability — Warren
- Score
- 74/100
- State rank
- #171
- US rank
- #4491
Category grades
Schools grade is shown separately in the Schools card above.
Census & demographics
- Census place
- Warren, MI
- County
- Macomb County · 638,552 people
- City population
- 114,937
- Metro
- Detroit-Warren-Dearborn, MI
- Population (ZIP)
- 30,696
- Household income
- $54,230
- Rent vs Own
- Severe rent burden
- 1296.0
Population outlook (Macomb County) Hauer SSP2
- Today (2025)
- 925,296 people
- By 2030
- 948,226 · +2.5%
- By 2040
- 983,961 · +6.3%
- By 2050
- 1,010,200 · +9.2%
- By 2075
- 1,076,222 · +16.3%
- By 2100
- 1,077,065 · +16.4%
Race, ethnicity, and origin ACS 2023
- Neighborhood character
- Diverse neighborhood (Simpson 0.68)
- Race & ethnicity
- White 47% Black 25% Asian 19% Two or more races 5% Hispanic / Latino 3% Native American 2%
- Common ancestry
- Romanian 7% Lithuanian 2% Slovak 1%
- Foreign-born
- 16% · Canada
- Languages at home
- 77% English-only · Other Indo-European 14% Other Asian/Pacific 3% Russian/Polish/Slavic 2%
Political lean MEDSL · Macomb
- 2024 margin
- R (+13.7) · D 42.2% · R 55.9% · Other 1.9%
- 2008→2024 swing
- -22.3pp toward R · 2008: 8.6pp · 2024: -13.7pp
- All cycles
- 2024: R+13.7 2020: R+8.1 2016: R+11.6 2012: D+4.0 2008: D+8.6
Not yet ingested
- Civics
- —
Market trends
- HPI YoY
- ▼ -199.66%
- Current HPI
- 177.9273
- Rent YoY
- ▲ 2.35%
- Metro
- Detroit-Warren-Dearborn, MI
- State GDP YoY
- ▲ 1.37%
- F500 in state
- 28
Industry mix (Fortune 500 HQ in MI)
| Industry | F500 HQs | Revenue |
|---|---|---|
| Automotive Parts | 3 | $48B |
|
||
| Automotive | 2 | $372B |
|
||
| Chemicals | 1 | $45B |
|
||
| Automotive Retail | 1 | $29B |
|
||
| Healthcare / Medical Devices | 1 | $23B |
|
||
| Automotive Technology | 1 | $20B |
|
||
Price history
+900.0% since first listed22 events — show timeline
- 2026-06-07 Coming Soon $149,999 MiRealSource-MiMLS
- 2010-04-30 Sold (MLS) $47,500 MiRealSource-MiMLS
- 2010-04-30 Sold (MLS) $47,500 REALCOMP
- 2010-04-02 Listing Removed — MiRealSource-MiMLS
- 2010-02-26 Listed $49,900 MiRealSource-MiMLS
- 2010-02-26 Listed $49,900 REALCOMP
- 2005-02-14 Sold (Public Records) $142,000 Public Records
- 2005-02-04 Sold (MLS) $142,000 REALCOMP
- 2005-02-04 Sold (MLS) $142,000 MiRealSource-MiMLS
- 2005-01-25 Listing Removed — MiRealSource-MiMLS
- 2005-01-03 Listed $149,900 REALCOMP
- 2005-01-03 Listed $149,900 MiRealSource-MiMLS
- 2004-12-30 Listing Removed — REALCOMP
- 2004-12-28 Listing Removed — MiRealSource-MiMLS
- 2004-11-08 Listed $149,900 REALCOMP
- 2004-11-02 Listed $149,900 MiRealSource-MiMLS
- 2004-02-25 Sold (Public Records) $144,000 Public Records
- 2004-02-10 Sold (MLS) $144,000 MiRealSource-MiMLS
- 2004-01-09 Listing Removed — MiRealSource-MiMLS
- 2003-12-30 Listed $149,900 MiRealSource-MiMLS
- 1995-01-31 Sold (Public Records) $89,900 Public Records
- 1994-07-12 Sold (Public Records) $15,000 Public Records
Property tax history
+3.1%/yrLatest (2025): $2,918 · +2.5% YoY. Source: county tax records.
Cash-flow waterfall
monthlySold comps — $/sqft
last 12 mo · ≤1 miLoading sold comps…