 🏷️ Likely Rental
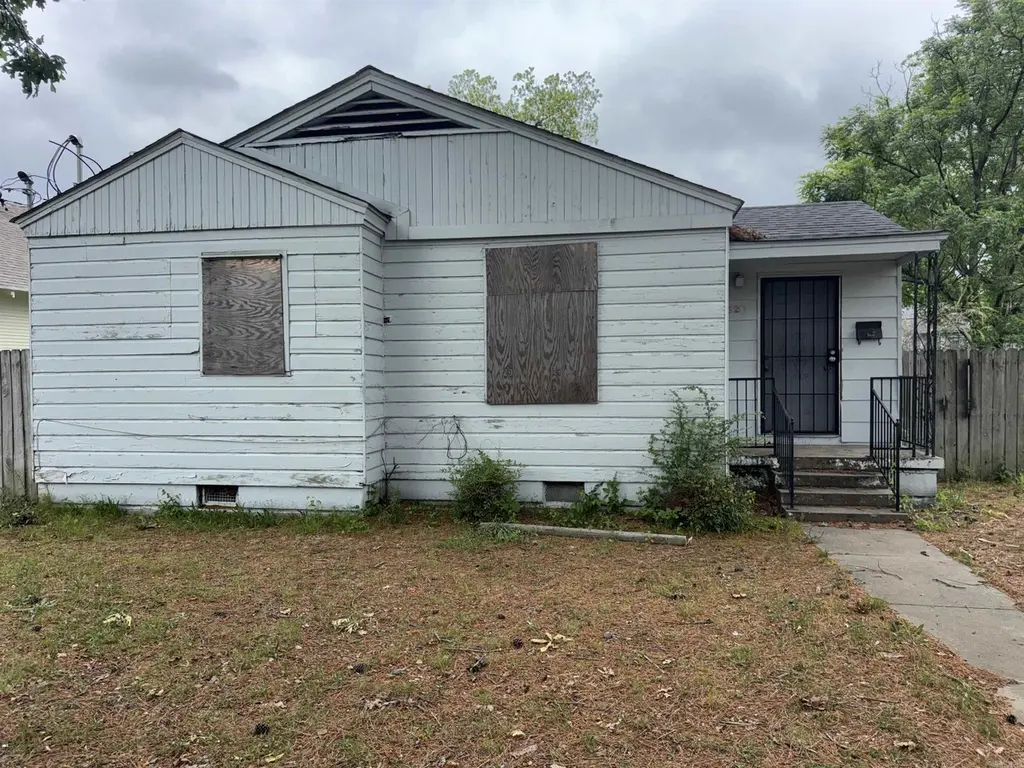
1620 Pike Ave · North Little Rock, AR
Flood risk No data
- FEMA flood zone
- —
- Chance of flooding over 30 yrs
- —
- Est. flood insurance / yr
- —
Fire risk No data
- Est. fire insurance / yr
- —
Heat risk No data
- Hot days now (above threshold)
- —
- Hot days in 30 yrs
- —
Wind risk No data
- Chance of severe wind over 30 yrs
- —
Air-quality risk No data
- Unhealthy air days now
- —
- Unhealthy air days in 30 yrs
- —
Risk factors via First Street. Map © Google.
Why this score? — see what drove the B grade
The composite is a weighted blend of 9 inputs, each scored 0–100. Each bar is that input's sub-score; the figure is the points it added to the 100-point composite (weight × sub-score).
- Cash flow +30.0/30.0
- 1% rule +10.0/10.0
- DSCR +10.0/10.0
- ARV discount +7.5/15.0
- Livability +3.7/5.0
- Appreciation +3.6/10.0
- Rent growth +3.3/5.0
- Condition / age +2.5/5.0
- Schools +2.0/10.0
$50,000
🖨 Deal sheet 📄 Offer letter ✓ Due diligence
Listing remarks
This 3-bedroom, 1-bath home offers approximately 1,122 square feet and a solid foundation for your next investment. Key improvements have already been completed, including updated plumbing, electrical, and roof—allowing you to focus primarily on cosmetic updates and HVAC installation. With the heavy lifting already handled, this property presents a straightforward path to increasing value and rental potential. Estimated market rent is around $1,100/month, making it an attractive option for investors looking to expand their portfolio or for buyers seeking a project with upside. Whether you're looking for your next flip or a long-term rental, this home offers a strong starting point wit
Key facts
- Updated electrical
- Updated roof
- Detached
Tags
Property features AI
Finance
- Other: Approx. lot size 6,650 sq ft (0.15 acre); Approx. living area 1,122; Taxes listed ($770)
- Financial info: Accepts conventional financing or cash
Exterior
- Parking: Parking pad for 1 car
- Utilities: Public sewer; Public water; Municipal electric service (Entergy)
- Home design: Wood exterior; Inside city limits
- Construction: Crawl space foundation; 3-tab shingle roof
- Exterior features: Level lot; Paved road
Interior
- Flooring: Other flooring (see remarks)
- Bathrooms: 1 full bathroom
- Heating & cooling: Other heating and cooling (see remarks)
- Interior features: Other interior features (see remarks)
Neighborhood map
What this means for you Summary
Snapshot
- This is a 3-bed/1.0-bath single-family listed at $50k.
Deal economics
- At list price, monthly cash flow is $556 ($7k/yr) — positive.
- The deal already cash-flows at list — no discount required.
- Meets the 1% rule at list price ($1k rent vs $50k).
- Recommended offer: $48k (3.0% below list) — sets the bar for market timing.
- Cap rate 19.6% vs local median 5.1% in North Little Rock — top-decile yield for the area; either an underpriced asset or a hidden risk that comps aren't pricing in. Stress-test before assuming the spread holds.
Location & tenants
- Location reads 73/100 on livability (#24 in AR) — a middle-class / working-renter tenant base. Strengths: commute A+, cost of living A+, housing A+; Watch: schools D+, crime F, amenities F.
- N. Little Rock School District (urban): math 21% / reading 26% proficiency, ranked #191 of 238 in AR (top 80%) — low school quality limits family demand, transient renter base, plan for 1-2y turnover; 66% free/reduced lunch — lower-income household profile, screen leases tightly.
- Market conditions: Rents rising (+3.1%/yr); 67 active listings in the ZIP; 40 comparable units currently listed for rent nearby; rentals lingering (median 44d on market — plan ~5-8 weeks vacancy on turnover, expect pricing pressure); 65% of comp listings sitting > 30 days — soft ceiling on asking rent; lower-income renter base — watch delinquency; 1,006 units permitted in Pulaski County in 2024 (0 in 5+ unit buildings).
- At $1,144/mo this rent would consume 45% of the median local household income ($30k/yr) (locally 995% of renters already pay >50% of income on rent) — very limited rent-growth headroom before tenants either downsize or default.
Forward outlook
- Local home prices are declining (-2.7%/yr); year-one equity from $346 of loan paydown is wiped out by about $1k of value loss. Plan a longer hold.
- Pulaski County population projected at +6% by 2050 — modest demand growth; plan on rents tracking national, not racing it.
- At projected returns (-2.7% appreciation + 3.1% rent growth), your $14k cash investment doubles in ~3 years — after that, you're playing with house money.
Negotiation context
- It's been on market 51 days — a 3% lower offer ($48k) is reasonable based on typical stale-listing flexibility.
- 2 sale attempts since 2y ago with the ask held roughly flat each time — persistent listings suggest the price (not the market) is what's stuck; bring a comps-based counter.
- Current owner paid $22k; list at $50k implies a 127% gain — meaningful room to come down on a strong offer.
Risks & watch-outs
- Watch-outs: built in 1947 — expect roof / HVAC / electrical / plumbing capex.
Questions for the listing agent
- It's been on market 51 days. Have you received any prior offers? Is the seller open to a 3% concession, seller financing, or rate buy-down credit?
- Built in 1947 — when were the roof, HVAC, electrical panel, plumbing, and water heater last replaced?
- Is there a deadline driving the sale (1031 exchange, divorce, estate, relocation)? That informs how much negotiation room exists.
- Schools are D-rated, which usually means shorter tenancies and higher turnover. Who's the typical renter profile here, and what's been the actual vacancy rate?
- Crime grade is F in this area — have there been break-ins, vandalism, or insurance claims at this property in the last 3 years? What carrier currently insures it and at what premium?
- What's the average days-on-market for RENTAL listings here right now (not sales)? A rising rental-DOM trend means longer vacancies and softer asking-rent achievability than the comps imply.
- What's the recent tenant-quality profile in this submarket — average credit score on applications, eviction rate, late-payment / NSF rate, and stable-employment percentage? A property-management company in the area should have these aggregated.
- How much new for-sale + rental construction is in the pipeline within 1–3 miles? Heavy new supply typically softens prices + rents 12–24 months out; constrained supply supports both.
Investment metrics
- 1% rule
- 2.29% ✓
- Cap rate
- 19.65%
- Cash-on-cash
- 47.70%
- DSCR
- 3.12
- GRM
- 3.6
CMA / ARV
- ARV (median comp)
- $124,841
- List price
- $50,000
- Delta
- -59.95%
- Verdict
- UNDERPRICED
- Comps
- 20 within 1.0 mi
Show comp detail 12 sales within ~0.75 mi
| Address | Dist | Beds/Ba | Sqft | Sold | Price | $/sf | Match |
|---|---|---|---|---|---|---|---|
| 1507 Marion St | 0.14mi | 2/1.0 (-1) | 1,072 (-4%) | 0mo | $65,000 | $61 | 81 |
| 1309 Parker St | 0.28mi | 3/1.0 | 1,170 (+4%) | 0mo | $115,000 | $98 | 80 |
| 1700 Schaer | 0.07mi | 3/2.0 | 1,216 (+8%) | 7mo | $135,000 | $111 | 73 |
| 1709 N Poplar St | 0.69mi | 2/1.0 (-1) | 1,116 (-0%) | 2mo | $69,000 | $62 | 60 |
| 816 W 20th St | 0.23mi | 2/1.0 (-1) | 994 (-11%) | 7mo | $18,000 | $18 | 60 |
| 234 Melrose Cir | 0.73mi | 2/1.0 (-1) | 1,144 (+2%) | 1mo | $168,000 | $147 | 57 |
| 2021 N Poplar St | 0.74mi | 2/1.0 (-1) | 1,108 (-1%) | 3mo | $70,000 | $63 | 56 |
| 100 Melrose Dv | 0.74mi | 2/1.0 (-1) | 1,104 (-2%) | 8mo | $200,000 | $181 | 52 |
| 1812 W Long 17th St | 0.49mi | 3/1.0 | 1,284 (+14%) | 6mo | $34,000 | $26 | 48 |
| 1215 W 7th St | 0.72mi | 2/1.0 (-1) | 1,040 (-7%) | 6mo | $108,000 | $104 | 44 |
| 1711 N Poplar St | 0.69mi | 2/1.0 (-1) | 1,247 (+11%) | 2mo | $69,000 | $55 | 43 |
| 1806 N Poplar St | 0.72mi | 2/1.0 (-1) | 1,271 (+13%) | 3mo | $67,000 | $53 | 36 |
Match score weights: distance 35% · size 25% · config 20% · recency 20%. Top-matched comps best support the ARV.
Projected returns pro-forma
-2.7% appreciation · 3.14% rent growth · sell at horizon
- IRR
- 45.7%
- Equity multiple
- 3.01×
- Total profit
- $28,136
- Equity at exit
- $8,113
- IRR
- 51.3%
- Equity multiple
- 6.10×
- Total profit
- $71,406
- Equity at exit
- $5,462
Cash invested: $14,000 (down + closing). Projections, not guarantees.
Landlord ↔ Tenant lean methodology
- Overall (STATE)
- 92 Strongly Landlord-Friendly
- State Arkansas
- 92 Strongly Landlord-Friendly · R+14
- County
- — inherits STATE
- City
- — inherits STATE
ZIP-level market 72114
- Home prices YoY
- -2.2%
- Rents YoY
- 3.1%
- Active inventory
- 67
- Price-to-rent
- 3.6×
Monthly cashflow live
- Estimated rent
- $1,144 high interval (Pro) →
- Mortgage (P&I)
- −$262
- Tax from tax record
- −$64 /mo · $770/yr
- Insurance
- −$21
- HOA
- −$0
- Vacancy / Maint / Mgmt
- −$240
- Net cashflow
- $556
Break-even live
UW: 25.0% down · 7.5% · 30yr · 1.5% tax · 5.0% vac · 8.0% maint · 8.0% mgmt
Financing live
Cash to close
- Down payment
- $12,500
- Closing costs
- $1,500
- Reserves months
- —
- Total cash needed
- —
Loan-product check · same deal, 3 products live
Conventional
25% down · 7.5% · 30yr
- Down + closing
- —
- Monthly P&I
- —
- Monthly cashflow
- —
- DSCR
- —
- Eligible?
- —
Personal DTI + credit; lowest rate.
DSCR
20% down · 8.5% · 30yr
- Down + closing
- —
- Monthly P&I
- —
- Monthly cashflow
- —
- DSCR
- —
- Eligible?
- —
No personal income docs; deal must DSCR.
Hard money
10% down · 12.0% · 12mo
- Down + closing
- —
- Monthly P&I
- —
- Monthly cashflow
- —
- DSCR
- —
- Eligible?
- —
Short-term bridge; refi at stabilization.
Rent comps 40 comps
| Address | Beds | Baths | Sqft | Rent | $/sqft | DOM | Units | Dist |
|---|---|---|---|---|---|---|---|---|
| 1603 Chandler St North Little Rock, AR | 2.0 | 1.0 | 1080 | $895 | $0.83 | 44d | 1 | 0.16mi |
| 1317 W 16th St North Little Rock, AR | 2.0 | 1.0 | 864 | $675 | $0.78 | 44d | 1 | 0.22mi |
| 823 W 20th St North Little Rock, AR | 3.0 | 2.0 | 1250 | $1,470 | $1.18 | 23d | 1 | 0.23mi |
| 600 W 18th St North Little Rock, AR | 3.0 | 1.0 | 1157 | $895 | $0.77 | 14d | 1 | 0.28mi |
| 128 College Park Cir Unit 1 North Little Rock, AR | 2.0 | 1.0 | 975 | $550 | $0.56 | 44d | 1 | 0.30mi |
| 1519 W 15th St North Little Rock, AR | 3.0 | 2.0 | 1250 | $1,470 | $1.18 | 44d | 1 | 0.35mi |
| 1603 W Long 17th St Unit B North Little Rock, AR | 3.0 | 1.0 | 1036 | $650 | $0.63 | 44d | 1 | 0.37mi |
| 1308 W 21st St North Little Rock, AR | 2.0 | 1.0 | 944 | $945 | $1.00 | 44d | 1 | 0.37mi |
| 1508 Sycamore St North Little Rock, AR | 2.0 | 1.0 | 1320 | $1,175 | $0.89 | 44d | 1 | 0.39mi |
| 1416 Willow St North Little Rock, AR | 2.0 | 1.0 | 995 | $1,999 | $2.01 | 44d | 1 | 0.46mi |
| 2316 Parker St North Little Rock, AR | 4.0 | 1.0 | 1146 | $1,195 | $1.04 | 23d | 1 | 0.46mi |
| 1100 W 24th St North Little Rock, AR | 3.0 | 1.0 | 1036 | $1,295 | $1.25 | 19d | 1 | 0.46mi |
| 2320 Franklin St North Little Rock, AR | 2.0 | 2.0 | 932 | $750 | $0.80 | 23d | 1 | 0.49mi |
| 1524 Orange St North Little Rock, AR | 3.0 | 2.0 | 1350 | $1,000 | $0.74 | 23d | 1 | 0.51mi |
| 1019 Frank St Unit B North Little Rock, AR | 2.0 | 1.0 | 806 | $850 | $1.05 | 44d | 1 | 0.56mi |
| 1236 W 10th St North Little Rock, AR | 3.0 | 1.0 | 1185 | $795 | $0.67 | 44d | 1 | 0.57mi |
| 1922 W Short 17th St Unit 2 North Little Rock, AR | 2.0 | 1.0 | 800 | $625 | $0.78 | 44d | 1 | 0.58mi |
| 1300 W 10th St North Little Rock, AR | 2.0 | 1.0 | 852 | $895 | $1.05 | 44d | 1 | 0.58mi |
| 2021 W Long 17th St North Little Rock, AR | 3.0 | 1.0 | 1268 | $895 | $0.71 | 44d | 1 | 0.64mi |
| 134 Melrose Cir North Little Rock, AR | 3.0 | 2.0 | 1322 | $1,750 | $1.32 | 21d | 1 | 0.70mi |
| 1920 N Poplar St North Little Rock, AR | 4.0 | 2.0 | 1422 | $1,595 | $1.12 | 14d | 1 | 0.72mi |
| 124 Melrose Cir North Little Rock, AR | 2.0 | 2.0 | 1200 | $1,950 | $1.62 | 14d | 1 | 0.74mi |
| 1913 N Magnolia St North Little Rock, AR | 2.0 | 1.0 | 816 | $675 | $0.83 | 44d | 1 | 0.75mi |
| 1600 N Olive St North Little Rock, AR | 3.0 | 1.0 | 1100 | $900 | $0.82 | 44d | 1 | 0.84mi |
| 1220 W 4th St North Little Rock, AR | 2.0 | 1.0 | 1315 | $2,150 | $1.63 | 23d | 1 | 0.85mi |
| 5 North Little Rock, AR | 1.0–2.0 | 1.0–2.0 | 1145 | $2,394 | $2.09 | 14d | 7 | 0.91mi |
| 1120 Rockwater Blvd North Little Rock, AR | 2.0 | 1.0–2.0 | 955 | $2,175 | $2.28 | 44d | 1 | 0.91mi |
| 306 W 6th St North Little Rock, AR | 2.0 | 2.0 | 1100 | $1,750 | $1.59 | 44d | 1 | 0.94mi |
| 408 W 4th St North Little Rock, AR | 2.0 | 1.5 | 1360 | $1,395 | $1.03 | 44d | 1 | 1.00mi |
| 800 N Olive St North Little Rock, AR | 2.0 | 1.5 | 1142 | $1,500 | $1.31 | 44d | 1 | 1.06mi |
| 407 W 33rd St North Little Rock, AR | 3.0 | 2.0 | 1472 | $1,025 | $0.70 | 44d | 1 | 1.10mi |
| 111 E 4th St North Little Rock, AR | 1.0–2.0 | 1.0–2.0 | 883 | $1,320 | $1.49 | 14d | 6 | 1.14mi |
| 218 W 33rd Pl North Little Rock, AR | 2.0 | 1.0 | 792 | $800 | $1.01 | 44d | 1 | 1.14mi |
| 3423 Chandler St Unit B North Little Rock, AR | 2.0 | 1.0 | 928 | $725 | $0.78 | 44d | 1 | 1.15mi |
| 127 Crestview Dr Unit 3 North Little Rock, AR | 2.0 | 1.0 | 880 | $825 | $0.94 | 44d | 1 | 1.16mi |
| 300 Cherry Hill Dr Unit 5 North Little Rock, AR | 2.0 | 1.0 | 880 | $825 | $0.94 | 44d | 1 | 1.17mi |
| 508 W 35th St North Little Rock, AR | 2.0 | 1.0 | 876 | $850 | $0.97 | 23d | 1 | 1.19mi |
| 3403 Ridge Rd North Little Rock, AR | 2.0 | 1.0 | 714 | $895 | $1.25 | 44d | 1 | 1.19mi |
| 1512 W 35th St North Little Rock, AR | 2.0 | 1.0 | 848 | $875 | $1.03 | 14d | 1 | 1.20mi |
| 509 W 35th St North Little Rock, AR | 2.0 | 1.0 | 740 | $800 | $1.08 | 44d | 1 | 1.21mi |
Listing history 21 events
-
2026-06-18days on market $50,000 Active 51 DOM
-
2026-06-17days on market $50,000 Active 50 DOM
-
2026-06-16days on market $50,000 Active 49 DOM
-
2026-06-15days on market $50,000 Active 48 DOM
-
2026-06-14days on market $50,000 Active 46 DOM
-
2026-06-13days on market $50,000 Active 45 DOM
-
2026-06-10days on market $50,000 Active 43 DOM
-
2026-06-09days on market $50,000 Active 42 DOM
-
2026-06-08days on market $50,000 Active 41 DOM
-
2026-06-07days on market $50,000 Active 40 DOM
-
2026-06-05days on market $50,000 Active 37 DOM
-
2026-06-03days on market $50,000 Active 36 DOM
-
2026-06-02days on market $50,000 Active 35 DOM
-
2026-06-01days on market $50,000 Active 34 DOM
-
2026-05-31days on market $50,000 Active 33 DOM
-
2026-05-31days on market $50,000 Active 32 DOM
-
2026-04-27$50,000 New Listing 737-char remark
-
2024-11-29historical
-
2024-08-09$75,000 New Listing
-
2022-09-01price $875
-
2003-07-08soldstatus $22,000
ⓘ Source: listings_history table (triggers on properties + properties_extension) + one-shot
backfill from property_details.listing_events for pre-trigger history.
Tax reassessment forecast AR · Resets to sale price
- Current annual tax
- $770 · $64/mo
- Projected year-2 tax
- $770 · $64/mo
- Expected delta
- $0/yr ($0/mo · 0.0%)
ⓘ Screening estimate from a state-policy table — verify with the county assessor before closing.
Nearby sold comps map
Loading sold comps map…
Walkable amenities ~0.75 mi
Loading nearby amenities…
Taxation est. · year 1
- Rental income
- $13,727
- − Mortgage interest
- −$2,801
- − Property taxes
- −$770
- − Insurance
- −$250
- − Repairs & maintenance
- −$1,098
- − Management
- −$1,098
- − Depreciation
- −$1,455
- Taxable income
- $6,255
- Est. tax owed @ 24.0%
- −$1,501
- After-tax cash flow
- $5,176/yr
For passive investors: Depreciation is non-cash, so a rental often shows a tax loss while cash-flowing — sheltering income. Rental losses are passive: they offset passive income freely, and up to $25,000/yr can offset ordinary (W-2) income if you actively participate and your MAGI is under $100k (phasing out to $0 by $150k); unused losses carry forward. On sale, claimed depreciation is recaptured at up to 25%, and gains may owe capital-gains tax (a 1031 exchange can defer both). Figures are a year-1 estimate at your 24.0% rate — not tax advice; consult a CPA.
Schools (NCES district)
- District
- N. Little Rock School District
- NCES district ID
- 0510680
- Math proficiency
- 21% ▼ -11.00%
- Reading proficiency
- 26% ▼ -9.00%
- Median HH income
- $38,325
- Composite
- 19.69/100
- National rank
- #8728
- State rank
- #191 of 238 in AR
Livability — North Little Rock
- Score
- 73/100
- State rank
- #24
- US rank
- #5452
Category grades
Schools grade is shown separately in the Schools card above.
Census & demographics
- Census place
- North Little Rock, AR
- County
- Pulaski County · 372,764 people
- City population
- 55,470
- Metro
- Little Rock-North Little Rock-Conway, AR
- Population (ZIP)
- 10,093
- Household income
- $30,175
- Rent vs Own
- Severe rent burden
- 995.0
Population outlook (Pulaski County) Hauer SSP2
- Today (2025)
- 415,378 people
- By 2030
- 423,720 · +2.0%
- By 2040
- 435,182 · +4.8%
- By 2050
- 440,904 · +6.1%
- By 2075
- 445,521 · +7.3%
- By 2100
- 419,173 · +0.9%
Race, ethnicity, and origin ACS 2023
- Neighborhood character
- Predominantly Black (70%)
- Race & ethnicity
- Black 70% White 23% Hispanic / Latino 4% Two or more races 3%
- Common ancestry
- Slovak 1% Serbian 1%
- Foreign-born
- 3% · Canada, South Korea
- Languages at home
- 96% English-only · Spanish 2% Other Indo-European 1% Other Asian/Pacific 0%
Political lean MEDSL · Pulaski
- 2024 margin
- Strong D (+22.1) · D 59.8% · R 37.7% · Other 2.5%
- 2008→2024 swing
- +10.6pp toward D · 2008: 11.6pp · 2024: 22.1pp
- All cycles
- 2024: D+22.1 2020: D+22.5 2016: D+17.9 2012: D+11.4 2008: D+11.6
Not yet ingested
- Civics
- —
Market trends
- HPI YoY
- ▼ -2.70%
- Current HPI
- 121.4243
- Rent YoY
- ▲ 3.14%
- Metro
- Little Rock-North Little Rock-Conway, AR
- State GDP YoY
- ▲ 3.80%
- F500 in state
- 10
Industry mix (Fortune 500 HQ in AR)
| Industry | F500 HQs | Revenue |
|---|---|---|
| Retail | 1 | $681B |
|
||
| Food / Agriculture | 1 | $53B |
|
||
| Retail / Energy | 1 | $22B |
|
||
| Transportation / Logistics | 1 | $12B |
|
||
| Energy | 1 | $4B |
|
||
Price history
+127.3% since first listed5 events — show timeline
- 2026-04-27 Listed $50,000 CARMLS
- 2024-11-29 Listing Removed — CARMLS
- 2024-08-09 Listed $75,000 CARMLS
- 2022-09-01 Price Changed $875 RENT.
- 2003-07-08 Sold (Public Records) $22,000 Public Records
Property tax history
+4.0%/yrLatest (2025): $770 · +78.7% YoY. Source: county tax records.
Cash-flow waterfall
monthlySold comps — $/sqft
last 12 mo · ≤1 miLoading sold comps…