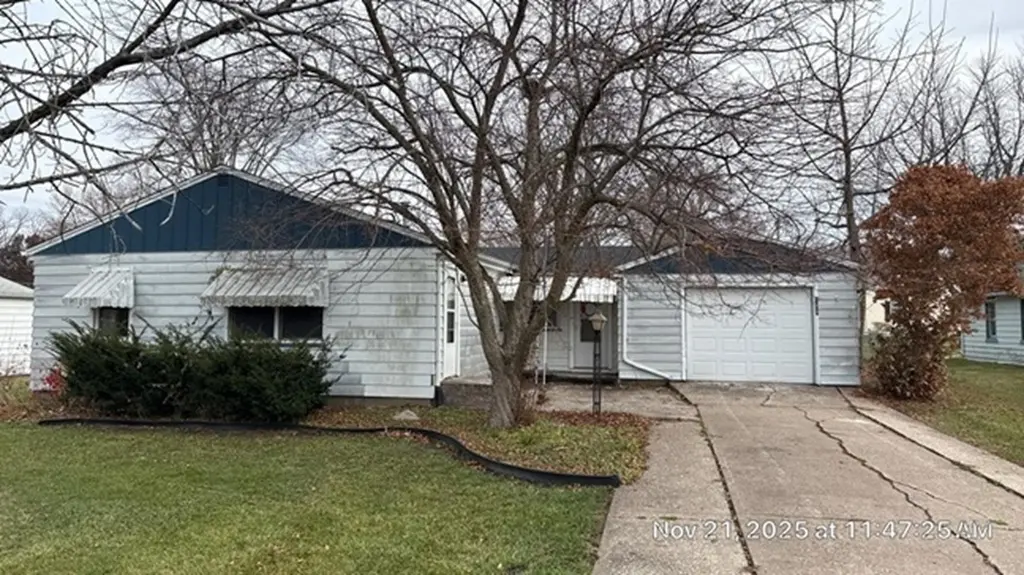
11315 16th St · Coyne Center, IL
Flood risk 1/10 · Minimal
- FEMA flood zone
- X (unshaded)
- Chance of flooding over 30 yrs
- 0.0%
- Est. flood insurance / yr
- $507 – $1,088
Fire risk 1/10 · Minimal
- Est. fire insurance / yr
- $804 – $1,492
Heat risk 3/10 · Minor
- Hot days now (above 103°F)
- 7 days/yr
- Hot days in 30 yrs
- 16 days/yr
Wind risk 2/10 · Minimal
- Chance of severe wind over 30 yrs
- —
Air-quality risk 2/10 · Minimal
- Unhealthy air days now
- 2 days/yr
- Unhealthy air days in 30 yrs
- 2 days/yr
Risk factors via First Street. Map © Google.
Why this score? — see what drove the C+ grade
The composite is a weighted blend of 9 inputs, each scored 0–100. Each bar is that input's sub-score; the figure is the points it added to the 100-point composite (weight × sub-score).
- Cash flow +25.6/30.0
- ARV discount +12.5/15.0
- DSCR +8.5/10.0
- 1% rule +6.8/10.0
- Livability +3.4/5.0
- Schools +2.7/10.0
- Rent growth +2.5/5.0
- Condition / age +2.5/5.0
- Appreciation +0.0/10.0
$104,900
🖨 Deal sheet 📄 Offer letter ✓ Due diligence
Listing remarks MLS
Lovely 2-bedroom, 1 bath, 1 car garage with new roof and large yard *** This property is eligible under the Freddie Mac First Look Initiative for owner occupants through 02/02/2026 *** Seller will not complete any repairs to the subject property, either lender or buyer requested. The property is sold in AS IS condition ***
Key facts
- Large yard
- New roof
- Garage
Tags
Neighborhood map
What this means for you Summary
Snapshot
- This is a 2-bed/1.0-bath other listed at $105k.
Deal economics
- At list price, monthly cash flow is $247 ($3k/yr) — positive.
- The deal already cash-flows at list — no discount required.
- Meets the 1% rule at list price ($1k rent vs $105k).
- Recommended offer: $92k (12.0% below list) — sets the bar for market timing.
Location & tenants
- Location reads 67/100 on livability (#526 in IL) — a middle-class / working-renter tenant base. Strengths: crime A+, employment A+, housing A+; Watch: schools F, amenities F, commute F.
- Sherrard CUSD 200 (rural): math 29% / reading 30% proficiency, ranked #240 of 620 in IL (top 39%) — low school quality limits family demand, transient renter base, plan for 1-2y turnover.
- Market conditions: 33 active listings in the ZIP; 116 units permitted in Rock Island County in 2024 (50 in 5+ unit buildings).
Forward outlook
- Local home prices are declining (-3.0%/yr); year-one equity from $725 of loan paydown is wiped out by about $3k of value loss. Plan a longer hold.
- Rock Island County population projected at -12% by 2050 — secular population decline; favor cash flow + early exit over multi-decade hold.
Negotiation context
- It's been on market 156 days — a 12% lower offer ($92k) is reasonable based on typical stale-listing flexibility.
- 2 sale attempts since 24y ago; this cycle's ask has dropped $15k (13%) from the opening price — seller is motivated, your offer sets the floor, not the list.
- Current owner paid $73k; 44% above their basis — modest negotiation headroom, anchor on the comps not their cost.
Questions for the listing agent
- It's been on market 156 days. Have you received any prior offers? Is the seller open to a 12% concession, seller financing, or rate buy-down credit?
- Built in 1962 — when were the roof, HVAC, electrical panel, plumbing, and water heater last replaced?
- Why hasn't it sold? Are there any deal-killer items the seller is aware of (foundation, flood, title, zoning, code violations)?
- Is there a deadline driving the sale (1031 exchange, divorce, estate, relocation)? That informs how much negotiation room exists.
- Schools are F-rated, which usually means shorter tenancies and higher turnover. Who's the typical renter profile here, and what's been the actual vacancy rate?
- What's the average days-on-market for RENTAL listings here right now (not sales)? A rising rental-DOM trend means longer vacancies and softer asking-rent achievability than the comps imply.
- What's the recent tenant-quality profile in this submarket — average credit score on applications, eviction rate, late-payment / NSF rate, and stable-employment percentage? A property-management company in the area should have these aggregated.
- How much new for-sale + rental construction is in the pipeline within 1–3 miles? Heavy new supply typically softens prices + rents 12–24 months out; constrained supply supports both.
Investment metrics
- 1% rule
- 1.18% ✓
- Cap rate
- 9.12%
- Cash-on-cash
- 10.10%
- DSCR
- 1.45
- GRM
- 7.1
CMA / ARV
- ARV (median comp)
- $118,101
- List price
- $104,900
- Delta
- -11.18%
- Verdict
- UNDERPRICED
- Comps
- 20 within 1.0 mi
Projected returns pro-forma
-3.0% appreciation · 3.0% rent growth · sell at horizon
- IRR
- -1.1%
- Equity multiple
- 0.96×
- Total profit
- $-1,232
- Equity at exit
- $15,641
- IRR
- 8.6%
- Equity multiple
- 1.66×
- Total profit
- $19,285
- Equity at exit
- $9,070
Cash invested: $29,372 (down + closing). Projections, not guarantees.
Landlord ↔ Tenant lean methodology
- Overall (STATE)
- 43 Moderately Tenant-Leaning
- State Illinois
- 43 Moderately Tenant-Leaning · D+7
- County
- — inherits STATE
- City
- — inherits STATE
ZIP-level market 61264
- Active inventory
- 33
- Price-to-rent
- 7.1×
Monthly cashflow live
- Estimated rent
- $1,234 medium interval (Pro) →
- Mortgage (P&I)
- −$550
- Tax from tax record
- −$134 /mo · $1,605/yr
- Insurance
- −$44
- HOA
- −$0
- Vacancy / Maint / Mgmt
- −$259
- Net cashflow
- $247
Break-even live
UW: 25.0% down · 7.5% · 30yr · 1.5% tax · 5.0% vac · 8.0% maint · 8.0% mgmt
Financing live
Cash to close
- Down payment
- $26,225
- Closing costs
- $3,147
- Reserves months
- —
- Total cash needed
- —
Loan-product check · same deal, 3 products live
Conventional
25% down · 7.5% · 30yr
- Down + closing
- —
- Monthly P&I
- —
- Monthly cashflow
- —
- DSCR
- —
- Eligible?
- —
Personal DTI + credit; lowest rate.
DSCR
20% down · 8.5% · 30yr
- Down + closing
- —
- Monthly P&I
- —
- Monthly cashflow
- —
- DSCR
- —
- Eligible?
- —
No personal income docs; deal must DSCR.
Hard money
10% down · 12.0% · 12mo
- Down + closing
- —
- Monthly P&I
- —
- Monthly cashflow
- —
- DSCR
- —
- Eligible?
- —
Short-term bridge; refi at stabilization.
Listing history 22 events
-
2026-06-18days on market $104,900 Active 156 DOM
-
2026-06-17days on market $104,900 Active 155 DOM
-
2026-06-16days on market $104,900 Active 154 DOM
-
2026-06-15days on market $104,900 Active 153 DOM
-
2026-06-13days on market $104,900 Active 151 DOM
-
2026-06-12days on market $104,900 Active 150 DOM
-
2026-06-07days on market $104,900 Active 148 DOM
-
2026-06-04days on market $104,900 Active 145 DOM
-
2026-06-02days on market $104,900 Active 144 DOM
-
2026-06-01days on market $104,900 Active 143 DOM
-
2026-05-31days on market $104,900 Active 142 DOM
-
2026-05-31days on market $104,900 Active 141 DOM
-
2026-04-28price $104,900 324-char remark
Show marketing remark (324 chars)
Lovely 2-bedroom, 1 bath, 1 car garage with new roof and large yard *** This property is eligible under the Freddie Mac First Look Initiative for owner occupants through 02/02/2026 *** Seller will not complete any repairs to the subject property, either lender or buyer requested. The property is sold in AS IS condition ***
-
2026-03-23price $109,900 324-char remark
Show marketing remark (324 chars)
Lovely 2-bedroom, 1 bath, 1 car garage with new roof and large yard *** This property is eligible under the Freddie Mac First Look Initiative for owner occupants through 02/02/2026 *** Seller will not complete any repairs to the subject property, either lender or buyer requested. The property is sold in AS IS condition ***
-
2026-03-03price $114,900 324-char remark
Show marketing remark (324 chars)
Lovely 2-bedroom, 1 bath, 1 car garage with new roof and large yard *** This property is eligible under the Freddie Mac First Look Initiative for owner occupants through 02/02/2026 *** Seller will not complete any repairs to the subject property, either lender or buyer requested. The property is sold in AS IS condition ***
-
2026-01-09$119,900 Active 324-char remark
Show marketing remark (324 chars)
Lovely 2-bedroom, 1 bath, 1 car garage with new roof and large yard *** This property is eligible under the Freddie Mac First Look Initiative for owner occupants through 02/02/2026 *** Seller will not complete any repairs to the subject property, either lender or buyer requested. The property is sold in AS IS condition ***
-
2002-11-21soldstatus $73,000
-
2002-11-20soldstatus $73,000
-
2002-10-25soldstatus $92,500
-
2002-09-09$79,900
-
1997-11-12soldstatus $51,000
-
1997-11-12soldstatus $51,000
ⓘ Source: listings_history table (triggers on properties + properties_extension) + one-shot
backfill from property_details.listing_events for pre-trigger history.
Tax reassessment forecast IL · Partial reset (capped growth)
- Current annual tax
- $1,605 · $134/mo
- Projected year-2 tax
- $1,993 · $166/mo
- Expected delta
- +$388/yr (+$32/mo · 24.2%)
ⓘ Screening estimate from a state-policy table — verify with the county assessor before closing.
Climate risk First Street
- Flood 1/10 Low FEMA zone X (unshaded) · 0% chance over 30 yrs
- Wildfire 1/10 Low
- Heat 3/10 Moderate 7 d/yr ≥103°F today · 16 d/yr by 30 yrs out
- Wind 2/10 Low
- Air quality 2/10 Low 2 unhealthy d/yr today · 2 by 30 yrs out
Nearby sold comps map
Loading sold comps map…
Walkable amenities ~0.75 mi
Loading nearby amenities…
Taxation est. · year 1
- Rental income
- $14,807
- − Mortgage interest
- −$5,876
- − Property taxes
- −$1,605
- − Insurance
- −$524
- − Repairs & maintenance
- −$1,185
- − Management
- −$1,185
- − Depreciation
- −$3,052
- Taxable income
- $1,381
- Est. tax owed @ 24.0%
- −$331
- After-tax cash flow
- $2,635/yr
For passive investors: Depreciation is non-cash, so a rental often shows a tax loss while cash-flowing — sheltering income. Rental losses are passive: they offset passive income freely, and up to $25,000/yr can offset ordinary (W-2) income if you actively participate and your MAGI is under $100k (phasing out to $0 by $150k); unused losses carry forward. On sale, claimed depreciation is recaptured at up to 25%, and gains may owe capital-gains tax (a 1031 exchange can defer both). Figures are a year-1 estimate at your 24.0% rate — not tax advice; consult a CPA.
Schools (NCES district)
- District
- Sherrard CUSD 200
- NCES district ID
- 1736180
- Math proficiency
- 29% ▼ -9.00%
- Reading proficiency
- 30% ▼ -16.00%
- Median HH income
- $60,194
- Composite
- 26.77/100
- National rank
- #7129
- State rank
- #240 of 620 in IL
Livability — Coyne Center
- Score
- 67/100
- State rank
- #526
- US rank
- #10896
Category grades
Schools grade is shown separately in the Schools card above.
Census & demographics
- Census place
- Coyne Center, IL
- Population (ZIP)
- 10,056
Population outlook (Rock Island County) Hauer SSP2
- Today (2025)
- 140,982 people
- By 2030
- 137,705 · -2.3%
- By 2040
- 130,512 · -7.4%
- By 2050
- 123,841 · -12.2%
- By 2075
- 109,851 · -22.1%
- By 2100
- 90,922 · -35.5%
Race, ethnicity, and origin ACS 2023
- Neighborhood character
- Predominantly White (89%)
- Race & ethnicity
- White 89% Hispanic / Latino 5% Two or more races 5% Black 1% Asian 1%
- Hispanic origin (detail)
- Mexican 4%
- Common ancestry
- English 3% Romanian 2% Portuguese 2%
- Foreign-born
- 2% · Canada
- Languages at home
- 97% English-only · Spanish 2% Other Asian/Pacific 1%
Political lean MEDSL · Rock Island
- 2024 margin
- Lean D (+9.6) · D 53.9% · R 44.4% · Other 1.7%
- 2008→2024 swing
- -15.0pp toward R · 2008: 24.6pp · 2024: 9.6pp
- All cycles
- 2024: D+9.6 2020: D+12.1 2016: D+8.4 2012: D+21.9 2008: D+24.6
Not yet ingested
- Civics
- —
Market trends
- HPI YoY
- ▼ -126.95%
- Current HPI
- 160.4359
- Rent YoY
- —
- Metro
- —
- State GDP YoY
- ▲ 1.59%
- F500 in state
- 60
Industry mix (Fortune 500 HQ in IL)
| Industry | F500 HQs | Revenue |
|---|---|---|
| Insurance | 4 | $201B |
|
||
| Consumer Goods | 4 | $87B |
|
||
| Industrial Machinery | 3 | $64B |
|
||
| Healthcare | 2 | $55B |
|
||
| Retail / Pharmacy | 1 | $148B |
|
||
| Agriculture / Food | 1 | $86B |
|
||
Price history
+105.7% since first listed10 events — show timeline
- 2026-04-28 Price Changed $104,900 MRED as Distributed by MLS Grid
- 2026-03-23 Price Changed $109,900 MRED as Distributed by MLS Grid
- 2026-03-03 Price Changed $114,900 MRED as Distributed by MLS Grid
- 2026-01-09 Listed $119,900 MRED as Distributed by MLS Grid
- 2002-11-21 Sold (Public Records) $73,000 Public Records
- 2002-11-20 Sold (MLS) $73,000 RMLSA as Distributed by MLS Grid
- 2002-10-25 Sold (Public Records) $92,500 Public Records
- 2002-09-09 Listed $79,900 RMLSA as Distributed by MLS Grid
- 1997-11-12 Sold (Public Records) $51,000 Public Records
- 1997-11-12 Sold (Public Records) $51,000 Public Records
Property tax history
-1.0%/yrLatest (2024): $1,605 · +7.2% YoY. Source: county tax records.
Cash-flow waterfall
monthlySold comps — $/sqft
last 12 mo · ≤1 miLoading sold comps…