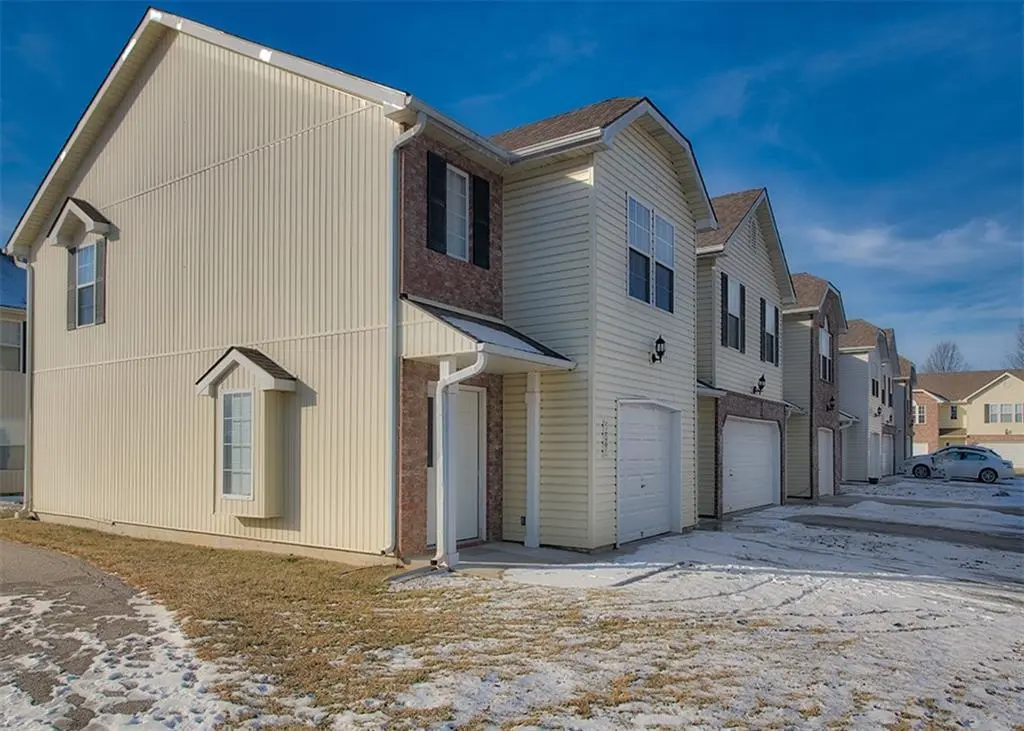
 Triplex
273-277 NE Adams Dairy Pkwy · Blue Springs, MO
Flood risk 1/10 · Minimal
- FEMA flood zone
- X (unshaded)
- Chance of flooding over 30 yrs
- 0.0%
- Est. flood insurance / yr
- $507 – $1,088
Fire risk 3/10 · Minor
- Est. fire insurance / yr
- $1,054 – $1,958
Heat risk 4/10 · Minor
- Hot days now (above 108°F)
- 7 days/yr
- Hot days in 30 yrs
- 16 days/yr
Wind risk 2/10 · Minimal
- Chance of severe wind over 30 yrs
- —
Air-quality risk 4/10 · Minor
- Unhealthy air days now
- 5 days/yr
- Unhealthy air days in 30 yrs
- 5 days/yr
Risk factors via First Street. Map © Google.
Why this score? — see what drove the D+ grade
The composite is a weighted blend of 9 inputs, each scored 0–100. Each bar is that input's sub-score; the figure is the points it added to the 100-point composite (weight × sub-score).
- Cash flow +19.6/30.0
- DSCR +6.2/10.0
- 1% rule +5.9/10.0
- Schools +5.1/10.0
- Livability +4.1/5.0
- Rent growth +3.8/5.0
- Condition / age +2.5/5.0
- ARV discount +0.0/15.0
- Appreciation +0.0/10.0
$500,000
🖨 Deal sheet 📄 Offer letter ✓ Due diligence
Multi-family units
County records classify this as Multi-Family (2-4 Unit). Listing-text estimate: 3 units. confirmed
Listing remarks MLS
This a great income & equity producing property. If you are looking for a completely passive investment with upside this is for you. The onsite property management handles everything! Sit back and get your mailbox money. The seller has recently replaced 2 HVAC systems and most of the appliances. The HOA is responsible for roof replacements and exterior maintenance.
Key facts
- 2,515 sq ft lot
- Garage
- Built 2006
Neighborhood map
What this means for you Summary
Snapshot
- This is a 3 × 3-bed/2-bath units multifamily listed at $500k.
Deal economics
- At list price, monthly cash flow is $577 ($7k/yr) — positive. Per door: $192/mo.
- The deal already cash-flows at list — no discount required.
- Meets the 1% rule at list price ($5k rent vs $500k).
- Recommended offer: $440k (12.0% below list) — sets the bar for market timing.
- Cap rate 7.7% vs local median 3.2% in Blue Springs — top-decile yield for the area; either an underpriced asset or a hidden risk that comps aren't pricing in. Stress-test before assuming the spread holds.
Location & tenants
- Location reads 82/100 on livability (#11 in MO, #1,297 nationally) — a professional / high-income tenant draw. Strengths: cost of living A+, housing A+, health & safety A+; Watch: commute F.
- Blue Springs R-IV (suburban): math 55% / reading 60% proficiency, ranked #17 of 324 in MO (top 5%) — acceptable for families but not a draw, mixed tenant base, ~2y average lease.
- Market conditions: Rents rising fast (+5.1%/yr); 239 active listings in the ZIP; solid renter incomes; 4,002 units permitted in Jackson County in 2024 (2,271 in 5+ unit buildings).
- At $5,440/mo this rent would consume 72% of the median local household income ($90k/yr) (locally 888% of renters already pay >50% of income on rent) — very limited rent-growth headroom before tenants either downsize or default.
Forward outlook
- Local home prices are declining (-3.0%/yr); year-one equity from $3k of loan paydown is wiped out by about $15k of value loss. Plan a longer hold.
- Jackson County population projected at +4% by 2050 — modest demand growth; plan on rents tracking national, not racing it.
Negotiation context
- It's been on market 195 days — a 12% lower offer ($440k) is reasonable based on typical stale-listing flexibility.
- 3 sale attempts since 2y ago; this cycle's ask has dropped $50k (9%) from the opening price — seller is motivated, your offer sets the floor, not the list.
Questions for the listing agent
- It's been on market 195 days. Have you received any prior offers? Is the seller open to a 12% concession, seller financing, or rate buy-down credit?
- Can we see the unit-by-unit rent roll, current vacancy, and any below-market leases? What's the average tenancy length?
- What capital expenditures (roof, boiler, parking lot, exteriors) have been made in the last 5 years, and what's planned in the next 2?
- What does the HOA fee cover, when was the last increase, and are there any pending special assessments or reserve-fund shortfalls?
- Why hasn't it sold? Are there any deal-killer items the seller is aware of (foundation, flood, title, zoning, code violations)?
- Is there a deadline driving the sale (1031 exchange, divorce, estate, relocation)? That informs how much negotiation room exists.
- Schools are A-rated — typically a magnet for longer-tenancy family renters. What's the average tenant stay here, and is there a school-zone premium baked into asking?
- The area grade is low — what's the realistic commute time and amenity access for the typical tenant pool here? Any planned neighborhood developments (good or bad) we should know about?
- What's the average days-on-market for RENTAL listings here right now (not sales)? A rising rental-DOM trend means longer vacancies and softer asking-rent achievability than the comps imply.
- What's the recent tenant-quality profile in this submarket — average credit score on applications, eviction rate, late-payment / NSF rate, and stable-employment percentage? A property-management company in the area should have these aggregated.
- How much new apartment / multifamily construction is in the pipeline within 1–3 miles? Heavy new supply (>2% of stock underway) typically softens rents 12–24 months out; light construction supports rent growth.
Investment metrics
- 1% rule
- 1.09% ✓
- Cap rate
- 7.68%
- Cash-on-cash
- 4.94%
- DSCR
- 1.22
- GRM
- 7.7
CMA / ARV
- ARV (on-the-fly)
- $344,782
- Comps found
- 1
Show comp detail 1 sale within ~0.75 mi
| Address | Dist | Beds/Ba | Sqft | Sold | Price | $/sf | Match |
|---|---|---|---|---|---|---|---|
| 200 NE Knox St | 0.44mi | 8/4.0 (+1) | 3,980 (-4%) | 6mo | $330,000 | $83 | 54 |
Match score weights: distance 35% · size 25% · config 20% · recency 20%. Top-matched comps best support the ARV.
Projected returns pro-forma
-3.0% appreciation · 5.12% rent growth · sell at horizon
- IRR
- -6.1%
- Equity multiple
- 0.77×
- Total profit
- $-32,209
- Equity at exit
- $74,552
- IRR
- 6.2%
- Equity multiple
- 1.51×
- Total profit
- $71,009
- Equity at exit
- $43,231
Cash invested: $140,000 (down + closing). Projections, not guarantees.
Landlord ↔ Tenant lean methodology
- Overall (STATE)
- 81 Strongly Landlord-Friendly
- State Missouri
- 81 Strongly Landlord-Friendly · R+10
- County
- — inherits STATE
- City
- — inherits STATE
ZIP-level market 64014
- Rents YoY
- 5.1%
- Active inventory
- 239
- Price-to-rent
- 23.0×
Monthly cashflow live
- Estimated rent
- $5,440 high interval (Pro) →
- Mortgage (P&I)
- −$2,622
- Tax from tax record
- −$564 /mo · $6,764/yr
- Insurance
- −$208
- HOA
- −$327
- Vacancy / Maint / Mgmt
- −$1,142
- Net cashflow
- $577
Break-even live
3-unit breakdown (identical units grouped — click to expand)
| Units | Beds | Baths | Est. rent |
|---|---|---|---|
| 3× units | 3 | 2 | $5,439 |
| #1 | 3 | 2 | $1,813 |
| #2 | 3 | 2 | $1,813 |
| #3 | 3 | 2 | $1,813 |
| Total (3 units) | $5,440 | ||
UW: 25.0% down · 7.5% · 30yr · 1.5% tax · 5.0% vac · 8.0% maint · 8.0% mgmt
Financing live
Cash to close
- Down payment
- $125,000
- Closing costs
- $15,000
- Reserves months
- —
- Total cash needed
- —
Loan-product check · same deal, 3 products live
Conventional
25% down · 7.5% · 30yr
- Down + closing
- —
- Monthly P&I
- —
- Monthly cashflow
- —
- DSCR
- —
- Eligible?
- —
Personal DTI + credit; lowest rate.
DSCR
20% down · 8.5% · 30yr
- Down + closing
- —
- Monthly P&I
- —
- Monthly cashflow
- —
- DSCR
- —
- Eligible?
- —
No personal income docs; deal must DSCR.
Hard money
10% down · 12.0% · 12mo
- Down + closing
- —
- Monthly P&I
- —
- Monthly cashflow
- —
- DSCR
- —
- Eligible?
- —
Short-term bridge; refi at stabilization.
HOA detail
- Monthly dues
- $327 · $3,924/yr
- Likely covers
- exterior maint.
Listing history 23 events
-
2026-06-18days on market $500,000 Active 195 DOM
-
2026-06-17days on market $500,000 Active 194 DOM
-
2026-06-16days on market $500,000 Active 193 DOM
-
2026-06-15days on market $500,000 Active 192 DOM
-
2026-06-13days on market $500,000 Active 190 DOM
-
2026-06-13days on market $500,000 Active 189 DOM
-
2026-06-09days on market $500,000 Active 186 DOM
-
2026-06-08days on market $500,000 Active 185 DOM
-
2026-06-07days on market $500,000 Active 184 DOM
-
2026-06-05days on market $500,000 Active 181 DOM
-
2026-06-03days on market $500,000 Active 180 DOM
-
2026-06-02days on market $500,000 Active 179 DOM
-
2026-06-01days on market $500,000 Active 178 DOM
-
2026-05-31days on market $500,000 Active 177 DOM
-
2026-05-06price $500,000 373-char remark
Show marketing remark (373 chars)
This a great income & equity producing property. If you are looking for a completely passive investment with upside this is for you. The onsite property management handles everything! Sit back and get your mailbox money. The seller has recently replaced 2 HVAC systems and most of the appliances. The HOA is responsible for roof replacements and exterior maintenance.
-
2025-12-05$549,900 Active 373-char remark
Show marketing remark (373 chars)
This a great income & equity producing property. If you are looking for a completely passive investment with upside this is for you. The onsite property management handles everything! Sit back and get your mailbox money. The seller has recently replaced 2 HVAC systems and most of the appliances. The HOA is responsible for roof replacements and exterior maintenance.
-
2025-11-23historical
-
2025-09-26price $549,900
-
2025-05-23$600,000 Active
-
2025-03-11historical
-
2024-09-11$600,000 Active
-
2022-04-16price $1,199
-
2007-08-20soldstatus
ⓘ Source: listings_history table (triggers on properties + properties_extension) + one-shot
backfill from property_details.listing_events for pre-trigger history.
Tax reassessment forecast MO · Resets to sale price
- Current annual tax
- $6,764 · $564/mo
- Projected year-2 tax
- $6,764 · $564/mo
- Expected delta
- $0/yr ($0/mo · 0.0%)
ⓘ Screening estimate from a state-policy table — verify with the county assessor before closing.
Climate risk First Street
- Flood 1/10 Low FEMA zone X (unshaded) · 0% chance over 30 yrs
- Wildfire 3/10 Moderate
- Heat 4/10 Moderate 7 d/yr ≥108°F today · 16 d/yr by 30 yrs out
- Wind 2/10 Low
- Air quality 4/10 Moderate 5 unhealthy d/yr today · 5 by 30 yrs out
Nearby sold comps map
Loading sold comps map…
Walkable amenities ~0.75 mi
Loading nearby amenities…
Taxation est. · year 1
- Rental income
- $65,280
- − Mortgage interest
- −$28,008
- − Property taxes
- −$6,764
- − Insurance
- −$2,500
- − Repairs & maintenance
- −$5,222
- − Management
- −$5,222
- − HOA
- −$3,924
- − Depreciation
- −$14,545
- Taxable loss
- −$906
- Est. tax savings @ 24.0%
- +$218
- After-tax cash flow
- $7,136/yr
For passive investors: Depreciation is non-cash, so a rental often shows a tax loss while cash-flowing — sheltering income. Rental losses are passive: they offset passive income freely, and up to $25,000/yr can offset ordinary (W-2) income if you actively participate and your MAGI is under $100k (phasing out to $0 by $150k); unused losses carry forward. On sale, claimed depreciation is recaptured at up to 25%, and gains may owe capital-gains tax (a 1031 exchange can defer both). Figures are a year-1 estimate at your 24.0% rate — not tax advice; consult a CPA.
Schools (NCES district)
- District
- Blue Springs R-IV
- NCES district ID
- 2905310
- Math proficiency
- 55% ▼ -10.00%
- Reading proficiency
- 60% ▼ -6.00%
- Median HH income
- $67,959
- Composite
- 50.71/100
- National rank
- #1819
- State rank
- #17 of 324 in MO
Livability — Blue Springs
- Score
- 82/100
- State rank
- #11
- US rank
- #1297
Category grades
Schools grade is shown separately in the Schools card above.
Census & demographics
- Census place
- Blue Springs, MO
- County
- Jackson County · 687,798 people
- City population
- 61,033
- Metro
- Kansas City, MO-KS
- Population (ZIP)
- 28,788
- Household income
- $90,337
- Rent vs Own
- Severe rent burden
- 888.0
Population outlook (Jackson County) Hauer SSP2
- Today (2025)
- 719,589 people
- By 2030
- 731,456 · +1.6%
- By 2040
- 746,689 · +3.8%
- By 2050
- 749,289 · +4.1%
- By 2075
- 736,227 · +2.3%
- By 2100
- 668,210 · -7.1%
Race, ethnicity, and origin ACS 2023
- Neighborhood character
- Predominantly White (76%)
- Race & ethnicity
- White 76% Hispanic / Latino 10% Two or more races 8% Black 8% Asian 1%
- Hispanic origin (detail)
- Mexican 7%
- Common ancestry
- Italian 10% Romanian 2% Lithuanian 2%
- Foreign-born
- 3% · Canada, South Korea
- Languages at home
- 94% English-only · Spanish 5%
Political lean MEDSL · Jackson
- 2024 margin
- D (+19.3) · D 58.9% · R 39.5% · Other 1.6%
- 2008→2024 swing
- -6.1pp toward R · 2008: 25.4pp · 2024: 19.3pp
- All cycles
- 2024: D+19.3 2020: D+22.0 2016: D+16.6 2012: D+19.0 2008: D+25.4
Not yet ingested
- Civics
- —
Market trends
- HPI YoY
- ▼ -187.52%
- Current HPI
- 236.8685
- Rent YoY
- ▲ 5.12%
- Metro
- Kansas City, MO-KS
- State GDP YoY
- ▲ 1.84%
- F500 in state
- 20
Industry mix (Fortune 500 HQ in MO)
| Industry | F500 HQs | Revenue |
|---|---|---|
| Healthcare | 1 | $163B |
|
||
| Insurance | 1 | $21B |
|
||
| Industrial Technology | 1 | $17B |
|
||
| Retail | 1 | $16B |
|
||
| Industrial Distribution | 1 | $10B |
|
||
| Utilities | 1 | $9B |
|
||
Price history
+41601.4% since first listed9 events — show timeline
- 2026-05-06 Price Changed $500,000 Heartland MLS as Distributed by MLS Grid
- 2025-12-05 Listed $549,900 Heartland MLS as Distributed by MLS Grid
- 2025-11-23 Listing Removed — Heartland MLS as Distributed by MLS Grid
- 2025-09-26 Price Changed $549,900 Heartland MLS as Distributed by MLS Grid
- 2025-05-23 Listed $600,000 Heartland MLS as Distributed by MLS Grid
- 2025-03-11 Listing Removed — Heartland MLS as Distributed by MLS Grid
- 2024-09-11 Listed $600,000 Heartland MLS as Distributed by MLS Grid
- 2022-04-16 Price Changed $1,199 RENT.
- 2007-08-20 Sold (Public Records) — Public Records
Property tax history
+6.2%/yrLatest (2025): $6,764 · +15.4% YoY. Source: county tax records.
Cash-flow waterfall
monthlySold comps — $/sqft
last 12 mo · ≤1 miLoading sold comps…