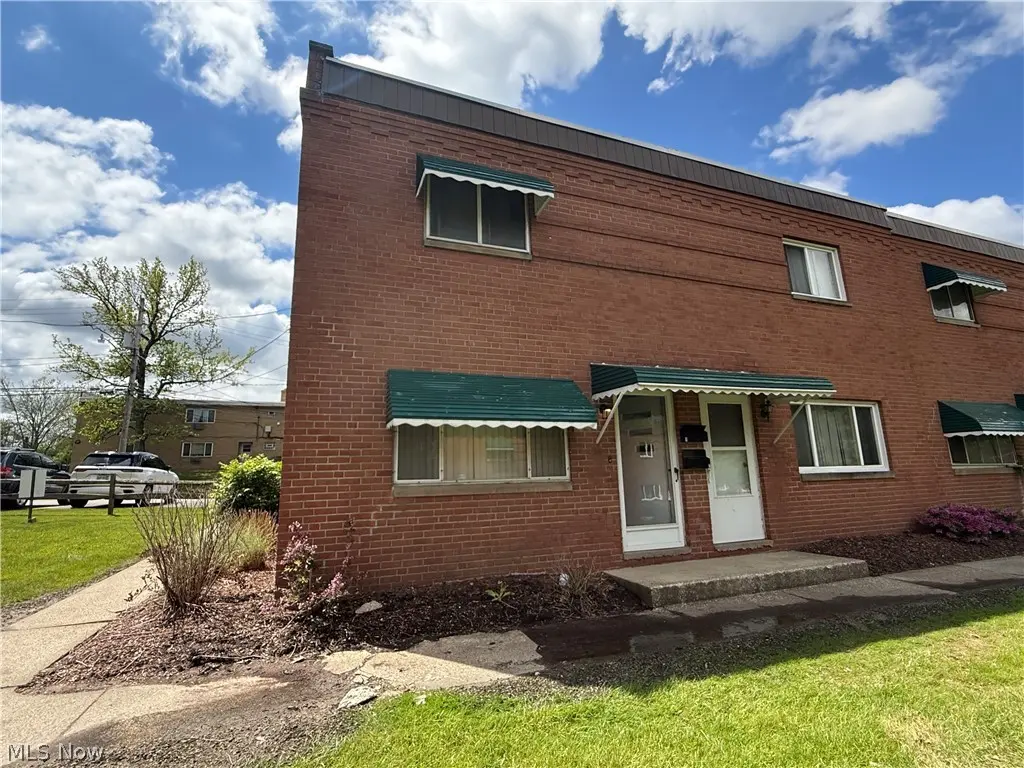
215 Dalepark Dr #1 · Bedford, OH
Flood risk No data
- FEMA flood zone
- —
- Chance of flooding over 30 yrs
- —
- Est. flood insurance / yr
- —
Fire risk No data
- Est. fire insurance / yr
- —
Heat risk No data
- Hot days now (above threshold)
- —
- Hot days in 30 yrs
- —
Wind risk No data
- Chance of severe wind over 30 yrs
- —
Air-quality risk No data
- Unhealthy air days now
- —
- Unhealthy air days in 30 yrs
- —
Risk factors via First Street. Map © Google.
Why this score? — see what drove the B- grade
The composite is a weighted blend of 9 inputs, each scored 0–100. Each bar is that input's sub-score; the figure is the points it added to the 100-point composite (weight × sub-score).
- Cash flow +27.4/30.0
- 1% rule +10.0/10.0
- DSCR +9.6/10.0
- ARV discount +7.5/15.0
- Rent growth +4.0/5.0
- Livability +3.7/5.0
- Condition / age +2.5/5.0
- Schools +2.2/10.0
- Appreciation +0.0/10.0
$75,000
🖨 Deal sheet 📄 Offer letter ✓ Due diligence
Listing remarks
Great investment opportunity in the heart of Bedford! This updated 2-bedroom, 1-bath townhome is tenant-occupied and generating $1,100 per month (MTM) with room for increase to market rent, or sec 8 payment standard of $1,400. Offering immediate cash flow and flexibility for investors or future owner occupants. Located in a desirable area close to shopping, dining, parks, and highway access, this well-maintained property features updated finishes and a functional layout designed for comfortable living. Whether you’re looking to expand your portfolio or secure a low-maintenance rental property, this townhome presents a solid opportunity with strong rental appeal.
Key facts
- Immediate cash flow
- Tenant occupied
- Close to shopping
Tags
Property features AI
Finance
- HOA & community: Homeowners association (Bedford Dales) with a monthly fee of $230 covering structure maintenance
Exterior
- Parking: Parking lot
- Utilities: Public water; Public sewer
- Home design: 2-story building; Entry level is 1st floor
- Construction: Brick construction; Flat roof; Built according to public records
- Exterior features: Parking lot
Interior
- Bathrooms: 1 full bathroom (main level)
- Heating & cooling: Central air conditioning; Forced air heating
- Interior features: Total of 4 rooms
- Laundry & utility: In-unit laundry
Neighborhood map
What this means for you Summary
Snapshot
- This is a 2-bed/1.0-bath condo listed at $75k.
Deal economics
- At list price, monthly cash flow is $218 ($3k/yr) — positive.
- The deal already cash-flows at list — no discount required.
- Meets the 1% rule at list price ($1k rent vs $75k).
- Recommended offer: $74k (1.5% below list) — sets the bar for market timing.
- Cap rate 9.8% vs local median 5.4% in Bedford — top-decile yield for the area; either an underpriced asset or a hidden risk that comps aren't pricing in. Stress-test before assuming the spread holds.
Location & tenants
- Location reads 73/100 on livability (#324 in OH) — a middle-class / working-renter tenant base. Strengths: crime A+, cost of living A+, housing A+; Watch: amenities F, commute F, employment D-.
- Bedford City (suburban): math 19% / reading 32% proficiency, ranked #597 of 656 in OH (top 91%) — low school quality limits family demand, transient renter base, plan for 1-2y turnover.
- Market conditions: Rents rising fast (+5.8%/yr); 105 active listings in the ZIP; 8 comparable units currently listed for rent nearby; rentals leasing fast (median 8d on market — plan ~1-2 weeks tenant-placement turnaround); 1,441 units permitted in Cuyahoga County in 2024 (700 in 5+ unit buildings).
Forward outlook
- Local home prices are declining (-3.0%/yr); year-one equity from $519 of loan paydown is wiped out by about $2k of value loss. Plan a longer hold.
- Cuyahoga County population projected to shrink 8% by 2050 — rents likely to lag national; underwrite the cash flow, not the appreciation.
- At projected returns (-3.0% appreciation + 5.8% rent growth), your $21k cash investment doubles in ~7 years — after that, you're playing with house money.
Negotiation context
- It's been on market 28 days — a 2% lower offer ($74k) is reasonable based on typical stale-listing flexibility.
- 2 sale attempts since 2y ago with the ask held roughly flat each time — persistent listings suggest the price (not the market) is what's stuck; bring a comps-based counter.
- Current owner paid $34k; list at $75k implies a 121% gain — meaningful room to come down on a strong offer.
Risks & watch-outs
- Watch-outs: built in 1957 — expect roof / HVAC / electrical / plumbing capex.
Questions for the listing agent
- Built in 1957 — when were the roof, HVAC, electrical panel, plumbing, and water heater last replaced?
- What does the HOA fee cover, when was the last increase, and are there any pending special assessments or reserve-fund shortfalls?
- Any open or pending special assessments — roof, HVAC, plumbing, elevator, façade? What's the per-unit balance and payoff schedule, and is the seller paying it off at close or rolling it to the buyer?
- Is there a deadline driving the sale (1031 exchange, divorce, estate, relocation)? That informs how much negotiation room exists.
- What's the average days-on-market for RENTAL listings here right now (not sales)? A rising rental-DOM trend means longer vacancies and softer asking-rent achievability than the comps imply.
- What's the recent tenant-quality profile in this submarket — average credit score on applications, eviction rate, late-payment / NSF rate, and stable-employment percentage? A property-management company in the area should have these aggregated.
- How much new apartment / multifamily construction is in the pipeline within 1–3 miles? Heavy new supply (>2% of stock underway) typically softens rents 12–24 months out; light construction supports rent growth.
Investment metrics
- 1% rule
- 1.64% ✓
- Cap rate
- 9.79%
- Cash-on-cash
- 12.48%
- DSCR
- 1.56
- GRM
- 5.1
CMA / ARV
No comps found within radius.
Projected returns pro-forma
-3.0% appreciation · 5.83% rent growth · sell at horizon
- IRR
- 6.4%
- Equity multiple
- 1.26×
- Total profit
- $5,509
- Equity at exit
- $11,183
- IRR
- 18.9%
- Equity multiple
- 2.86×
- Total profit
- $38,991
- Equity at exit
- $6,485
Cash invested: $21,000 (down + closing). Projections, not guarantees.
Landlord ↔ Tenant lean methodology
- Overall (STATE)
- 73 Landlord-Friendly
- State Ohio
- 73 Landlord-Friendly · R+6
- County
- — inherits STATE
- City
- — inherits STATE
ZIP-level market 44146
- Rents YoY
- 5.8%
- Active inventory
- 105
- Price-to-rent
- 5.1×
Monthly cashflow live
- Estimated rent
- $1,227 high interval (Pro) →
- Mortgage (P&I)
- −$393
- Tax from tax record
- −$97 /mo · $1,162/yr
- Insurance
- −$31
- HOA
- −$230
- Vacancy / Maint / Mgmt
- −$258
- Net cashflow
- $218
Break-even live
UW: 25.0% down · 7.5% · 30yr · 1.5% tax · 5.0% vac · 8.0% maint · 8.0% mgmt
Financing live
Cash to close
- Down payment
- $18,750
- Closing costs
- $2,250
- Reserves months
- —
- Total cash needed
- —
Loan-product check · same deal, 3 products live
Conventional
25% down · 7.5% · 30yr
- Down + closing
- —
- Monthly P&I
- —
- Monthly cashflow
- —
- DSCR
- —
- Eligible?
- —
Personal DTI + credit; lowest rate.
DSCR
20% down · 8.5% · 30yr
- Down + closing
- —
- Monthly P&I
- —
- Monthly cashflow
- —
- DSCR
- —
- Eligible?
- —
No personal income docs; deal must DSCR.
Hard money
10% down · 12.0% · 12mo
- Down + closing
- —
- Monthly P&I
- —
- Monthly cashflow
- —
- DSCR
- —
- Eligible?
- —
Short-term bridge; refi at stabilization.
Rent comps 8 comps
| Address | Beds | Baths | Sqft | Rent | $/sqft | DOM | Units | Dist |
|---|---|---|---|---|---|---|---|---|
| 199 Dalepark Dr Bedford, OH | 2.0 | 1.0 | 896 | $1,300 | $1.45 | 43d | 1 | 0.01mi |
| 215 Dalepark Dr #4 Bedford, OH | 2.0 | 1.0 | 896 | $1,400 | $1.56 | 17d | 1 | 0.03mi |
| 200 Solon Rd Unit 3 Bedford, OH | 2.0 | 1.0 | 850 | $1,100 | $1.29 | 4d | 1 | 0.49mi |
| 204 Solon Rd Bedford, OH | 2.0 | 1.0 | 900 | $1,200 | $1.33 | 3d | 1 | 0.50mi |
| 204 Solon Rd Apt 2 Bedford, OH | 2.0 | 1.0 | 900 | $1,200 | $1.33 | 4d | 1 | 0.50mi |
| 39 Woodrow Ave Unit FRONT Bedford, OH | 1.0 | 1.0 | 600 | $750 | $1.25 | 7d | 1 | 0.74mi |
| 14 Ennis Ave Bedford, OH | 3.0 | 2.0 | 1064 | $1,495 | $1.41 | 43d | 1 | 1.14mi |
| 6055 Bear Creek Dr Bedford Heights, OH | 1.0–2.0 | 1.0–1.5 | 815 | $1,081 | $1.33 | 2d | 30 | 1.33mi |
HOA detail condo
- Monthly dues
- $230 · $2,760/yr
- Assessments
- None detected in remarks — confirm with the listing agent.
Listing history 19 events
-
2026-06-18days on market $75,000 Active 28 DOM
-
2026-06-17days on market $75,000 Active 27 DOM
-
2026-06-16days on market $75,000 Active 26 DOM
-
2026-06-15days on market $75,000 Active 25 DOM
-
2026-06-13days on market $75,000 Active 23 DOM
-
2026-06-09days on market $75,000 Active 19 DOM
-
2026-06-08days on market $75,000 Active 18 DOM
-
2026-06-07days on market $75,000 Active 17 DOM
-
2026-06-05days on market $75,000 Active 14 DOM
-
2026-06-03days on market $75,000 Active 13 DOM
-
2026-06-02days on market $75,000 Active 12 DOM
-
2026-06-01days on market $75,000 Active 11 DOM
-
2026-05-31days on market $75,000 Active 10 DOM
-
2026-05-21$75,000 Active
-
2024-04-29price $67,500
-
2024-04-12price $70,000
-
2024-03-31$75,000 Active
-
1996-06-25soldstatus $34,000
-
1975-04-01soldstatus $17,500
ⓘ Source: listings_history table (triggers on properties + properties_extension) + one-shot
backfill from property_details.listing_events for pre-trigger history.
Tax reassessment forecast OH · Partial reset (capped growth)
- Current annual tax
- $1,162 · $97/mo
- Projected year-2 tax
- $1,166 · $97/mo
- Expected delta
- +$4/yr ($0/mo · 0.4%)
ⓘ Screening estimate from a state-policy table — verify with the county assessor before closing.
Nearby sold comps map
Loading sold comps map…
Walkable amenities ~0.75 mi
Loading nearby amenities…
Taxation est. · year 1
- Rental income
- $14,730
- − Mortgage interest
- −$4,201
- − Property taxes
- −$1,162
- − Insurance
- −$375
- − Repairs & maintenance
- −$1,178
- − Management
- −$1,178
- − HOA
- −$2,760
- − Depreciation
- −$2,182
- Taxable income
- $1,693
- Est. tax owed @ 24.0%
- −$406
- After-tax cash flow
- $2,214/yr
For passive investors: Depreciation is non-cash, so a rental often shows a tax loss while cash-flowing — sheltering income. Rental losses are passive: they offset passive income freely, and up to $25,000/yr can offset ordinary (W-2) income if you actively participate and your MAGI is under $100k (phasing out to $0 by $150k); unused losses carry forward. On sale, claimed depreciation is recaptured at up to 25%, and gains may owe capital-gains tax (a 1031 exchange can defer both). Figures are a year-1 estimate at your 24.0% rate — not tax advice; consult a CPA.
Schools (NCES district)
- District
- Bedford City
- NCES district ID
- 3910017
- Math proficiency
- 19% ▼ -23.00%
- Reading proficiency
- 32% ▼ -16.00%
- Median HH income
- $42,353
- Composite
- 21.69/100
- National rank
- #8273
- State rank
- #597 of 656 in OH
Livability — Bedford
- Score
- 73/100
- State rank
- #324
- US rank
- #5334
Category grades
Schools grade is shown separately in the Schools card above.
Census & demographics
- Census place
- Bedford, OH
- County
- Cuyahoga County · 1,090,369 people
- City population
- 29,349
- Metro
- Cleveland-Elyria, OH
- Population (ZIP)
- 29,349
- Household income
- $54,925
- Rent vs Own
- Severe rent burden
- 1314.0
Population outlook (Cuyahoga County) Hauer SSP2
- Today (2025)
- 1,244,621 people
- By 2030
- 1,230,093 · -1.2%
- By 2040
- 1,189,108 · -4.5%
- By 2050
- 1,145,706 · -7.9%
- By 2075
- 1,076,557 · -13.5%
- By 2100
- 978,987 · -21.3%
Race, ethnicity, and origin ACS 2023
- Neighborhood character
- Majority Black (59%)
- Race & ethnicity
- Black 59% White 33% Two or more races 6% Hispanic / Latino 3%
- Common ancestry
- Romanian 5% Serbian 1% Armenian 1%
- Foreign-born
- 2% · Canada
- Languages at home
- 96% English-only · Spanish 2% Arabic 1%
Political lean MEDSL · Cuyahoga
- 2024 margin
- Solid D (+31.5) · D 65.4% · R 33.9%
- 2008→2024 swing
- -7.4pp toward R · 2008: 38.9pp · 2024: 31.5pp
- All cycles
- 2024: D+31.5 2020: D+34.1 2016: D+35.0 2012: D+38.7 2008: D+38.9
Not yet ingested
- Civics
- —
Market trends
- HPI YoY
- ▼ -114.08%
- Current HPI
- 172.9421
- Rent YoY
- ▲ 5.83%
- Metro
- Cleveland-Elyria, OH
- State GDP YoY
- ▲ 1.98%
- F500 in state
- 48
Industry mix (Fortune 500 HQ in OH)
| Industry | F500 HQs | Revenue |
|---|---|---|
| Insurance | 3 | $145B |
|
||
| Industrial Machinery | 3 | $49B |
|
||
| Financial Services | 3 | $24B |
|
||
| Consumer Goods | 2 | $93B |
|
||
| Aerospace / Defense | 2 | $47B |
|
||
| Utilities | 2 | $33B |
|
||
Price history
+328.6% since first listed6 events — show timeline
- 2026-05-21 Listed $75,000 MLSNOW
- 2024-04-29 Price Changed $67,500 MLSNOW
- 2024-04-12 Price Changed $70,000 MLSNOW
- 2024-03-31 Listed $75,000 MLSNOW
- 1996-06-25 Sold (Public Records) $34,000 Public Records
- 1975-04-01 Sold (Public Records) $17,500 Public Records
Property tax history
+25.6%/yrLatest (2025): $1,162 · +4.5% YoY. Source: county tax records.
Cash-flow waterfall
monthlySold comps — $/sqft
last 12 mo · ≤1 miLoading sold comps…