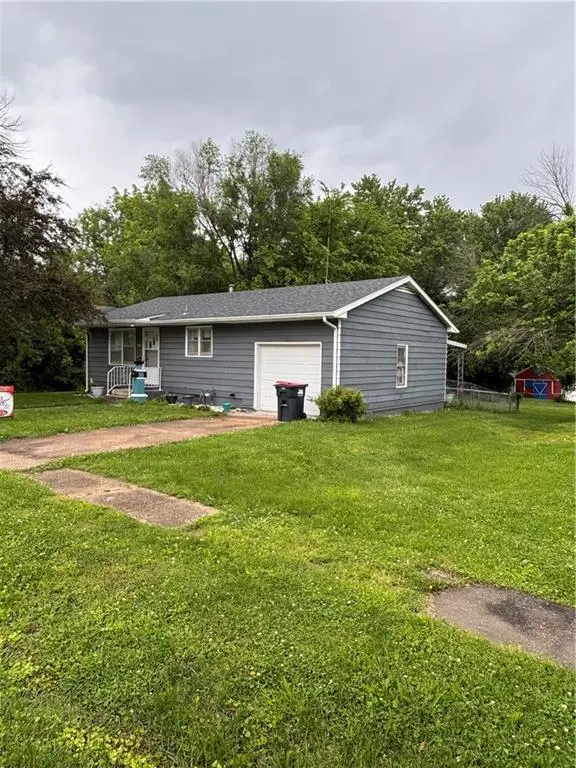
404 E Colorado St · Windsor, MO
Flood risk 1/10 · Minimal
- FEMA flood zone
- X (unshaded)
- Chance of flooding over 30 yrs
- 0.0%
- Est. flood insurance / yr
- $507 – $1,088
Fire risk 4/10 · Minor
- Est. fire insurance / yr
- $1,054 – $1,958
Heat risk 4/10 · Minor
- Hot days now (above 106°F)
- 7 days/yr
- Hot days in 30 yrs
- 18 days/yr
Wind risk 2/10 · Minimal
- Chance of severe wind over 30 yrs
- —
Air-quality risk 2/10 · Minimal
- Unhealthy air days now
- 0 days/yr
- Unhealthy air days in 30 yrs
- 1 days/yr
Risk factors via First Street. Map © Google.
Why this score? — see what drove the D+ grade
The composite is a weighted blend of 9 inputs, each scored 0–100. Each bar is that input's sub-score; the figure is the points it added to the 100-point composite (weight × sub-score).
- ARV discount +14.1/15.0
- Appreciation +10.0/10.0
- Cash flow +9.9/30.0
- Livability +3.2/5.0
- DSCR +2.8/10.0
- Schools +2.6/10.0
- Rent growth +2.5/5.0
- Condition / age +2.5/5.0
- 1% rule +2.1/10.0
$99,000
🖨 Deal sheet (PDF) 📄 Offer letter ✓ Due diligence
Listing remarks MLS
Calling all investors and 1st time homeowners! This well kept and manageable 2 bed 1 bath house is in good condition and ready for a new owner! Move in ready houses in this price range don't come around often. Enjoy small town living in the centrally located Windsor Missouri, Just A 20 minute drive to Whiteman Air Force base! Home previously rented out for $600 a month. Call to set up a showing today!
Key facts
- Unfinished basement
- New water heater
- Outdoor space
Tags
Property features AI
Finance
- Other: Inside city limits
- HOA & community: No HOA fees
Exterior
- Parking: Attached 1-car garage
- Utilities: Public water; Public sewer
- Home design: Attached single-family residence; Ranch style; Living area approximately 870 (above grade)
- Construction: Frame construction; Composition roof; Full unfinished concrete basement
- Exterior features: Patio; City lot; Paved road with public maintenance
Interior
- Kitchen: Linoleum in kitchen
- Bedrooms: 2 bedrooms (both on the first floor)
- Flooring: Wood flooring
- Bathrooms: 1 full bathroom (first floor)
- Heating & cooling: Forced air heating; Electric cooling
- Interior features: Eat-in kitchen; Ranch floor plan
- Laundry & utility: Dryer hookup (electric) in basement
Neighborhood map
What this means for you Summary
Snapshot
- This is a 2-bed/1.0-bath other listed at $99k.
Deal economics
- At list price, monthly cash flow is $-62 ($-746/yr) — negative.
- To cash-flow at today's rent, offer at most $88k (11.1% below list).
- To meet the 1% rule (rent ≥ 1% of price), the offer needs to be $70k (29.3% below list).
- Recommended offer: $70k (29.3% below list) — sets the bar for 1% rule.
- Cap rate 5.5% vs local median 4.4% in Windsor — meaningfully above typical; check what's discounted (condition, days-on-market, listing class) to confirm the premium yield is real.
Location & tenants
- Location reads 65/100 on livability (#288 in MO) — a middle-class / working-renter tenant base. Strengths: cost of living A+, housing A+, crime B+; Watch: employment D+, amenities F, commute F.
- Henry County R-I (town): math 27% / reading 34% proficiency, ranked #270 of 324 in MO (top 83%) — families likely to look elsewhere, expect single-tenant / working-renter base with shorter leases.
- Zoned schools: Windsor Elem. (math 27% / reading 32%, grade F, #813 of 1,115 statewide, top 75%, 377 students, 58% FRL); Windsor High (math 27% / reading 37%, grade F, #356 of 521 statewide, top 71%, 326 students, 48% FRL).
- Market conditions: 46 active listings in the ZIP; 1 comparable units currently listed for rent nearby; 15 units permitted in Henry County in 2024 (0 in 5+ unit buildings).
Forward outlook
- In year one you build about $11k of equity ($684 loan paydown + $10k appreciation (10.0% local appreciation)).
- Henry County population projected at -18% by 2050 — secular population decline; favor cash flow + early exit over multi-decade hold.
- At projected returns (10.0% appreciation + 3.0% rent growth), your $28k cash investment doubles in ~3 years — after that, you're playing with house money.
- By year 4, paydown + projected appreciation supports a ~$38k cash-out refi (75% LTV) — recoverable capital for the next deal without selling this one.
Negotiation context
- It's been on market 24 days — a 2% lower offer ($98k) is reasonable based on typical stale-listing flexibility.
- 6 sale attempts since 11y ago; this cycle's ask has dropped $11k (10%) from the opening price — seller is motivated, your offer sets the floor, not the list.
- Current owner paid $26k; list at $99k implies a 281% gain — meaningful room to come down on a strong offer.
Risks & watch-outs
- Watch-outs: built in 1958 — expect roof / HVAC / electrical / plumbing capex.
Questions for the listing agent
- What do current leases actually rent for vs. the listed asking? Can we see a recent rent roll and the last 12 months of T-12 income?
- Built in 1958 — when were the roof, HVAC, electrical panel, plumbing, and water heater last replaced?
- Is there a deadline driving the sale (1031 exchange, divorce, estate, relocation)? That informs how much negotiation room exists.
- Schools are F-rated, which usually means shorter tenancies and higher turnover. Who's the typical renter profile here, and what's been the actual vacancy rate?
- The area grade is low — what's the realistic commute time and amenity access for the typical tenant pool here? Any planned neighborhood developments (good or bad) we should know about?
- What's the average days-on-market for RENTAL listings here right now (not sales)? A rising rental-DOM trend means longer vacancies and softer asking-rent achievability than the comps imply.
- What's the recent tenant-quality profile in this submarket — average credit score on applications, eviction rate, late-payment / NSF rate, and stable-employment percentage? A property-management company in the area should have these aggregated.
- How much new for-sale + rental construction is in the pipeline within 1–3 miles? Heavy new supply typically softens prices + rents 12–24 months out; constrained supply supports both.
Investment metrics
- 1% rule
- 0.71% ✗
- Cap rate
- 5.54%
- Cash-on-cash
- -2.69%
- DSCR
- 0.88
- GRM
- 11.8
CMA / ARV
- ARV (median comp)
- $116,125
- List price
- $99,000
- Delta
- -14.75%
- Verdict
- UNDERPRICED
- Comps
- 20 within 1.0 mi
Projected returns pro-forma
10.0% appreciation · 3.0% rent growth · sell at horizon
- IRR
- 22.3%
- Equity multiple
- 2.80×
- Total profit
- $49,925
- Equity at exit
- $89,187
- IRR
- 20.0%
- Equity multiple
- 6.41×
- Total profit
- $150,072
- Equity at exit
- $192,335
Cash invested: $27,720 (down + closing). Projections, not guarantees.
Landlord ↔ Tenant lean methodology
- Overall (STATE)
- 81 Strongly Landlord-Friendly
- State Missouri
- 81 Strongly Landlord-Friendly · R+10
- County
- — inherits STATE
- City
- — inherits STATE
ZIP-level market 65360
- Home prices YoY
- 9.7%
- Active inventory
- 46
- Price-to-rent
- 11.8×
Monthly cashflow live
- Estimated rent
- $700 medium interval (Pro) →
- Mortgage (P&I)
- −$519
- Tax from tax record
- −$55 /mo · $657/yr
- Insurance
- −$41
- HOA
- −$0
- Vacancy / Maint / Mgmt
- −$147
- Net cashflow
- $-62
Break-even live
Sensitivity live
| Price | -10% $-6 | -5% $-34 | +0% $-62 | +5% $-90 | +10% $-118 |
|---|---|---|---|---|---|
| Rent | -10% $-117 | -5% $-90 | +0% $-62 | +5% $-35 | +10% $-7 |
| Rate | -1.0pp $-12 | -0.5pp $-37 | base $-62 | +0.5pp $-88 | +1.0pp $-114 |
UW: 25.0% down · 7.5% · 30yr · 1.5% tax · 5.0% vac · 8.0% maint · 8.0% mgmt
Financing live
Cash to close
- Down payment
- $24,750
- Closing costs
- $2,970
- Reserves months
- —
- Total cash needed
- —
Loan-product check · same deal, 3 products live
Conventional
25% down · 7.5% · 30yr
- Down + closing
- —
- Monthly P&I
- —
- Monthly cashflow
- —
- DSCR
- —
- Eligible?
- —
Personal DTI + credit; lowest rate.
DSCR
20% down · 8.5% · 30yr
- Down + closing
- —
- Monthly P&I
- —
- Monthly cashflow
- —
- DSCR
- —
- Eligible?
- —
No personal income docs; deal must DSCR.
Hard money
10% down · 12.0% · 12mo
- Down + closing
- —
- Monthly P&I
- —
- Monthly cashflow
- —
- DSCR
- —
- Eligible?
- —
Short-term bridge; refi at stabilization.
Rent comps 1 comps
| Address | Beds | Baths | Sqft | Rent | $/sqft | DOM | Units | Dist |
|---|---|---|---|---|---|---|---|---|
| 301 E Benton St Unit B Windsor, MO | 2.0 | 1.0 | 800 | $700 | $0.88 | 45d | 1 | 0.19mi |
Listing history 18 events
-
2026-06-01statusdays on market $99,000 Pending 24 DOM
-
2026-05-31days on market $99,000 Active 23 DOM
-
2026-05-30days on market $99,000 Active 22 DOM
-
2026-05-08price $110,000
-
2026-05-08$110,000 Active 556-char remark
-
2025-07-06historical
-
2025-06-24price $123,000
-
2025-06-23status Active
-
2025-06-04status Pending
-
2025-05-24price $130,000
-
2025-05-16$135,000 Active
-
2021-07-27soldstatus
Show marketing remark (404 chars)
Calling all investors and 1st time homeowners! This well kept and manageable 2 bed 1 bath house is in good condition and ready for a new owner! Move in ready houses in this price range don't come around often. Enjoy small town living in the centrally located Windsor Missouri, Just A 20 minute drive to Whiteman Air Force base! Home previously rented out for $600 a month. Call to set up a showing today!
-
2021-06-13$59,900
Show marketing remark (404 chars)
Calling all investors and 1st time homeowners! This well kept and manageable 2 bed 1 bath house is in good condition and ready for a new owner! Move in ready houses in this price range don't come around often. Enjoy small town living in the centrally located Windsor Missouri, Just A 20 minute drive to Whiteman Air Force base! Home previously rented out for $600 a month. Call to set up a showing today!
-
2017-02-03soldstatus
-
2016-09-19$55,900
-
2015-11-12soldstatus
-
2015-06-18$38,000
-
1987-10-01soldstatus $26,000
ⓘ Source: listings_history table (triggers on properties + properties_extension) + one-shot
backfill from property_details.listing_events for pre-trigger history.
Tax reassessment forecast MO · Resets to sale price
- Current annual tax
- $657 · $55/mo
- Projected year-2 tax
- $960 · $80/mo
- Expected delta
- +$303/yr (+$25/mo · 46.1%)
ⓘ Screening estimate from a state-policy table — verify with the county assessor before closing.
Climate risk First Street
- Flood 1/10 Low FEMA zone X (unshaded) · 0% chance over 30 yrs
- Wildfire 4/10 Moderate
- Heat 4/10 Moderate 7 d/yr ≥106°F today · 18 d/yr by 30 yrs out
- Wind 2/10 Low
- Air quality 2/10 Low 0 unhealthy d/yr today · 1 by 30 yrs out
Nearby sold comps map
Loading sold comps map…
Walkable amenities ~0.75 mi
Loading nearby amenities…
Taxation est. · year 1
- Rental income
- $8,400
- − Mortgage interest
- −$5,546
- − Property taxes
- −$657
- − Insurance
- −$495
- − Repairs & maintenance
- −$672
- − Management
- −$672
- − Depreciation
- −$2,880
- Taxable loss
- −$2,522
- Est. tax savings @ 24.0%
- +$605
- After-tax cash flow
- $-141/yr
For passive investors: Depreciation is non-cash, so a rental often shows a tax loss while cash-flowing — sheltering income. Rental losses are passive: they offset passive income freely, and up to $25,000/yr can offset ordinary (W-2) income if you actively participate and your MAGI is under $100k (phasing out to $0 by $150k); unused losses carry forward. On sale, claimed depreciation is recaptured at up to 25%, and gains may owe capital-gains tax (a 1031 exchange can defer both). Figures are a year-1 estimate at your 24.0% rate — not tax advice; consult a CPA.
Schools (NCES district)
- District
- Henry County R-I
- NCES district ID
- 2932110
- Math proficiency
- 27% ▲ 3.00%
- Reading proficiency
- 34% ▲ 2.00%
- Median HH income
- $38,839
- Composite
- 25.53/100
- National rank
- #7434
- State rank
- #270 of 324 in MO
Livability — Windsor
- Score
- 65/100
- State rank
- #288
- US rank
- #13335
Category grades
Schools grade is shown separately in the Schools card above.
Census & demographics
- Census place
- Windsor, MO
- City population
- 4,526
- Population (ZIP)
- 4,526
Population outlook (Henry County) Hauer SSP2
- Today (2025)
- 20,584 people
- By 2030
- 19,839 · -3.6%
- By 2040
- 18,305 · -11.1%
- By 2050
- 16,893 · -17.9%
- By 2075
- 14,285 · -30.6%
- By 2100
- 11,905 · -42.2%
Race, ethnicity, and origin ACS 2023
- Neighborhood character
- Predominantly White (89%)
- Race & ethnicity
- White 89% Two or more races 7% Hispanic / Latino 6%
- Hispanic origin (detail)
- Mexican 2%
- Common ancestry
- Lithuanian 3% Slovak 1% Italian 1%
- Foreign-born
- 1% · Canada
- Languages at home
- 91% English-only · German/W. Germanic 4% Spanish 4%
Political lean MEDSL · Henry
- 2024 margin
- Solid R (+52.6) · D 23.2% · R 75.8% · Other 1.0%
- 2008→2024 swing
- -41.6pp toward R · 2008: -11.0pp · 2024: -52.6pp
- All cycles
- 2024: R+52.6 2020: R+50.1 2016: R+47.9 2012: R+25.9 2008: R+11.0
Not yet ingested
- Civics
- —
Market trends
- HPI YoY
- ▲ 24.82%
- Current HPI
- 279.7789
- Rent YoY
- —
- Metro
- —
- State GDP YoY
- ▲ 1.84%
- F500 in state
- 20
Industry mix (Fortune 500 HQ in MO)
| Industry | F500 HQs | Revenue |
|---|---|---|
| Healthcare | 1 | $163B |
|
||
| Insurance | 1 | $21B |
|
||
| Industrial Technology | 1 | $17B |
|
||
| Retail | 1 | $16B |
|
||
| Industrial Distribution | 1 | $10B |
|
||
| Utilities | 1 | $9B |
|
||
Price history
+280.8% since first listed17 events — show timeline
- 2026-06-01 Pending — Heartland MLS as Distributed by MLS Grid
- 2026-05-21 Price Changed $99,000 Heartland MLS as Distributed by MLS Grid
- 2026-05-08 Price Changed $110,000 Heartland MLS as Distributed by MLS Grid
- 2026-05-08 Listed $110,000 Heartland MLS as Distributed by MLS Grid
- 2025-07-06 Listing Removed — Heartland MLS as Distributed by MLS Grid
- 2025-06-24 Price Changed $123,000 Heartland MLS as Distributed by MLS Grid
- 2025-06-23 Relisted — Heartland MLS as Distributed by MLS Grid
- 2025-06-04 Pending — Heartland MLS as Distributed by MLS Grid
- 2025-05-24 Price Changed $130,000 Heartland MLS as Distributed by MLS Grid
- 2025-05-16 Listed $135,000 Heartland MLS as Distributed by MLS Grid
- 2021-07-27 Sold (MLS) — Heartland MLS as Distributed by MLS Grid
- 2021-06-13 Listed $59,900 Heartland MLS as Distributed by MLS Grid
- 2017-02-03 Sold (MLS) — Heartland MLS as Distributed by MLS Grid
- 2016-09-19 Listed $55,900 Heartland MLS as Distributed by MLS Grid
- 2015-11-12 Sold (MLS) — Heartland MLS as Distributed by MLS Grid
- 2015-06-18 Listed $38,000 Heartland MLS as Distributed by MLS Grid
- 1987-10-01 Sold (Public Records) $26,000 Public Records
Property tax history
+2.8%/yrLatest (2025): $657 · +4.2% YoY. Source: county tax records.
Cash-flow waterfall
monthlySold comps — $/sqft
last 12 mo · ≤1 miLoading sold comps…