 🏗️ New Construction
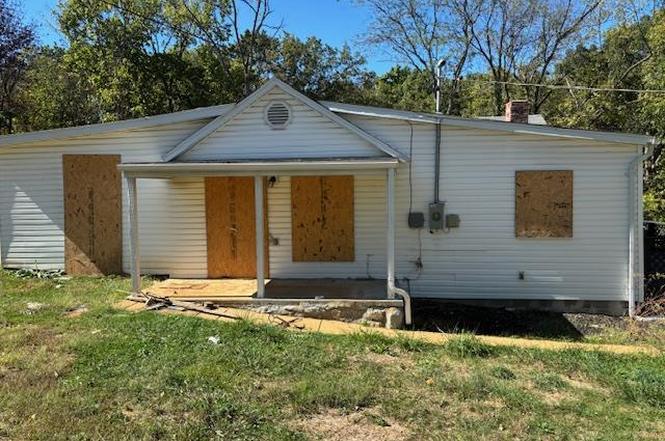
513 W Mineral St · De Soto, MO
Flood risk 1/10 · Minimal
- FEMA flood zone
- X (unshaded)
- Chance of flooding over 30 yrs
- 0.0%
- Est. flood insurance / yr
- $507 – $1,088
Fire risk 4/10 · Minor
- Est. fire insurance / yr
- $1,054 – $1,958
Heat risk 5/10 · Moderate
- Hot days now (above 106°F)
- 7 days/yr
- Hot days in 30 yrs
- 20 days/yr
Wind risk 2/10 · Minimal
- Chance of severe wind over 30 yrs
- 1.0%
Air-quality risk 2/10 · Minimal
- Unhealthy air days now
- 1 days/yr
- Unhealthy air days in 30 yrs
- 1 days/yr
Risk factors via First Street. Map © Google.
Why this score? — see what drove the B- grade
The composite is a weighted blend of 9 inputs, each scored 0–100. Each bar is that input's sub-score; the figure is the points it added to the 100-point composite (weight × sub-score).
- Cash flow +30.0/30.0
- 1% rule +10.0/10.0
- DSCR +10.0/10.0
- ARV discount +7.5/15.0
- Schools +3.4/10.0
- Livability +3.0/5.0
- Rent growth +2.5/5.0
- Condition / age +2.5/5.0
- Appreciation +0.0/10.0
$45,000
🖨 Deal sheet 📄 Offer letter ✓ Due diligence
Listing remarks MLS
HOME PASSED City Occupancy AND is Move-in-Ready! Darling 3 BEDROOMS, 2 BATHROOMS in town on just under Half an Acre and Backs to Woods for Privacy. The kitchen has had some updates to cabinetry having a pantry, dishwasher as well as Newer Windows. Master Bedroom with MASTER BATHROOM or this space could be used as a Home Office / Gaming area with a Guest Bath. MAIN FLOOR LAUNDRY, Second Bathroom, All Spacious Bedrooms and a Large deck for entertaining and Grilling outside just off the kitchen. Large Back Yard and a back patio space to use for more privacy. Plenty of storage space including 2 sheds on the property that stay for the NEW BUYER!
Key facts
- 0.5 acre lot
- Built 1950
- Listed 226 days
Property features AI
Finance
- Other: Living area reported as 1,149 (source: public records); Property listed by Keller Williams Realty St. Louis; seller may consider concessions
- Financial info: Lease not considered; Second mortgage information not indicated
- HOA & community: HOA details not specified
Exterior
- Parking: Parking details not specified
- Security: Security details not specified
- Utilities: Public water; Public sewer; Electric service by Ameren; Electricity available
- Home design: Single-family residence; One-story house; Private ownership; Under construction condition; Entry facing direction not specified
- Construction: Vinyl siding exterior; Architectural shingle roof; Block foundation; Year built not specified
- Exterior features: Paved city street frontage; Approximately 0.496-acre lot; Frontage about 125 feet
Interior
- Kitchen: Kitchen included (appliances not specified)
- Bedrooms: Three bedrooms on the main level
- Flooring: Flooring details not specified
- Bathrooms: Two full bathrooms on the main level
- Heating & cooling: Forced air heating; Central air conditioning
- Interior features: Open main-level living area; Under construction — new build
- Laundry & utility: Laundry/utility details not specified
Neighborhood map
What this means for you Summary
Snapshot
- This is a 3-bed/2.0-bath other listed at $45k.
Deal economics
- At list price, monthly cash flow is $541 ($6k/yr) — positive.
- The deal already cash-flows at list — no discount required.
- Meets the 1% rule at list price ($1k rent vs $45k).
- Recommended offer: $40k (12.0% below list) — sets the bar for market timing.
- Cap rate 20.7% vs local median 3.6% in De Soto — top-decile yield for the area; either an underpriced asset or a hidden risk that comps aren't pricing in. Stress-test before assuming the spread holds.
Location & tenants
- Location reads 59/100 on livability (#523 in MO) — a working-class tenant base; expect higher turnover. Strengths: cost of living A+, housing A+; Watch: crime F, amenities F, commute F.
- Desoto 73 (town): math 36% / reading 43% proficiency, ranked #153 of 324 in MO (top 47%) — families likely to look elsewhere, expect single-tenant / working-renter base with shorter leases.
- Zoned schools: Vineland Elem. (math 40% / reading 44%, grade F, #481 of 1,115 statewide, top 46%, 648 students, 49% FRL); Desoto Sr. High (math 37% / reading 53%, grade D-, #176 of 521 statewide, top 34%, 848 students, 34% FRL) — zoned schools at 42% FRL track the district average.
- Market conditions: 150 active listings in the ZIP; 807 units permitted in Jefferson County in 2024 (104 in 5+ unit buildings).
Forward outlook
- Local home prices are declining (-3.0%/yr); year-one equity from $311 of loan paydown is wiped out by about $1k of value loss. Plan a longer hold.
- At projected returns (-3.0% appreciation + 3.0% rent growth), your $13k cash investment doubles in ~3 years — after that, you're playing with house money.
Negotiation context
- It's been on market 226 days — a 12% lower offer ($40k) is reasonable based on typical stale-listing flexibility.
- 8 sale attempts since 7y ago; this cycle's ask has dropped $15k (25%) from the opening price — seller is motivated, your offer sets the floor, not the list.
Risks & watch-outs
- Watch-outs: property tax is 2.5% of price; built in 1950 — expect roof / HVAC / electrical / plumbing capex.
- Climate carrying-cost: extreme-heat days projected 7→20/yr by 2055 (HVAC capex compounding) — expect insurance premiums to compound above CPI over the hold.
Questions for the listing agent
- It's been on market 226 days. Have you received any prior offers? Is the seller open to a 12% concession, seller financing, or rate buy-down credit?
- Built in 1950 — when were the roof, HVAC, electrical panel, plumbing, and water heater last replaced?
- Property tax is high relative to price — has the assessment been appealed recently, and will the sale trigger a re-assessment?
- Why hasn't it sold? Are there any deal-killer items the seller is aware of (foundation, flood, title, zoning, code violations)?
- Is there a deadline driving the sale (1031 exchange, divorce, estate, relocation)? That informs how much negotiation room exists.
- Schools are D-rated, which usually means shorter tenancies and higher turnover. Who's the typical renter profile here, and what's been the actual vacancy rate?
- Crime grade is F in this area — have there been break-ins, vandalism, or insurance claims at this property in the last 3 years? What carrier currently insures it and at what premium?
- What's the average days-on-market for RENTAL listings here right now (not sales)? A rising rental-DOM trend means longer vacancies and softer asking-rent achievability than the comps imply.
- What's the recent tenant-quality profile in this submarket — average credit score on applications, eviction rate, late-payment / NSF rate, and stable-employment percentage? A property-management company in the area should have these aggregated.
- How much new for-sale + rental construction is in the pipeline within 1–3 miles? Heavy new supply typically softens prices + rents 12–24 months out; constrained supply supports both.
Investment metrics
- 1% rule
- 2.50% ✓
- Cap rate
- 20.73%
- Cash-on-cash
- 51.56%
- DSCR
- 3.29
- GRM
- 3.3
CMA / ARV
No comps found within radius.
Projected returns pro-forma
-3.0% appreciation · 3.0% rent growth · sell at horizon
- IRR
- 49.5%
- Equity multiple
- 3.16×
- Total profit
- $27,231
- Equity at exit
- $6,710
- IRR
- 55.0%
- Equity multiple
- 6.42×
- Total profit
- $68,278
- Equity at exit
- $3,891
Cash invested: $12,600 (down + closing). Projections, not guarantees.
Landlord ↔ Tenant lean methodology
- Overall (STATE)
- 81 Strongly Landlord-Friendly
- State Missouri
- 81 Strongly Landlord-Friendly · R+10
- County
- — inherits STATE
- City
- — inherits STATE
ZIP-level market 63020
- Home prices YoY
- -21.9%
- Active inventory
- 150
- Price-to-rent
- 3.3×
Monthly cashflow live
- Estimated rent
- $1,127 medium interval (Pro) →
- Mortgage (P&I)
- −$236
- Tax from tax record
- −$94 /mo · $1,131/yr
- Insurance
- −$19
- HOA
- −$0
- Vacancy / Maint / Mgmt
- −$237
- Net cashflow
- $541
Break-even live
UW: 25.0% down · 7.5% · 30yr · 1.5% tax · 5.0% vac · 8.0% maint · 8.0% mgmt
Financing live
Cash to close
- Down payment
- $11,250
- Closing costs
- $1,350
- Reserves months
- —
- Total cash needed
- —
Loan-product check · same deal, 3 products live
Conventional
25% down · 7.5% · 30yr
- Down + closing
- —
- Monthly P&I
- —
- Monthly cashflow
- —
- DSCR
- —
- Eligible?
- —
Personal DTI + credit; lowest rate.
DSCR
20% down · 8.5% · 30yr
- Down + closing
- —
- Monthly P&I
- —
- Monthly cashflow
- —
- DSCR
- —
- Eligible?
- —
No personal income docs; deal must DSCR.
Hard money
10% down · 12.0% · 12mo
- Down + closing
- —
- Monthly P&I
- —
- Monthly cashflow
- —
- DSCR
- —
- Eligible?
- —
Short-term bridge; refi at stabilization.
Listing history 14 events
-
2026-06-18days on market $45,000 Active 226 DOM
-
2026-06-17days on market $45,000 Active 225 DOM
-
2026-06-16days on market $45,000 Active 224 DOM
-
2026-06-15days on market $45,000 Active 223 DOM
-
2026-06-13days on market $45,000 Active 221 DOM
-
2026-06-12days on market $45,000 Active 220 DOM
-
2026-06-09days on market $45,000 Active 217 DOM
-
2026-06-08days on market $45,000 Active 216 DOM
-
2026-06-07days on market $45,000 Active 215 DOM
-
2026-06-07days on market $45,000 Active 214 DOM
-
2026-06-04days on market $45,000 Active 211 DOM
-
2026-06-02days on market $45,000 Active 210 DOM
-
2026-06-01days on market $45,000 Active 209 DOM
-
2026-05-31days on market $45,000 Active 208 DOM
ⓘ Source: listings_history table (triggers on properties + properties_extension) + one-shot
backfill from property_details.listing_events for pre-trigger history.
Tax reassessment forecast MO · Resets to sale price
- Current annual tax
- $1,131 · $94/mo
- Projected year-2 tax
- $1,131 · $94/mo
- Expected delta
- $0/yr ($0/mo · 0.0%)
ⓘ Screening estimate from a state-policy table — verify with the county assessor before closing.
Climate risk First Street
- Flood 1/10 Low FEMA zone X (unshaded) · 0% chance over 30 yrs
- Wildfire 4/10 Moderate
- Heat 5/10 Major 7 d/yr ≥106°F today · 20 d/yr by 30 yrs out
- Wind 2/10 Low 100% chance of damaging wind over 30 yrs
- Air quality 2/10 Low 1 unhealthy d/yr today · 1 by 30 yrs out
Nearby sold comps map
Loading sold comps map…
Walkable amenities ~0.75 mi
Loading nearby amenities…
Taxation est. · year 1
- Rental income
- $13,525
- − Mortgage interest
- −$2,521
- − Property taxes
- −$1,131
- − Insurance
- −$225
- − Repairs & maintenance
- −$1,082
- − Management
- −$1,082
- − Depreciation
- −$1,309
- Taxable income
- $6,175
- Est. tax owed @ 24.0%
- −$1,482
- After-tax cash flow
- $5,015/yr
For passive investors: Depreciation is non-cash, so a rental often shows a tax loss while cash-flowing — sheltering income. Rental losses are passive: they offset passive income freely, and up to $25,000/yr can offset ordinary (W-2) income if you actively participate and your MAGI is under $100k (phasing out to $0 by $150k); unused losses carry forward. On sale, claimed depreciation is recaptured at up to 25%, and gains may owe capital-gains tax (a 1031 exchange can defer both). Figures are a year-1 estimate at your 24.0% rate — not tax advice; consult a CPA.
Schools (NCES district)
- District
- Desoto 73
- NCES district ID
- 2910500
- Math proficiency
- 36% ▼ -3.00%
- Reading proficiency
- 43% ▲ 3.00%
- Median HH income
- $44,354
- Composite
- 33.52/100
- National rank
- #5434
- State rank
- #153 of 324 in MO
Livability — De Soto
- Score
- 59/100
- State rank
- #523
- US rank
- #19709
Category grades
Schools grade is shown separately in the Schools card above.
Census & demographics
- Census place
- De Soto, MO
- Population (ZIP)
- 20,357
Population outlook (Jefferson County) Hauer SSP2
- Today (2025)
- 235,088 people
- By 2030
- 238,365 · +1.4%
- By 2040
- 240,156 · +2.2%
- By 2050
- 234,651 · -0.2%
- By 2075
- 214,569 · -8.7%
- By 2100
- 179,697 · -23.6%
Race, ethnicity, and origin ACS 2023
- Neighborhood character
- Predominantly White (88%)
- Race & ethnicity
- White 88% Two or more races 10% Hispanic / Latino 1%
- Common ancestry
- Lithuanian 5% Iranian 2% Italian 1%
- Foreign-born
- 1% · Canada
- Languages at home
- 98% English-only · Spanish 1%
Political lean MEDSL · Jefferson
- 2024 margin
- Solid R (+36.7) · D 31.0% · R 67.7% · Other 1.3%
- 2008→2024 swing
- -39.3pp toward R · 2008: 2.5pp · 2024: -36.7pp
- All cycles
- 2024: R+36.7 2020: R+33.9 2016: R+35.3 2012: R+12.7 2008: D+2.5
Not yet ingested
- Civics
- —
Market trends
- HPI YoY
- ▼ -60.90%
- Current HPI
- 217.2807
- Rent YoY
- —
- Metro
- —
- State GDP YoY
- ▲ 1.84%
- F500 in state
- 20
Industry mix (Fortune 500 HQ in MO)
| Industry | F500 HQs | Revenue |
|---|---|---|
| Healthcare | 1 | $163B |
|
||
| Insurance | 1 | $21B |
|
||
| Industrial Technology | 1 | $17B |
|
||
| Retail | 1 | $16B |
|
||
| Industrial Distribution | 1 | $10B |
|
||
| Utilities | 1 | $9B |
|
||
Price history
+50.0% since first listed27 events — show timeline
- 2026-05-27 Relisted — MARIS as Distributed by MLS Grid
- 2026-01-08 Price Changed $45,000 MARIS as Distributed by MLS Grid
- 2025-11-17 Price Changed $57,000 MARIS as Distributed by MLS Grid
- 2025-10-20 Price Changed $59,000 MARIS as Distributed by MLS Grid
- 2025-10-10 Listed $60,000 MARIS as Distributed by MLS Grid
- 2025-10-08 Coming Soon $60,000 MARIS as Distributed by MLS Grid
- 2022-03-30 Sold (MLS) — MARIS as Distributed by MLS Grid
- 2022-03-01 Contingent — MARIS as Distributed by MLS Grid
- 2022-02-23 Relisted — MARIS as Distributed by MLS Grid
- 2022-02-21 Contingent — MARIS as Distributed by MLS Grid
- 2022-02-17 Price Changed $135,000 MARIS as Distributed by MLS Grid
- 2022-02-14 Relisted — MARIS as Distributed by MLS Grid
- 2022-01-31 Contingent — MARIS as Distributed by MLS Grid
- 2022-01-27 Price Changed $148,000 MARIS as Distributed by MLS Grid
- 2022-01-19 Listed $154,000 MARIS as Distributed by MLS Grid
- 2020-04-02 Sold (Public Records) — Public Records
- 2020-03-25 Sold (MLS) — MARIS as Distributed by MLS Grid
- 2020-02-28 Pending — MARIS as Distributed by MLS Grid
- 2020-02-19 Price Changed $105,000 MARIS as Distributed by MLS Grid
- 2020-02-04 Relisted — MARIS as Distributed by MLS Grid
- 2020-01-27 Pending — MARIS as Distributed by MLS Grid
- 2020-01-22 Listed $109,000 MARIS as Distributed by MLS Grid
- 2019-09-09 Sold (Public Records) — Public Records
- 2019-08-23 Sold (MLS) — MARIS as Distributed by MLS Grid
- 2019-08-13 Pending — MARIS as Distributed by MLS Grid
- 2019-07-15 Price Changed $20,000 MARIS as Distributed by MLS Grid
- 2019-05-13 Listed $30,000 MARIS as Distributed by MLS Grid
Property tax history
+45.3%/yrLatest (2025): $1,131 · +13.1% YoY. Source: county tax records.
Cash-flow waterfall
monthlySold comps — $/sqft
last 12 mo · ≤1 miLoading sold comps…