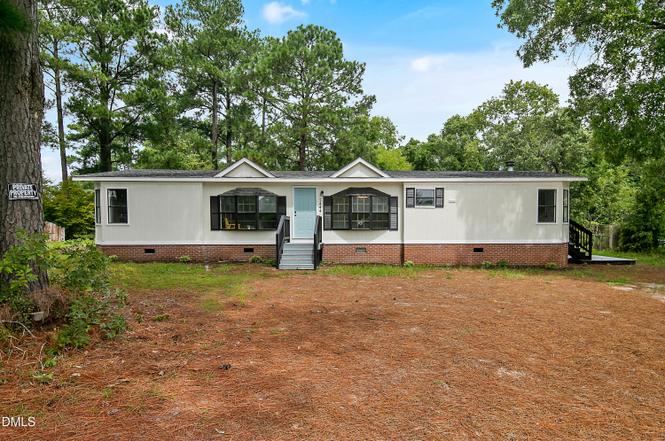
5444 Gilcrest Sands Dr · Hope Mills, NC
Flood risk 1/10 · Minimal
- FEMA flood zone
- X (unshaded)
- Chance of flooding over 30 yrs
- 0.0%
- Est. flood insurance / yr
- $507 – $1,088
Fire risk 6/10 · Moderate
- Est. fire insurance / yr
- $906 – $1,684
Heat risk 7/10 · Major
- Hot days now (above 106°F)
- 7 days/yr
- Hot days in 30 yrs
- 16 days/yr
Wind risk 8/10 · Major
- Chance of severe wind over 30 yrs
- 80.0%
Air-quality risk 1/10 · Minimal
- Unhealthy air days now
- 0 days/yr
- Unhealthy air days in 30 yrs
- 0 days/yr
Risk factors via First Street. Map © Google.
Why this score? — see what drove the C+ grade
The composite is a weighted blend of 9 inputs, each scored 0–100. Each bar is that input's sub-score; the figure is the points it added to the 100-point composite (weight × sub-score).
- Cash flow +24.2/30.0
- ARV discount +13.0/15.0
- DSCR +7.8/10.0
- 1% rule +5.4/10.0
- Rent growth +3.6/5.0
- Livability +3.4/5.0
- Schools +3.1/10.0
- Condition / age +2.5/5.0
- Appreciation +0.0/10.0
$162,500
🖨 Deal sheet 📄 Offer letter ✓ Due diligence
Listing remarks
Welcome Home to Hope Mills! Located in a community setting in Hope Mills, this property offers a straightforward layout suitable for everyday living. The home provides spaces for relaxation, daily routines, and gathering with others. Outside, there is an area that can be used for simple outdoor enjoyment. * Spring Special, ask us what we are offering for this season!
Key facts
- 0.54 acre lot
- Built 1993
- Listed 161 days
Property features AI
Finance
- Other: Living area approximately 1,699; Located in Cumberland County, NC
- HOA & community: No HOA; Not a senior community
Exterior
- Utilities: Public sewer; Well water
- Home design: Manufactured double-wide home; One-story
- Construction: Vinyl siding; Other exterior materials
- Exterior features: Permanent foundation; Shingle roof; Lot approximately 0.54 acres; Publicly maintained road access
Interior
- Bedrooms: 3 bedrooms (all on the main level)
- Flooring: Carpet; Laminate; Vinyl
- Bathrooms: 2 full bathrooms
- Heating & cooling: Forced air heating; Central air conditioning
- Interior features: Carpet, laminate and vinyl flooring
Neighborhood map
What this means for you Summary
Snapshot
- This is a 3-bed/2.0-bath manufactured listed at $162k.
Deal economics
- At list price, monthly cash flow is $324 ($4k/yr) — positive.
- The deal already cash-flows at list — no discount required.
- Meets the 1% rule at list price ($2k rent vs $162k).
- Recommended offer: $143k (12.0% below list) — sets the bar for market timing.
- Cap rate 8.7% vs local median 4.8% in Hope Mills — top-decile yield for the area; either an underpriced asset or a hidden risk that comps aren't pricing in. Stress-test before assuming the spread holds.
Location & tenants
- Location reads 67/100 on livability (#234 in NC) — a middle-class / working-renter tenant base. Strengths: cost of living A+, housing A+, health & safety B+; Watch: schools D, crime D-, amenities F.
- Cumberland County Schools (urban): math 32% / reading 41% proficiency, ranked #126 of 178 in NC (top 71%) — families likely to look elsewhere, expect single-tenant / working-renter base with shorter leases.
- Market conditions: Rents rising fast (+4.3%/yr); 317 active listings in the ZIP; 6 comparable units currently listed for rent nearby; rentals at typical pace (median 23d on market — plan ~3-4 weeks tenant-placement turnaround); 1,125 units permitted in Cumberland County in 2024 (104 in 5+ unit buildings).
- This rent runs 31% of the median local income ($66k/yr) — at the standard rent-burdened threshold; future hikes will face affordability resistance.
Forward outlook
- Local home prices are declining (-3.0%/yr); year-one equity from $1k of loan paydown is wiped out by about $5k of value loss. Plan a longer hold.
Negotiation context
- It's been on market 161 days — a 12% lower offer ($143k) is reasonable based on typical stale-listing flexibility.
- 4 sale attempts since 2y ago with the ask held roughly flat each time — persistent listings suggest the price (not the market) is what's stuck; bring a comps-based counter.
- Current owner paid $64k; list at $162k implies a 156% gain — meaningful room to come down on a strong offer.
Risks & watch-outs
- Climate carrying-cost: severe wind risk, 80% chance of damaging wind over 30y; major wildfire risk; extreme-heat days projected 7→16/yr by 2055 (HVAC capex compounding) — expect insurance premiums to compound above CPI over the hold.
Questions for the listing agent
- It's been on market 161 days. Have you received any prior offers? Is the seller open to a 12% concession, seller financing, or rate buy-down credit?
- Why hasn't it sold? Are there any deal-killer items the seller is aware of (foundation, flood, title, zoning, code violations)?
- Is there a deadline driving the sale (1031 exchange, divorce, estate, relocation)? That informs how much negotiation room exists.
- Schools are D-rated, which usually means shorter tenancies and higher turnover. Who's the typical renter profile here, and what's been the actual vacancy rate?
- Crime grade is D in this area — have there been break-ins, vandalism, or insurance claims at this property in the last 3 years? What carrier currently insures it and at what premium?
- What's the average days-on-market for RENTAL listings here right now (not sales)? A rising rental-DOM trend means longer vacancies and softer asking-rent achievability than the comps imply.
- What's the recent tenant-quality profile in this submarket — average credit score on applications, eviction rate, late-payment / NSF rate, and stable-employment percentage? A property-management company in the area should have these aggregated.
- How much new for-sale + rental construction is in the pipeline within 1–3 miles? Heavy new supply typically softens prices + rents 12–24 months out; constrained supply supports both.
Investment metrics
- 1% rule
- 1.04% ✓
- Cap rate
- 8.68%
- Cash-on-cash
- 8.54%
- DSCR
- 1.38
- GRM
- 8.0
CMA / ARV
- ARV (on-the-fly)
- $185,191
- Comps found
- 8
Show comp detail 8 sales within ~0.75 mi
| Address | Dist | Beds/Ba | Sqft | Sold | Price | $/sf | Match |
|---|---|---|---|---|---|---|---|
| 5837 Parkton Rd | 0.41mi | 3/2.0 | 1,674 (-2%) | 2mo | $67,000 | $40 | 77 |
| 6117 Earp Ct | 0.32mi | 3/2.0 | 1,836 (+8%) | 8mo | $199,900 | $109 | 65 |
| 6210 Earp Ct | 0.39mi | 3/2.0 | 1,890 (+11%) | 4mo | $185,000 | $98 | 60 |
| 6105 Earp Ct | 0.28mi | 3/3.0 | 1,831 (+8%) | 19mo | $199,900 | $109 | 54 |
| 5968 Parkton Rd | 0.52mi | 3/2.0 | 1,674 (-2%) | 23mo | $108,450 | $65 | 54 |
| 597 Palindrome Ct | 0.52mi | 3/2.0 | 1,620 (-5%) | 20mo | $189,900 | $117 | 52 |
| 4904 Madison Dr | 0.63mi | 3/2.0 | 1,585 (-7%) | 13mo | $116,000 | $73 | 49 |
| 809 Abundant Dr | 0.61mi | 3/2.0 | 1,596 (-6%) | 24mo | $197,500 | $124 | 42 |
Match score weights: distance 35% · size 25% · config 20% · recency 20%. Top-matched comps best support the ARV.
Projected returns pro-forma
-3.0% appreciation · 4.28% rent growth · sell at horizon
- IRR
- -2.0%
- Equity multiple
- 0.92×
- Total profit
- $-3,547
- Equity at exit
- $24,229
- IRR
- 8.9%
- Equity multiple
- 1.72×
- Total profit
- $32,594
- Equity at exit
- $14,050
Cash invested: $45,500 (down + closing). Projections, not guarantees.
Landlord ↔ Tenant lean methodology
- Overall (STATE)
- 85 Strongly Landlord-Friendly
- State North Carolina
- 85 Strongly Landlord-Friendly · R+3
- County
- — inherits STATE
- City
- — inherits STATE
ZIP-level market 28348
- Home prices YoY
- -14.0%
- Rents YoY
- 4.3%
- Active inventory
- 317
- Price-to-rent
- 8.0×
Monthly cashflow live
- Estimated rent
- $1,693 high interval (Pro) →
- Mortgage (P&I)
- −$852
- Tax from tax record
- −$94 /mo · $1,131/yr
- Insurance
- −$68
- HOA
- −$0
- Vacancy / Maint / Mgmt
- −$356
- Net cashflow
- $324
Break-even live
UW: 25.0% down · 7.5% · 30yr · 1.5% tax · 5.0% vac · 8.0% maint · 8.0% mgmt
Financing live
Cash to close
- Down payment
- $40,625
- Closing costs
- $4,875
- Reserves months
- —
- Total cash needed
- —
Loan-product check · same deal, 3 products live
Conventional
25% down · 7.5% · 30yr
- Down + closing
- —
- Monthly P&I
- —
- Monthly cashflow
- —
- DSCR
- —
- Eligible?
- —
Personal DTI + credit; lowest rate.
DSCR
20% down · 8.5% · 30yr
- Down + closing
- —
- Monthly P&I
- —
- Monthly cashflow
- —
- DSCR
- —
- Eligible?
- —
No personal income docs; deal must DSCR.
Hard money
10% down · 12.0% · 12mo
- Down + closing
- —
- Monthly P&I
- —
- Monthly cashflow
- —
- DSCR
- —
- Eligible?
- —
Short-term bridge; refi at stabilization.
Rent comps 6 comps
| Address | Beds | Baths | Sqft | Rent | $/sqft | DOM | Units | Dist |
|---|---|---|---|---|---|---|---|---|
| 5536 Gilcrest Sands Dr Hope Mills, NC | 3.0 | 2.0 | 1421 | $1,395 | $0.98 | 23d | 1 | 0.20mi |
| 5660 Bauer St Hope Mills, NC | 3.0 | 2.0 | 1492 | $1,495 | $1.00 | 23d | 1 | 0.32mi |
| 4807 S Main St Hope Mills, NC | 3.0 | 2.5 | 1722 | $1,600 | $0.93 | 23d | 1 | 1.09mi |
| 5715 Walkabout Rd Hope Mills, NC | 3.0 | 2.0 | 1143 | $1,675 | $1.47 | 23d | 1 | 1.14mi |
| 4240 High Stakes Cir Parkton, NC | 1.0–3.0 | 1.0–2.0 | 1000 | $1,625 | $1.62 | 13d | 9 | 1.27mi |
| 3766 Colonial Cv Hope Mills, NC | 3.0 | 1.5 | 1475 | $1,445 | $0.98 | 13d | 1 | 1.49mi |
Listing history 22 events
-
2026-04-30status Pending
-
2026-03-21price $162,500
-
2026-03-13price $162,600
-
2026-03-08price $162,700
-
2026-02-26price $162,800
-
2026-02-16price $162,900
-
2025-12-13price $165,900
-
2025-11-15$169,300 Active
-
2025-08-23price $169,300
-
2025-07-25status Active
-
2025-06-09status Pending
-
2025-01-16price $174,300
-
2025-01-09price $174,400
-
2025-01-05status Active
-
2024-11-19status Pending
-
2024-11-08price $174,500
-
2024-11-02price $174,600
-
2024-09-29price $174,700
-
2024-09-10price $174,800
-
2024-08-16$174,900 Active
-
1997-12-31soldstatus $63,500
-
1996-03-20soldstatus $57,000
ⓘ Source: listings_history table (triggers on properties + properties_extension) + one-shot
backfill from property_details.listing_events for pre-trigger history.
Tax reassessment forecast NC · Resets to sale price
- Current annual tax
- $1,131 · $94/mo
- Projected year-2 tax
- $1,332 · $111/mo
- Expected delta
- +$202/yr (+$17/mo · 17.8%)
ⓘ Screening estimate from a state-policy table — verify with the county assessor before closing.
Climate risk First Street
- Flood 1/10 Low FEMA zone X (unshaded) · 0% chance over 30 yrs
- Wildfire 6/10 Major
- Heat 7/10 Severe 7 d/yr ≥106°F today · 16 d/yr by 30 yrs out
- Wind 8/10 Severe 80% chance of damaging wind over 30 yrs
- Air quality 1/10 Low 0 unhealthy d/yr today · 0 by 30 yrs out
Nearby sold comps map
Loading sold comps map…
Walkable amenities ~0.75 mi
Loading nearby amenities…
Taxation est. · year 1
- Rental income
- $20,322
- − Mortgage interest
- −$9,103
- − Property taxes
- −$1,131
- − Insurance
- −$812
- − Repairs & maintenance
- −$1,626
- − Management
- −$1,626
- − Depreciation
- −$4,727
- Taxable income
- $1,297
- Est. tax owed @ 24.0%
- −$311
- After-tax cash flow
- $3,573/yr
For passive investors: Depreciation is non-cash, so a rental often shows a tax loss while cash-flowing — sheltering income. Rental losses are passive: they offset passive income freely, and up to $25,000/yr can offset ordinary (W-2) income if you actively participate and your MAGI is under $100k (phasing out to $0 by $150k); unused losses carry forward. On sale, claimed depreciation is recaptured at up to 25%, and gains may owe capital-gains tax (a 1031 exchange can defer both). Figures are a year-1 estimate at your 24.0% rate — not tax advice; consult a CPA.
Schools (NCES district)
- District
- Cumberland County Schools
- NCES district ID
- 3700011
- Math proficiency
- 32% ▼ -2.00%
- Reading proficiency
- 41% ▼ -1.00%
- Median HH income
- $44,168
- Composite
- 31.0/100
- National rank
- #6096
- State rank
- #126 of 178 in NC
Livability — Hope Mills
- Score
- 67/100
- State rank
- #234
- US rank
- #10761
Category grades
Schools grade is shown separately in the Schools card above.
Census & demographics
- County
- Cumberland County · 265,314 people
- City population
- 39,196
- Metro
- Fayetteville, NC
- Population (ZIP)
- 39,196
- Household income
- $66,129
- Rent vs Own
- Severe rent burden
- 746.0
Population outlook (Cumberland County) Hauer SSP2
- Today (2025)
- 330,855 people
- By 2030
- 333,523 · +0.8%
- By 2040
- 335,583 · +1.4%
- By 2050
- 335,325 · +1.4%
- By 2075
- 342,853 · +3.6%
- By 2100
- 340,698 · +3.0%
Race, ethnicity, and origin ACS 2023
- Neighborhood character
- Diverse neighborhood (Simpson 0.67)
- Race & ethnicity
- White 49% Black 27% Hispanic / Latino 13% Two or more races 11% Asian 2% Native American 2%
- Hispanic origin (detail)
- Mexican 4% Puerto Rican 5%
- Common ancestry
- Romanian 2% Lithuanian 1% Serbian 1%
- Foreign-born
- 5% · Canada, South Korea, Vietnam
- Languages at home
- 90% English-only · Spanish 8% Other Indo-European 1%
Political lean MEDSL · Cumberland
- 2024 margin
- D (+13.4) · D 56.1% · R 42.7% · Other 1.2%
- 2008→2024 swing
- -4.3pp toward R · 2008: 17.7pp · 2024: 13.4pp
- All cycles
- 2024: D+13.4 2020: D+16.6 2016: D+16.0 2012: D+19.7 2008: D+17.7
Not yet ingested
- Civics
- —
Market trends
- HPI YoY
- ▼ -37.14%
- Current HPI
- 228.3122
- Rent YoY
- ▲ 4.28%
- Metro
- Fayetteville, NC
- State GDP YoY
- ▲ 3.28%
- F500 in state
- 26
Industry mix (Fortune 500 HQ in NC)
| Industry | F500 HQs | Revenue |
|---|---|---|
| Financial Services | 2 | $213B |
|
||
| Retail | 2 | $95B |
|
||
| Industrial Conglomerate | 1 | $38B |
|
||
| Metals / Steel | 1 | $35B |
|
||
| Utilities | 1 | $30B |
|
||
| Industrial Machinery | 1 | $19B |
|
||
Price history
+185.1% since first listed22 events — show timeline
- 2026-04-30 Pending — TMLS
- 2026-03-21 Price Changed $162,500 TMLS
- 2026-03-13 Price Changed $162,600 TMLS
- 2026-03-08 Price Changed $162,700 TMLS
- 2026-02-26 Price Changed $162,800 TMLS
- 2026-02-16 Price Changed $162,900 TMLS
- 2025-12-13 Price Changed $165,900 TMLS
- 2025-11-15 Listed $169,300 TMLS
- 2025-08-23 Price Changed $169,300 LPRMLS
- 2025-07-25 Relisted — LPRMLS
- 2025-06-09 Pending — LPRMLS
- 2025-01-16 Price Changed $174,300 LPRMLS
- 2025-01-09 Price Changed $174,400 LPRMLS
- 2025-01-05 Relisted — LPRMLS
- 2024-11-19 Pending — LPRMLS
- 2024-11-08 Price Changed $174,500 LPRMLS
- 2024-11-02 Price Changed $174,600 LPRMLS
- 2024-09-29 Price Changed $174,700 LPRMLS
- 2024-09-10 Price Changed $174,800 LPRMLS
- 2024-08-16 Listed $174,900 LPRMLS
- 1997-12-31 Sold (Public Records) $63,500 Public Records
- 1996-03-20 Sold (Public Records) $57,000 Public Records
Property tax history
+6.3%/yrLatest (2025): $1,131 · +82.3% YoY. Source: county tax records.
Cash-flow waterfall
monthlySold comps — $/sqft
last 12 mo · ≤1 miLoading sold comps…