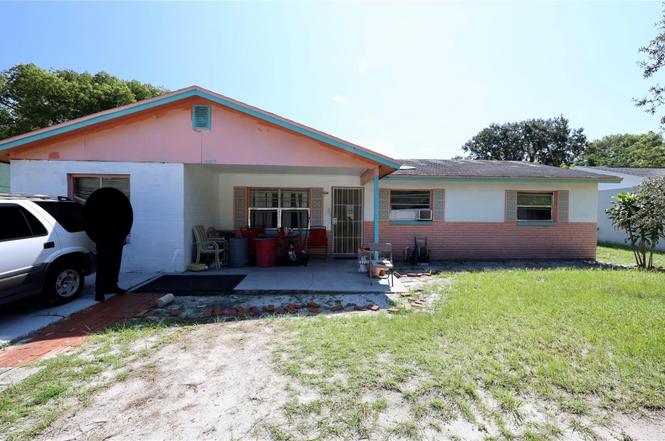
2009 S Summerlin Ave · Sanford, FL
Flood risk 1/10 · Minimal
- FEMA flood zone
- X (unshaded)
- Chance of flooding over 30 yrs
- 0.0%
- Est. flood insurance / yr
- $507 – $1,088
Fire risk 4/10 · Minor
- Est. fire insurance / yr
- $947 – $1,759
Heat risk 9/10 · Severe
- Hot days now (above 107°F)
- 7 days/yr
- Hot days in 30 yrs
- 22 days/yr
Wind risk 9/10 · Severe
- Chance of severe wind over 30 yrs
- 99.0%
Air-quality risk 2/10 · Minimal
- Unhealthy air days now
- 1 days/yr
- Unhealthy air days in 30 yrs
- 1 days/yr
Risk factors via First Street. Map © Google.
Why this score? — see what drove the C grade
The composite is a weighted blend of 9 inputs, each scored 0–100. Each bar is that input's sub-score; the figure is the points it added to the 100-point composite (weight × sub-score).
- Cash flow +18.6/30.0
- ARV discount +15.0/15.0
- DSCR +5.8/10.0
- 1% rule +5.3/10.0
- Schools +5.1/10.0
- Livability +3.7/5.0
- Rent growth +2.6/5.0
- Condition / age +2.5/5.0
- Appreciation +0.0/10.0
$170,000
🖨 Deal sheet 📄 Offer letter ✓ Due diligence
Listing remarks
Under contract-accepting backup offers. PARTITION SALE - ONE DAY GROUP SHOWING, Contact agent for the time and date. Cash Only. Sold AS-IS, NO assignable contracts. Opportunity awaits at 2009 Summerlin for investors or buyers ready to take on a full renovation project. This property is in need of repairs and is being sold AS-IS with cash offers only. No HOA. With the right remodel, this home has the potential to become an excellent primary residence or rental property. Ideally located just minutes from Lake Monroe, the Sanford Zoo, and historic downtown Sanford with its charming shops, restaurants, and waterfront attractions. Convenient access to major highways makes commuting and travel a
Key facts
- No hoa
- 8,400 sq ft lot
- Built 1972
Tags
Neighborhood map
What this means for you Summary
Snapshot
- This is a 2-bed/2.0-bath single-family listed at $170k.
Deal economics
- At list price, monthly cash flow is $165 ($2k/yr) — positive.
- The deal already cash-flows at list — no discount required.
- Meets the 1% rule at list price ($2k rent vs $170k).
- Recommended offer: $165k (3.0% below list) — sets the bar for market timing.
- Cap rate 7.5% vs local median 3.6% in Sanford — top-decile yield for the area; either an underpriced asset or a hidden risk that comps aren't pricing in. Stress-test before assuming the spread holds.
Location & tenants
- Location reads 73/100 on livability (#316 in FL) — a middle-class / working-renter tenant base. Strengths: cost of living A+, housing A+, health & safety A+; Watch: employment C-, crime F, amenities F.
- Seminole (suburban): math 57% / reading 61% proficiency, ranked #13 of 73 in FL (top 18%) — acceptable for families but not a draw, mixed tenant base, ~2y average lease.
- Zoned schools: Seminole High School (math 35% / reading 51%, grade F, #255 of 667 statewide, top 39%, 4,036 students, 53% FRL).
- Zoned-school proficiency averages 43% at this address vs 59% district-wide (-16 pts) — the specific schools serving this property underperform the Seminole average; the district grade overstates school quality for this exact location.
- Market conditions: Rents flat; 561 active listings in the ZIP; 27 comparable units currently listed for rent nearby; rentals at typical pace (median 16d on market — plan ~3-4 weeks tenant-placement turnaround); solid renter incomes; 1,979 units permitted in Seminole County in 2024 (1,191 in 5+ unit buildings).
Forward outlook
- Local home prices are declining (-3.0%/yr); year-one equity from $1k of loan paydown is wiped out by about $5k of value loss. Plan a longer hold.
- Seminole County population projected at +24% by 2050 — long-run rental-demand tailwind backs the buy-and-hold thesis.
Negotiation context
- It's been on market 38 days — a 3% lower offer ($165k) is reasonable based on typical stale-listing flexibility.
- Current owner paid $19k; list at $170k implies a 799% gain — meaningful room to come down on a strong offer.
Risks & watch-outs
- Climate carrying-cost: severe wind risk, 99% chance of damaging wind over 30y; extreme-heat days projected 7→22/yr by 2055 (HVAC capex compounding) — expect insurance premiums to compound above CPI over the hold.
Questions for the listing agent
- It's been on market 38 days. Have you received any prior offers? Is the seller open to a 3% concession, seller financing, or rate buy-down credit?
- Built in 1972 — when were the roof, HVAC, electrical panel, plumbing, and water heater last replaced?
- Is there a deadline driving the sale (1031 exchange, divorce, estate, relocation)? That informs how much negotiation room exists.
- Schools are B-rated — typically a magnet for longer-tenancy family renters. What's the average tenant stay here, and is there a school-zone premium baked into asking?
- Crime grade is F in this area — have there been break-ins, vandalism, or insurance claims at this property in the last 3 years? What carrier currently insures it and at what premium?
- What's the average days-on-market for RENTAL listings here right now (not sales)? A rising rental-DOM trend means longer vacancies and softer asking-rent achievability than the comps imply.
- What's the recent tenant-quality profile in this submarket — average credit score on applications, eviction rate, late-payment / NSF rate, and stable-employment percentage? A property-management company in the area should have these aggregated.
- How much new for-sale + rental construction is in the pipeline within 1–3 miles? Heavy new supply typically softens prices + rents 12–24 months out; constrained supply supports both.
Investment metrics
- 1% rule
- 1.03% ✓
- Cap rate
- 7.46%
- Cash-on-cash
- 4.16%
- DSCR
- 1.18
- GRM
- 8.1
CMA / ARV
- ARV (on-the-fly)
- $237,130
- Comps found
- 12
Show comp detail 12 sales within ~0.75 mi
| Address | Dist | Beds/Ba | Sqft | Sold | Price | $/sf | Match |
|---|---|---|---|---|---|---|---|
| 1906 S Summerlin Ave | 0.15mi | 3/1.0 (+1) | 1,015 (-2%) | 12mo | $225,000 | $222 | 71 |
| 2402 Stevens Ave | 0.26mi | 2/1.0 | 993 (-4%) | 8mo | $140,000 | $141 | 71 |
| 1920 S Summerlin Ave | 0.08mi | 3/1.0 (+1) | 1,122 (+9%) | 4mo | $257,000 | $229 | 69 |
| 1501 Wynnewood Dr | 0.41mi | 3/1.0 (+1) | 1,011 (-2%) | 0mo | $196,000 | $194 | 68 |
| 1500 S Summerlin Ave | 0.38mi | 2/1.0 | 952 (-8%) | 2mo | $148,000 | $155 | 64 |
| 328 San Lanta Cir | 0.53mi | 3/2.0 (+1) | 1,064 (+3%) | 4mo | $285,000 | $268 | 62 |
| 1326 S Summerlin Ave | 0.43mi | 3/2.0 (+1) | 1,008 (-2%) | 16mo | $256,000 | $254 | 58 |
| 2408 Decottes Ave | 0.34mi | 3/1.0 (+1) | 1,125 (+9%) | 3mo | $292,000 | $260 | 57 |
| 1502 S Summerlin Ave | 0.38mi | 3/2.0 (+1) | 952 (-8%) | 11mo | $235,000 | $247 | 56 |
| 1523 S Mellonville Ave | 0.38mi | 2/1.0 | 912 (-12%) | 10mo | $210,000 | $230 | 51 |
| 416 N Grandview Ave N | 0.74mi | 2/1.0 | 887 (-14%) | 3mo | $324,500 | $366 | 36 |
| 905 S Scott Ave | 0.73mi | 3/2.0 (+1) | 1,152 (+12%) | 16mo | $247,000 | $214 | 28 |
Match score weights: distance 35% · size 25% · config 20% · recency 20%. Top-matched comps best support the ARV.
Projected returns pro-forma
-3.0% appreciation · 0.38% rent growth · sell at horizon
- IRR
- -12.9%
- Equity multiple
- 0.55×
- Total profit
- $-21,505
- Equity at exit
- $25,348
- IRR
- -8.7%
- Equity multiple
- 0.53×
- Total profit
- $-22,564
- Equity at exit
- $14,698
Cash invested: $47,600 (down + closing). Projections, not guarantees.
Landlord ↔ Tenant lean methodology
- Overall (STATE)
- 87 Strongly Landlord-Friendly
- State Florida
- 87 Strongly Landlord-Friendly · R+3
- County
- — inherits STATE
- City
- — inherits STATE
ZIP-level market 32771
- Rents YoY
- 0.4%
- Active inventory
- 561
- Price-to-rent
- 8.1×
Monthly cashflow live
- Estimated rent
- $1,759 high interval (Pro) →
- Mortgage (P&I)
- −$891
- Tax from tax record
- −$262 /mo · $3,149/yr
- Insurance
- −$71
- HOA
- −$0
- Vacancy / Maint / Mgmt
- −$369
- Net cashflow
- $165
Break-even live
UW: 25.0% down · 7.5% · 30yr · 1.5% tax · 5.0% vac · 8.0% maint · 8.0% mgmt
Financing live
Cash to close
- Down payment
- $42,500
- Closing costs
- $5,100
- Reserves months
- —
- Total cash needed
- —
Loan-product check · same deal, 3 products live
Conventional
25% down · 7.5% · 30yr
- Down + closing
- —
- Monthly P&I
- —
- Monthly cashflow
- —
- DSCR
- —
- Eligible?
- —
Personal DTI + credit; lowest rate.
DSCR
20% down · 8.5% · 30yr
- Down + closing
- —
- Monthly P&I
- —
- Monthly cashflow
- —
- DSCR
- —
- Eligible?
- —
No personal income docs; deal must DSCR.
Hard money
10% down · 12.0% · 12mo
- Down + closing
- —
- Monthly P&I
- —
- Monthly cashflow
- —
- DSCR
- —
- Eligible?
- —
Short-term bridge; refi at stabilization.
Rent comps 27 comps
| Address | Beds | Baths | Sqft | Rent | $/sqft | DOM | Units | Dist |
|---|---|---|---|---|---|---|---|---|
| 131 Langston Dr Sanford, FL | 3.0 | 1.5 | 1082 | $1,697 | $1.57 | 20d | 1 | 0.13mi |
| 838 Rosalia Dr Sanford, FL | 2.0 | 1.0 | 873 | $1,600 | $1.83 | 12d | 1 | 0.43mi |
| 1711 Roseberry Ln Sanford, FL | 3.0 | 2.0 | 984 | $2,150 | $2.18 | 5d | 1 | 0.47mi |
| 810 E 20th St Sanford, FL | 2.0 | 1.0 | 1204 | $1,750 | $1.45 | 5d | 1 | 0.49mi |
| 1574 Effra Way Sanford, FL | 3.0 | 2.0 | 1429 | $2,270 | $1.59 | 23d | 1 | 0.58mi |
| 619 San Lanta Cir Sanford, FL | 3.0 | 2.0 | 1092 | $1,796 | $1.64 | 14d | 1 | 0.59mi |
| 918 E 10th St Unit 918A Sanford, FL | 2.0 | 1.0 | 745 | $945 | $1.27 | 23d | 1 | 0.85mi |
| 2420 Daffadil Ter Sanford, FL | 3.0 | 2.0 | 1097 | $1,850 | $1.69 | 17d | 1 | 0.85mi |
| 2628 Daffadil Ter Sanford, FL | 3.0 | 2.0 | 1099 | $1,995 | $1.82 | 5d | 1 | 0.94mi |
| 101 E 21st St Sanford, FL | 3.0 | 2.0 | 896 | $2,500 | $2.79 | 23d | 1 | 0.95mi |
| 308 E 13th St Sanford, FL | 2.0 | 2.0 | 1129 | $1,750 | $1.55 | 5d | 1 | 0.99mi |
| 308 E 13th St Sanford, FL | 2.0 | 2.0 | 1129 | $1,850 | $1.64 | 23d | 1 | 0.99mi |
| 1201 S Palmetto Ave Sanford, FL | 2.0 | 1.0 | 1200 | $2,500 | $2.08 | 23d | 1 | 1.02mi |
| 912 Pine Ave Sanford, FL | 2.0 | 1.0 | 1122 | $1,595 | $1.42 | 23d | 1 | 1.02mi |
| 2561 Daffadil Ter Sanford, FL | 3.0 | 2.0 | 1099 | $1,900 | $1.73 | 23d | 1 | 1.02mi |
| 2441 Church St Sanford, FL | 3.0 | 1.0 | 1057 | $1,550 | $1.47 | 23d | 1 | 1.14mi |
| 2522 S Oak Ave Unit A Sanford, FL | 2.0 | 2.0 | 963 | $1,300 | $1.35 | 23d | 1 | 1.22mi |
| 2541 Myrtle Ave Unit C Sanford, FL | 2.0 | 2.0 | 1000 | $1,465 | $1.47 | 2d | 1 | 1.23mi |
| 2526 S Oak Ave Unit A Sanford, FL | 2.0 | 2.0 | 962 | $1,500 | $1.56 | 14d | 1 | 1.23mi |
| 2340 Broadway St Sanford, FL | 3.0 | 1.0 | 1084 | $800 | $0.74 | 17d | 1 | 1.34mi |
| 612 S Park Ave Unit 4 Sanford, FL | 2.0 | 1.0 | 720 | $1,295 | $1.80 | 21d | 1 | 1.37mi |
| 711 E 1st St Sanford, FL | 1.0 | 1.0 | 720 | $1,525 | $2.12 | 16d | 1 | 1.38mi |
| 711 E 1st St Unit 15w Sanford, FL | 1.0 | 1.0 | 720 | $1,525 | $2.12 | 14d | 1 | 1.38mi |
| 711 E 1st St Sanford, FL | 1.0 | 1.0 | 720 | $1,525 | $2.12 | 5d | 2 | 1.38mi |
| 2847 Gale Pl Sanford, FL | 3.0 | 1.5 | 1217 | $1,750 | $1.44 | 10d | 1 | 1.39mi |
| 201 Sanford Ave Sanford, FL | 1.0 | 1.0 | 779 | $1,795 | $2.30 | 2d | 1 | 1.44mi |
| 816 W 25th St Sanford, FL | 2.0 | 1.5 | 1134 | $1,299 | $1.15 | 2d | 1 | 1.49mi |
Listing history 3 events
-
2026-02-15status Pending
-
2026-01-08$170,000 Active
-
1983-08-01soldstatus $18,900
ⓘ Source: listings_history table (triggers on properties + properties_extension) + one-shot
backfill from property_details.listing_events for pre-trigger history.
Tax reassessment forecast FL · Resets to sale price
- Current annual tax
- $3,149 · $262/mo
- Projected year-2 tax
- $3,149 · $262/mo
- Expected delta
- $0/yr ($0/mo · 0.0%)
ⓘ Screening estimate from a state-policy table — verify with the county assessor before closing.
Climate risk First Street
- Flood 1/10 Low FEMA zone X (unshaded) · 0% chance over 30 yrs
- Wildfire 4/10 Moderate
- Heat 9/10 Extreme 7 d/yr ≥107°F today · 22 d/yr by 30 yrs out
- Wind 9/10 Extreme 99% chance of damaging wind over 30 yrs
- Air quality 2/10 Low 1 unhealthy d/yr today · 1 by 30 yrs out
Nearby sold comps map
Loading sold comps map…
Walkable amenities ~0.75 mi
Loading nearby amenities…
Taxation est. · year 1
- Rental income
- $21,109
- − Mortgage interest
- −$9,523
- − Property taxes
- −$3,149
- − Insurance
- −$850
- − Repairs & maintenance
- −$1,689
- − Management
- −$1,689
- − Depreciation
- −$4,945
- Taxable loss
- −$736
- Est. tax savings @ 24.0%
- +$177
- After-tax cash flow
- $2,156/yr
For passive investors: Depreciation is non-cash, so a rental often shows a tax loss while cash-flowing — sheltering income. Rental losses are passive: they offset passive income freely, and up to $25,000/yr can offset ordinary (W-2) income if you actively participate and your MAGI is under $100k (phasing out to $0 by $150k); unused losses carry forward. On sale, claimed depreciation is recaptured at up to 25%, and gains may owe capital-gains tax (a 1031 exchange can defer both). Figures are a year-1 estimate at your 24.0% rate — not tax advice; consult a CPA.
Schools (NCES district)
- District
- Seminole
- NCES district ID
- 1201710
- Math proficiency
- 57% ▼ -7.00%
- Reading proficiency
- 61% ▼ -1.00%
- Median HH income
- $58,478
- Composite
- 51.05/100
- National rank
- #1769
- State rank
- #13 of 73 in FL
Livability — Sanford
- Score
- 73/100
- State rank
- #316
- US rank
- #5359
Category grades
Schools grade is shown separately in the Schools card above.
Census & demographics
- Census place
- Sanford, FL
- County
- Seminole County · 436,154 people
- City population
- 96,638
- Metro
- Orlando-Kissimmee-Sanford, FL
- Population (ZIP)
- 62,606
- Household income
- $77,868
- Rent vs Own
- Severe rent burden
- 2645.0
Population outlook (Seminole County) Hauer SSP2
- Today (2025)
- 515,494 people
- By 2030
- 545,713 · +5.9%
- By 2040
- 598,068 · +16.0%
- By 2050
- 640,663 · +24.3%
- By 2075
- 724,461 · +40.5%
- By 2100
- 755,530 · +46.6%
Race, ethnicity, and origin ACS 2023
- Neighborhood character
- Diverse neighborhood (Simpson 0.70)
- Race & ethnicity
- White 43% Black 24% Hispanic / Latino 23% Two or more races 13% Asian 7%
- Hispanic origin (detail)
- Mexican 2% Puerto Rican 7% Cuban 2% Dominican 2%
- Common ancestry
- Romanian 2% Slovak 1% Italian 1%
- Foreign-born
- 18% · Canada, Jamaica, China
- Languages at home
- 76% English-only · Spanish 15% Other Indo-European 3% Other Asian/Pacific 1%
Political lean MEDSL · Seminole
- 2024 margin
- Toss-up / Even · D 47.6% · R 51.1% · Other 1.3%
- 2008→2024 swing
- -0.8pp no change · 2008: -2.8pp · 2024: -3.5pp
- All cycles
- 2024: R+3.5 2020: D+2.8 2016: R+1.6 2012: R+6.5 2008: R+2.8
Not yet ingested
- Civics
- —
Market trends
- HPI YoY
- ▼ -281.27%
- Current HPI
- 299.2738
- Rent YoY
- ▲ 0.38%
- Metro
- Orlando-Kissimmee-Sanford, FL
- State GDP YoY
- ▲ 3.28%
- F500 in state
- 36
Industry mix (Fortune 500 HQ in FL)
| Industry | F500 HQs | Revenue |
|---|---|---|
| Industrial Technology | 2 | $29B |
|
||
| Insurance | 2 | $17B |
|
||
| Retail | 1 | $60B |
|
||
| Technology Distribution | 1 | $58B |
|
||
| Homebuilding | 1 | $35B |
|
||
| Technology Manufacturing | 1 | $35B |
|
||
Price history
+799.5% since first listed3 events — show timeline
- 2026-02-15 Pending — Stellar MLS as Distributed by MLS Grid
- 2026-01-08 Listed $170,000 Stellar MLS as Distributed by MLS Grid
- 1983-08-01 Sold (Public Records) $18,900 Public Records
Property tax history
+16.2%/yrLatest (2025): $3,149 · +9.1% YoY. Source: county tax records.
Cash-flow waterfall
monthlySold comps — $/sqft
last 12 mo · ≤1 miLoading sold comps…