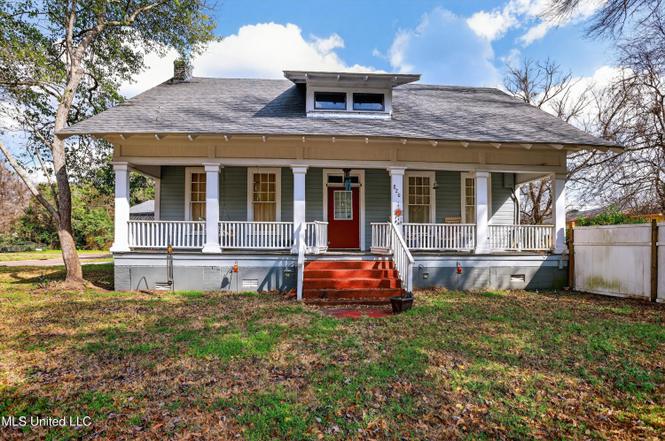
820 Rogers Ave · Columbia, MS
Flood risk 5/10 · Moderate
- FEMA flood zone
- X (unshaded)
- Chance of flooding over 30 yrs
- 0.65%
- Est. flood insurance / yr
- $507 – $1,088
Fire risk 5/10 · Moderate
- Est. fire insurance / yr
- $1,241 – $2,305
Heat risk 8/10 · Major
- Hot days now (above 111°F)
- 7 days/yr
- Hot days in 30 yrs
- 21 days/yr
Wind risk 8/10 · Major
- Chance of severe wind over 30 yrs
- 99.0%
Air-quality risk 1/10 · Minimal
- Unhealthy air days now
- 0 days/yr
- Unhealthy air days in 30 yrs
- 0 days/yr
Risk factors via First Street. Map © Google.
Why this score? — see what drove the B grade
The composite is a weighted blend of 9 inputs, each scored 0–100. Each bar is that input's sub-score; the figure is the points it added to the 100-point composite (weight × sub-score).
- Cash flow +27.5/30.0
- ARV discount +15.0/15.0
- DSCR +9.6/10.0
- 1% rule +6.7/10.0
- Schools +3.2/10.0
- Livability +3.2/5.0
- Rent growth +2.5/5.0
- Condition / age +2.5/5.0
- Appreciation +0.0/10.0
$115,000
🖨 Deal sheet (PDF) 📄 Offer letter ✓ Due diligence
Listing remarks
Rich with classic Southern charm, this inviting home offers warm character, a welcoming front porch, and a comfortable, flowing layout. Tucked into a quiet Columbia neighborhood, it provides a relaxed setting with convenient access to local shops, dining, and everyday essentials. A timeless feel with easy, livable appeal.
Key facts
- Front porch
- Convenient access
- Quiet neighborhood
Tags
Neighborhood map
What this means for you Summary
Snapshot
- This is a 3-bed/1.0-bath single-family listed at $115k.
Deal economics
- At list price, monthly cash flow is $340 ($4k/yr) — positive.
- The deal already cash-flows at list — no discount required.
- Meets the 1% rule at list price ($1k rent vs $115k).
- Recommended offer: $112k (3.0% below list) — sets the bar for market timing.
Location & tenants
- Location reads 63/100 on livability (#154 in MS) — a middle-class / working-renter tenant base. Strengths: cost of living A+, crime B, housing B; Watch: schools D, health & safety D, amenities F.
- Columbia School District (town): math 39% / reading 39% proficiency, ranked #45 of 130 in MS (top 35%) — families likely to look elsewhere, expect single-tenant / working-renter base with shorter leases; 67% free/reduced lunch — lower-income household profile, screen leases tightly.
- Market conditions: 133 active listings in the ZIP; 2 units permitted in Marion County in 2024 (0 in 5+ unit buildings).
Forward outlook
- Local home prices are declining (-3.0%/yr); year-one equity from $795 of loan paydown is wiped out by about $3k of value loss. Plan a longer hold.
- Marion County population projected at -33% by 2050 — secular population decline; favor cash flow + early exit over multi-decade hold.
- At projected returns (-3.0% appreciation + 3.0% rent growth), your $32k cash investment doubles in ~9 years — after that, you're playing with house money.
Negotiation context
- It's been on market 48 days — a 3% lower offer ($112k) is reasonable based on typical stale-listing flexibility.
- 8 sale attempts since 23y ago; this cycle's ask has dropped $15k (12%) from the opening price — seller is motivated, your offer sets the floor, not the list.
Risks & watch-outs
- Watch-outs: built in 1920 — expect roof / HVAC / electrical / plumbing capex.
- Climate carrying-cost: moderate flood risk; severe wind risk, 99% chance of damaging wind over 30y; moderate wildfire risk; extreme-heat days projected 7→21/yr by 2055 (HVAC capex compounding) — expect insurance premiums to compound above CPI over the hold.
Questions for the listing agent
- It's been on market 48 days. Have you received any prior offers? Is the seller open to a 3% concession, seller financing, or rate buy-down credit?
- Built in 1920 — when were the roof, HVAC, electrical panel, plumbing, and water heater last replaced?
- Is there a deadline driving the sale (1031 exchange, divorce, estate, relocation)? That informs how much negotiation room exists.
- Schools are D-rated, which usually means shorter tenancies and higher turnover. Who's the typical renter profile here, and what's been the actual vacancy rate?
- What's the average days-on-market for RENTAL listings here right now (not sales)? A rising rental-DOM trend means longer vacancies and softer asking-rent achievability than the comps imply.
- What's the recent tenant-quality profile in this submarket — average credit score on applications, eviction rate, late-payment / NSF rate, and stable-employment percentage? A property-management company in the area should have these aggregated.
- How much new for-sale + rental construction is in the pipeline within 1–3 miles? Heavy new supply typically softens prices + rents 12–24 months out; constrained supply supports both.
Investment metrics
- 1% rule
- 1.17% ✓
- Cap rate
- 9.84%
- Cash-on-cash
- 12.68%
- DSCR
- 1.56
- GRM
- 7.1
CMA / ARV
- ARV (on-the-fly)
- $160,650
- Comps found
- 3
Show comp detail 3 sales within ~0.75 mi
| Address | Dist | Beds/Ba | Sqft | Sold | Price | $/sf | Match |
|---|---|---|---|---|---|---|---|
| 1000 Church St | 0.17mi | 3/2.0 | 1,775 (-1%) | 16mo | $30,000 | $17 | 73 |
| 1011 Chickasaw Trl | 0.50mi | 4/2.0 (+1) | 1,688 (-5%) | 18mo | $178,000 | $105 | 44 |
| 936 Main St | 0.71mi | 3/1.5 | 2,045 (+15%) | 2mo | $183,500 | $90 | 39 |
Match score weights: distance 35% · size 25% · config 20% · recency 20%. Top-matched comps best support the ARV.
Projected returns pro-forma
-3.0% appreciation · 3.0% rent growth · sell at horizon
- IRR
- 2.4%
- Equity multiple
- 1.09×
- Total profit
- $3,007
- Equity at exit
- $17,147
- IRR
- 12.0%
- Equity multiple
- 1.94×
- Total profit
- $30,420
- Equity at exit
- $9,943
Cash invested: $32,200 (down + closing). Projections, not guarantees.
Landlord ↔ Tenant lean methodology
- Overall (STATE)
- 90 Strongly Landlord-Friendly
- State Mississippi
- 90 Strongly Landlord-Friendly · R+11
- County
- — inherits STATE
- City
- — inherits STATE
ZIP-level market 39429
- Active inventory
- 133
- Price-to-rent
- 7.1×
Monthly cashflow live
- Estimated rent
- $1,346 medium interval (Pro) →
- Mortgage (P&I)
- −$603
- Tax from tax record
- −$72 /mo · $862/yr
- Insurance
- −$48
- HOA
- −$0
- Vacancy / Maint / Mgmt
- −$283
- Net cashflow
- $340
Break-even live
Sensitivity live
| Price | -10% $405 | -5% $373 | +0% $340 | +5% $308 | +10% $275 |
|---|---|---|---|---|---|
| Rent | -10% $234 | -5% $287 | +0% $340 | +5% $393 | +10% $446 |
| Rate | -1.0pp $398 | -0.5pp $369 | base $340 | +0.5pp $310 | +1.0pp $280 |
UW: 25.0% down · 7.5% · 30yr · 1.5% tax · 5.0% vac · 8.0% maint · 8.0% mgmt
Financing live
Cash to close
- Down payment
- $28,750
- Closing costs
- $3,450
- Reserves months
- —
- Total cash needed
- —
Loan-product check · same deal, 3 products live
Conventional
25% down · 7.5% · 30yr
- Down + closing
- —
- Monthly P&I
- —
- Monthly cashflow
- —
- DSCR
- —
- Eligible?
- —
Personal DTI + credit; lowest rate.
DSCR
20% down · 8.5% · 30yr
- Down + closing
- —
- Monthly P&I
- —
- Monthly cashflow
- —
- DSCR
- —
- Eligible?
- —
No personal income docs; deal must DSCR.
Hard money
10% down · 12.0% · 12mo
- Down + closing
- —
- Monthly P&I
- —
- Monthly cashflow
- —
- DSCR
- —
- Eligible?
- —
Short-term bridge; refi at stabilization.
Listing history 13 events
-
2026-04-13status Pending
-
2026-03-23price $115,000
-
2026-03-11price $125,000
-
2026-02-24$130,000 Active
-
2025-04-01status Active
-
2025-01-01status Active
-
2024-10-22$7,250 Active
-
2024-06-11status Active
-
2024-06-11price $7,250
-
2024-03-11$9,500 Active
-
2022-02-13$13,500
-
2003-07-22soldstatus
-
2003-01-06$54,900
ⓘ Source: listings_history table (triggers on properties + properties_extension) + one-shot
backfill from property_details.listing_events for pre-trigger history.
Tax reassessment forecast MS · Resets to sale price
- Current annual tax
- $862 · $72/mo
- Projected year-2 tax
- $909 · $76/mo
- Expected delta
- +$47/yr (+$4/mo · 5.4%)
ⓘ Screening estimate from a state-policy table — verify with the county assessor before closing.
Climate risk First Street
- Flood 5/10 Major FEMA zone X (unshaded) · 65% chance over 30 yrs
- Wildfire 5/10 Major
- Heat 8/10 Severe 7 d/yr ≥111°F today · 21 d/yr by 30 yrs out
- Wind 8/10 Severe 99% chance of damaging wind over 30 yrs
- Air quality 1/10 Low 0 unhealthy d/yr today · 0 by 30 yrs out
Nearby sold comps map
Loading sold comps map…
Walkable amenities ~0.75 mi
Loading nearby amenities…
Taxation est. · year 1
- Rental income
- $16,147
- − Mortgage interest
- −$6,442
- − Property taxes
- −$862
- − Insurance
- −$575
- − Repairs & maintenance
- −$1,292
- − Management
- −$1,292
- − Depreciation
- −$3,345
- Taxable income
- $2,339
- Est. tax owed @ 24.0%
- −$561
- After-tax cash flow
- $3,521/yr
For passive investors: Depreciation is non-cash, so a rental often shows a tax loss while cash-flowing — sheltering income. Rental losses are passive: they offset passive income freely, and up to $25,000/yr can offset ordinary (W-2) income if you actively participate and your MAGI is under $100k (phasing out to $0 by $150k); unused losses carry forward. On sale, claimed depreciation is recaptured at up to 25%, and gains may owe capital-gains tax (a 1031 exchange can defer both). Figures are a year-1 estimate at your 24.0% rate — not tax advice; consult a CPA.
Schools (NCES district)
- District
- Columbia School District
- NCES district ID
- 2801170
- Math proficiency
- 39% ▼ -9.00%
- Reading proficiency
- 39% ▼ -3.00%
- Median HH income
- $31,192
- Composite
- 31.87/100
- National rank
- #5866
- State rank
- #45 of 130 in MS
Livability — Columbia
- Score
- 63/100
- State rank
- #154
- US rank
- #15293
Category grades
Schools grade is shown separately in the Schools card above.
Census & demographics
- Census place
- Columbia, MS
- Population (ZIP)
- 16,583
Population outlook (Marion County) Hauer SSP2
- Today (2025)
- 22,813 people
- By 2030
- 21,301 · -6.6%
- By 2040
- 18,176 · -20.3%
- By 2050
- 15,215 · -33.3%
- By 2075
- 9,388 · -58.8%
- By 2100
- 5,335 · -76.6%
Race, ethnicity, and origin ACS 2023
- Neighborhood character
- Majority White (62%)
- Race & ethnicity
- White 62% Black 34% Two or more races 2% Hispanic / Latino 1%
- Common ancestry
- Lithuanian 2% Serbian 1% Slovak 1%
- Foreign-born
- 1% · Canada
- Languages at home
- 98% English-only · Spanish 1%
Political lean MEDSL · Marion
- 2024 margin
- Solid R (+41.6) · D 28.7% · R 70.4%
- 2008→2024 swing
- -10.2pp toward R · 2008: -31.4pp · 2024: -41.6pp
- All cycles
- 2024: R+41.6 2020: R+36.8 2016: R+36.0 2012: R+29.8 2008: R+31.4
Not yet ingested
- Civics
- —
Market trends
- HPI YoY
- ▼ -88.11%
- Current HPI
- 132.3278
- Rent YoY
- —
- Metro
- —
- State GDP YoY
- —
- F500 in state
- 0
Price history
+109.5% since first listed13 events — show timeline
- 2026-04-13 Pending — MLSU
- 2026-03-23 Price Changed $115,000 MLSU
- 2026-03-11 Price Changed $125,000 MLSU
- 2026-02-24 Listed $130,000 MLSU
- 2025-04-01 Relisted — HAAR
- 2025-01-01 Relisted — HAAR
- 2024-10-22 Listed $7,250 HAAR
- 2024-06-11 Relisted — HAAR
- 2024-06-11 Price Changed $7,250 HAAR
- 2024-03-11 Listed $9,500 HAAR
- 2022-02-13 Listed $13,500 HAAR
- 2003-07-22 Sold (MLS) — HAAR
- 2003-01-06 Listed $54,900 HAAR
Property tax history
+4.2%/yrLatest (2023): $862 · +0.0% YoY. Source: county tax records.
Cash-flow waterfall
monthlySold comps — $/sqft
last 12 mo · ≤1 miLoading sold comps…