153 Lake View Dr · Bliss, NY
Flood risk 1/10 · Minimal
- FEMA flood zone
- X
- Chance of flooding over 30 yrs
- 0.0%
- Est. flood insurance / yr
- $507 – $1,088
Fire risk 1/10 · Minimal
- Est. fire insurance / yr
- $691 – $1,283
Heat risk 1/10 · Minimal
- Hot days now (above 89°F)
- 7 days/yr
- Hot days in 30 yrs
- 16 days/yr
Wind risk 1/10 · Minimal
- Chance of severe wind over 30 yrs
- —
Air-quality risk 2/10 · Minimal
- Unhealthy air days now
- 0 days/yr
- Unhealthy air days in 30 yrs
- 1 days/yr
Risk factors via First Street. Map © Google.
Why this score? — see what drove the B+ grade
The composite is a weighted blend of 9 inputs, each scored 0–100. Each bar is that input's sub-score; the figure is the points it added to the 100-point composite (weight × sub-score).
- Cash flow +30.0/30.0
- 1% rule +10.0/10.0
- DSCR +10.0/10.0
- Appreciation +7.8/10.0
- ARV discount +7.5/15.0
- Schools +4.4/10.0
- Livability +2.9/5.0
- Rent growth +2.5/5.0
- Condition / age +2.5/5.0
$32,000
🖨 Deal sheet (PDF) 📄 Offer letter ✓ Due diligence
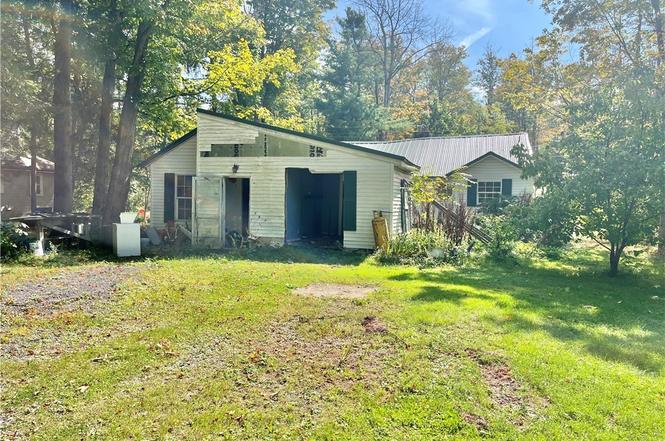
Listing remarks
Great location. Great rebuilding opportunity. Java Lake 2-bedroom cottage that needs extensive rehab, being sold "as is. " According to the Java Lake Colony Association deeded rules, cottages can be rebuilt if one original wall or the foundation remains. Please confirm this information before purchase. Included in the whole, three lots where the cottage sits (90' wide) and two lots across the private road (60' wide) with shed. Cottage has a stone woodburning fireplace. Metal roof and vinyl siding. Tools, personal and household items, propane tanks, etc. will be left in the cottage. "As is" property.
Key facts
- Metal roof
- Three lots
- Java lake cottage
Tags
Neighborhood map
What this means for you Summary
Snapshot
- This is a 2-bed/1.0-bath single-family listed at $32k.
Deal economics
- At list price, monthly cash flow is $635 ($8k/yr) — positive.
- The deal already cash-flows at list — no discount required.
- Meets the 1% rule at list price ($1k rent vs $32k).
- Recommended offer: $31k (3.0% below list) — sets the bar for market timing.
Location & tenants
- Location reads 58/100 on livability (#1,065 in NY) — a working-class tenant base; expect higher turnover. Strengths: cost of living A+, housing A+; Watch: schools F, crime F, amenities F.
- Yorkshire-Pioneer Central School District (town): math 50% / reading 54% proficiency, ranked #358 of 590 in NY (top 61%) — acceptable for families but not a draw, mixed tenant base, ~2y average lease.
- Market conditions: 39 active listings in the ZIP; 83 units permitted in Wyoming County in 2024 (0 in 5+ unit buildings).
Forward outlook
- In year one you build about $2k of equity ($221 loan paydown + $2k appreciation (5.7% local appreciation)).
- Wyoming County population projected at -16% by 2050 — secular population decline; favor cash flow + early exit over multi-decade hold.
- At projected returns (5.7% appreciation + 3.0% rent growth), your $9k cash investment doubles in ~1 year — after that, you're playing with house money.
Negotiation context
- It's been on market 41 days — a 3% lower offer ($31k) is reasonable based on typical stale-listing flexibility.
Risks & watch-outs
- Watch-outs: property tax is 4.8% of price; built in 1930 — expect roof / HVAC / electrical / plumbing capex.
Questions for the listing agent
- It's been on market 41 days. Have you received any prior offers? Is the seller open to a 3% concession, seller financing, or rate buy-down credit?
- Built in 1930 — when were the roof, HVAC, electrical panel, plumbing, and water heater last replaced?
- Property tax is high relative to price — has the assessment been appealed recently, and will the sale trigger a re-assessment?
- Is there a deadline driving the sale (1031 exchange, divorce, estate, relocation)? That informs how much negotiation room exists.
- Schools are F-rated, which usually means shorter tenancies and higher turnover. Who's the typical renter profile here, and what's been the actual vacancy rate?
- Crime grade is F in this area — have there been break-ins, vandalism, or insurance claims at this property in the last 3 years? What carrier currently insures it and at what premium?
- What's the average days-on-market for RENTAL listings here right now (not sales)? A rising rental-DOM trend means longer vacancies and softer asking-rent achievability than the comps imply.
- What's the recent tenant-quality profile in this submarket — average credit score on applications, eviction rate, late-payment / NSF rate, and stable-employment percentage? A property-management company in the area should have these aggregated.
- How much new for-sale + rental construction is in the pipeline within 1–3 miles? Heavy new supply typically softens prices + rents 12–24 months out; constrained supply supports both.
Investment metrics
- 1% rule
- 3.73% ✓
- Cap rate
- 30.09%
- Cash-on-cash
- 84.99%
- DSCR
- 4.78
- GRM
- 2.2
CMA / ARV
No comps found within radius.
Projected returns pro-forma
5.65% appreciation · 3.0% rent growth · sell at horizon
- IRR
- 91.3%
- Equity multiple
- 6.48×
- Total profit
- $49,063
- Equity at exit
- $19,410
- IRR
- 89.2%
- Equity multiple
- 13.61×
- Total profit
- $113,001
- Equity at exit
- $34,604
Cash invested: $8,960 (down + closing). Projections, not guarantees.
Landlord ↔ Tenant lean methodology
- Overall (STATE)
- 15 Strongly Tenant-Friendly
- State New York
- 15 Strongly Tenant-Friendly · D+10
- County
- — inherits STATE
- City
- — inherits STATE
ZIP-level market 14009
- Home prices YoY
- 2.0%
- Active inventory
- 39
- Price-to-rent
- 2.2×
Monthly cashflow live
- Estimated rent
- $1,193 medium interval (Pro) →
- Mortgage (P&I)
- −$168
- Tax from tax record
- −$127 /mo · $1,521/yr
- Insurance
- −$13
- HOA
- −$0
- Vacancy / Maint / Mgmt
- −$251
- Net cashflow
- $635
Break-even live
Sensitivity live
| Price | -10% $743 | -5% $732 | +0% $635 | +5% $626 | +10% $616 |
|---|---|---|---|---|---|
| Rent | -10% $540 | -5% $587 | +0% $635 | +5% $682 | +10% $729 |
| Rate | -1.0pp $651 | -0.5pp $643 | base $635 | +0.5pp $626 | +1.0pp $618 |
UW: 25.0% down · 7.5% · 30yr · 1.5% tax · 5.0% vac · 8.0% maint · 8.0% mgmt
Financing live
Cash to close
- Down payment
- $8,000
- Closing costs
- $960
- Reserves months
- —
- Total cash needed
- —
Loan-product check · same deal, 3 products live
Conventional
25% down · 7.5% · 30yr
- Down + closing
- —
- Monthly P&I
- —
- Monthly cashflow
- —
- DSCR
- —
- Eligible?
- —
Personal DTI + credit; lowest rate.
DSCR
20% down · 8.5% · 30yr
- Down + closing
- —
- Monthly P&I
- —
- Monthly cashflow
- —
- DSCR
- —
- Eligible?
- —
No personal income docs; deal must DSCR.
Hard money
10% down · 12.0% · 12mo
- Down + closing
- —
- Monthly P&I
- —
- Monthly cashflow
- —
- DSCR
- —
- Eligible?
- —
Short-term bridge; refi at stabilization.
Listing history 3 events
-
2025-10-29status Pending
-
2025-09-18$32,000 Active
-
2006-12-12soldstatus $45,000
ⓘ Source: listings_history table (triggers on properties + properties_extension) + one-shot
backfill from property_details.listing_events for pre-trigger history.
Tax reassessment forecast NY · Partial reset (capped growth)
- Current annual tax
- $1,521 · $127/mo
- Projected year-2 tax
- $1,521 · $127/mo
- Expected delta
- $0/yr ($0/mo · 0.0%)
ⓘ Screening estimate from a state-policy table — verify with the county assessor before closing.
Climate risk First Street
- Flood 1/10 Low FEMA zone X · 0% chance over 30 yrs
- Wildfire 1/10 Low
- Heat 1/10 Low 7 d/yr ≥89°F today · 16 d/yr by 30 yrs out
- Wind 1/10 Low
- Air quality 2/10 Low 0 unhealthy d/yr today · 1 by 30 yrs out
Nearby sold comps map
Loading sold comps map…
Walkable amenities ~0.75 mi
Loading nearby amenities…
Taxation est. · year 1
- Rental income
- $14,316
- − Mortgage interest
- −$1,792
- − Property taxes
- −$1,521
- − Insurance
- −$160
- − Repairs & maintenance
- −$1,145
- − Management
- −$1,145
- − Depreciation
- −$931
- Taxable income
- $7,621
- Est. tax owed @ 24.0%
- −$1,829
- After-tax cash flow
- $5,786/yr
For passive investors: Depreciation is non-cash, so a rental often shows a tax loss while cash-flowing — sheltering income. Rental losses are passive: they offset passive income freely, and up to $25,000/yr can offset ordinary (W-2) income if you actively participate and your MAGI is under $100k (phasing out to $0 by $150k); unused losses carry forward. On sale, claimed depreciation is recaptured at up to 25%, and gains may owe capital-gains tax (a 1031 exchange can defer both). Figures are a year-1 estimate at your 24.0% rate — not tax advice; consult a CPA.
Schools (NCES district)
- District
- Yorkshire-Pioneer Central School District
- NCES district ID
- 3608970
- Math proficiency
- 50% ▼ -17.00%
- Reading proficiency
- 54% ▼ -1.00%
- Median HH income
- $45,735
- Composite
- 44.02/100
- National rank
- #2885
- State rank
- #358 of 590 in NY
Livability — Bliss
- Score
- 58/100
- State rank
- #1065
- US rank
- #21289
Category grades
Schools grade is shown separately in the Schools card above.
Census & demographics
- City population
- 1,606
- Population (ZIP)
- 5,787
Population outlook (Wyoming County) Hauer SSP2
- Today (2025)
- 38,976 people
- By 2030
- 37,826 · -3.0%
- By 2040
- 35,585 · -8.7%
- By 2050
- 32,841 · -15.7%
- By 2075
- 25,920 · -33.5%
- By 2100
- 19,082 · -51.0%
Race, ethnicity, and origin ACS 2023
- Neighborhood character
- Predominantly White (94%)
- Race & ethnicity
- White 94% Two or more races 3% Asian 2%
- Common ancestry
- Romanian 9% Iranian 2% Subsaharan African 1%
- Foreign-born
- 2% · Canada
- Languages at home
- 96% English-only · Tagalog/Filipino 2% Other Asian/Pacific 1%
Political lean MEDSL · Wyoming
- 2024 margin
- Solid R (+48.2) · D 25.9% · R 74.1%
- 2008→2024 swing
- -22.1pp toward R · 2008: -26.1pp · 2024: -48.2pp
- All cycles
- 2024: R+48.2 2020: R+45.5 2016: R+51.0 2012: R+29.6 2008: R+26.1
Not yet ingested
- Civics
- —
Market trends
- HPI YoY
- ▲ 5.65%
- Current HPI
- 281.8451
- Rent YoY
- —
- Metro
- —
- State GDP YoY
- ▲ 2.60%
- F500 in state
- 92
Industry mix (Fortune 500 HQ in NY)
| Industry | F500 HQs | Revenue |
|---|---|---|
| Financial Services | 10 | $950B |
|
||
| Consumer Goods | 9 | $162B |
|
||
| Insurance | 4 | $225B |
|
||
| Telecommunications | 2 | $144B |
|
||
| Pharmaceuticals | 2 | $112B |
|
||
| Media / Entertainment | 2 | $69B |
|
||
Price history
-28.9% since first listed3 events — show timeline
- 2025-10-29 Pending — WNYREIS
- 2025-09-18 Listed $32,000 WNYREIS
- 2006-12-12 Sold (Public Records) $45,000 Public Records
Property tax history
+2.1%/yrLatest (2025): $1,521 · -1.1% YoY. Source: county tax records.
Cash-flow waterfall
monthlySold comps — $/sqft
last 12 mo · ≤1 miLoading sold comps…