3416 W Highway 274 · Hampton, AR
Flood risk 1/10 · Minimal
- FEMA flood zone
- —
- Chance of flooding over 30 yrs
- 0.0%
- Est. flood insurance / yr
- —
Fire risk 5/10 · Moderate
- Est. fire insurance / yr
- $1,499 – $2,785
Heat risk 6/10 · Moderate
- Hot days now (above 111°F)
- 7 days/yr
- Hot days in 30 yrs
- 20 days/yr
Wind risk 6/10 · Moderate
- Chance of severe wind over 30 yrs
- 27.0%
Air-quality risk 1/10 · Minimal
- Unhealthy air days now
- 0 days/yr
- Unhealthy air days in 30 yrs
- 0 days/yr
Risk factors via First Street. Map © Google.
Why this score? — see what drove the B grade
The composite is a weighted blend of 9 inputs, each scored 0–100. Each bar is that input's sub-score; the figure is the points it added to the 100-point composite (weight × sub-score).
- Cash flow +30.0/30.0
- 1% rule +10.0/10.0
- DSCR +10.0/10.0
- ARV discount +7.5/15.0
- Appreciation +5.0/10.0
- Livability +3.4/5.0
- Rent growth +2.5/5.0
- Condition / age +2.5/5.0
- Schools +1.9/10.0
$43,000
🖨 Deal sheet (PDF) 📄 Offer letter ✓ Due diligence
Listing remarks MLS
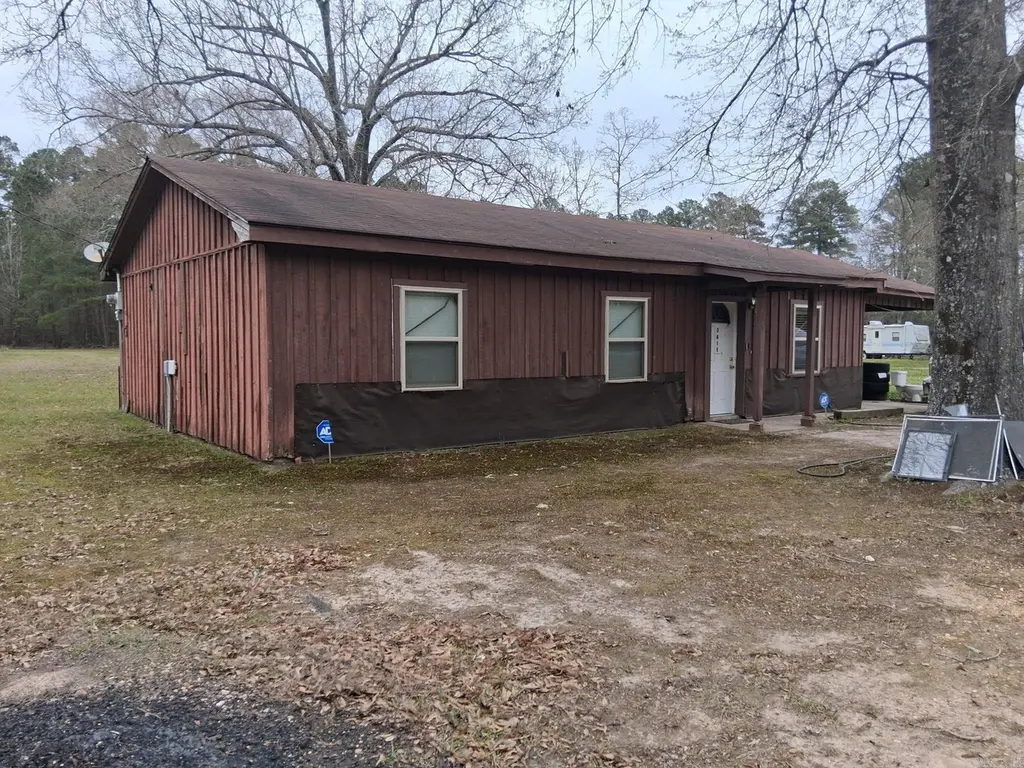
This 3-bedroom, 2-bathroom ranch-style home sits on nearly 1 acre in Hampton, AR. Built in 1997, this 1,092 sq ft home features hardwood and vinyl flooring, central heat and air, and a one-car carport. The property includes two detached storage buildings. Located in the Hampton School District, just 10 minutes from Hampton and 15 minutes from Highland Industrial Park. Some remodeling started great opportunity for investors or buyers wanting to add value. Call today!
Key facts
- 0.99 acre lot
- Built 1997
- Listed 62 days
Tags
Neighborhood map
What this means for you Summary
Snapshot
- This is a 3-bed/1.5-bath single-family listed at $43k.
Deal economics
- At list price, monthly cash flow is $514 ($6k/yr) — positive.
- The deal already cash-flows at list — no discount required.
- Meets the 1% rule at list price ($1k rent vs $43k).
- Recommended offer: $40k (6.0% below list) — sets the bar for market timing.
Location & tenants
- Location reads 68/100 on livability (#87 in AR) — a middle-class / working-renter tenant base. Strengths: cost of living A+, housing A+, health & safety A+; Watch: employment D+, schools F, crime D-.
- Hampton School District (rural): math 20% / reading 25% proficiency, ranked #205 of 238 in AR (top 86%) — low school quality limits family demand, transient renter base, plan for 1-2y turnover.
- Market conditions: 15 active listings in the ZIP.
Forward outlook
- In year one you build about $2k of equity ($297 loan paydown + $1k appreciation (3.0% local appreciation)).
- Calhoun County population projected at -20% by 2050 — secular population decline; favor cash flow + early exit over multi-decade hold.
- At projected returns (3.0% appreciation + 3.0% rent growth), your $12k cash investment doubles in ~2 years — after that, you're playing with house money.
Negotiation context
- It's been on market 63 days — a 6% lower offer ($40k) is reasonable based on typical stale-listing flexibility.
- Current owner paid $33k; 30% above their basis — modest negotiation headroom, anchor on the comps not their cost.
Risks & watch-outs
- Climate carrying-cost: major wind risk, 27% chance of damaging wind over 30y; moderate wildfire risk; extreme-heat days projected 7→20/yr by 2055 (HVAC capex compounding) — expect insurance premiums to compound above CPI over the hold.
Questions for the listing agent
- It's been on market 63 days. Have you received any prior offers? Is the seller open to a 6% concession, seller financing, or rate buy-down credit?
- Why hasn't it sold? Are there any deal-killer items the seller is aware of (foundation, flood, title, zoning, code violations)?
- Is there a deadline driving the sale (1031 exchange, divorce, estate, relocation)? That informs how much negotiation room exists.
- Schools are F-rated, which usually means shorter tenancies and higher turnover. Who's the typical renter profile here, and what's been the actual vacancy rate?
- Crime grade is D in this area — have there been break-ins, vandalism, or insurance claims at this property in the last 3 years? What carrier currently insures it and at what premium?
- What's the average days-on-market for RENTAL listings here right now (not sales)? A rising rental-DOM trend means longer vacancies and softer asking-rent achievability than the comps imply.
- What's the recent tenant-quality profile in this submarket — average credit score on applications, eviction rate, late-payment / NSF rate, and stable-employment percentage? A property-management company in the area should have these aggregated.
- How much new for-sale + rental construction is in the pipeline within 1–3 miles? Heavy new supply typically softens prices + rents 12–24 months out; constrained supply supports both.
Investment metrics
- 1% rule
- 2.39% ✓
- Cap rate
- 20.63%
- Cash-on-cash
- 51.19%
- DSCR
- 3.28
- GRM
- 3.5
CMA / ARV
No comps found within radius.
Projected returns pro-forma
3.0% appreciation · 3.0% rent growth · sell at horizon
- IRR
- 56.3%
- Equity multiple
- 4.15×
- Total profit
- $37,909
- Equity at exit
- $19,335
- IRR
- 55.9%
- Equity multiple
- 8.40×
- Total profit
- $89,134
- Equity at exit
- $29,797
Cash invested: $12,040 (down + closing). Projections, not guarantees.
Landlord ↔ Tenant lean methodology
- Overall (STATE)
- 92 Strongly Landlord-Friendly
- State Arkansas
- 92 Strongly Landlord-Friendly · R+14
- County
- — inherits STATE
- City
- — inherits STATE
ZIP-level market 71744
- Active inventory
- 15
- Price-to-rent
- 3.5×
Monthly cashflow live
- Estimated rent
- $1,026 medium interval (Pro) →
- Mortgage (P&I)
- −$225
- Tax est. 1.5%
- −$54 /mo · $645/yr
- Insurance
- −$18
- HOA
- −$0
- Vacancy / Maint / Mgmt
- −$216
- Net cashflow
- $514
Break-even live
Sensitivity live
| Price | -10% $543 | -5% $528 | +0% $514 | +5% $499 | +10% $484 |
|---|---|---|---|---|---|
| Rent | -10% $433 | -5% $473 | +0% $514 | +5% $554 | +10% $595 |
| Rate | -1.0pp $535 | -0.5pp $525 | base $514 | +0.5pp $502 | +1.0pp $491 |
UW: 25.0% down · 7.5% · 30yr · 1.5% tax · 5.0% vac · 8.0% maint · 8.0% mgmt
Financing live
Cash to close
- Down payment
- $10,750
- Closing costs
- $1,290
- Reserves months
- —
- Total cash needed
- —
Loan-product check · same deal, 3 products live
Conventional
25% down · 7.5% · 30yr
- Down + closing
- —
- Monthly P&I
- —
- Monthly cashflow
- —
- DSCR
- —
- Eligible?
- —
Personal DTI + credit; lowest rate.
DSCR
20% down · 8.5% · 30yr
- Down + closing
- —
- Monthly P&I
- —
- Monthly cashflow
- —
- DSCR
- —
- Eligible?
- —
No personal income docs; deal must DSCR.
Hard money
10% down · 12.0% · 12mo
- Down + closing
- —
- Monthly P&I
- —
- Monthly cashflow
- —
- DSCR
- —
- Eligible?
- —
Short-term bridge; refi at stabilization.
Listing history 18 events
-
2026-06-19days on market $43,000 Active 63 DOM
-
2026-06-18days on market $43,000 Active 62 DOM
-
2026-06-17days on market $43,000 Active 61 DOM
-
2026-06-16days on market $43,000 Active 60 DOM
-
2026-06-15days on market $43,000 Active 59 DOM
-
2026-06-14days on market $43,000 Active 57 DOM
-
2026-06-12days on market $43,000 Active 56 DOM
-
2026-06-09days on market $43,000 Active 53 DOM
-
2026-06-08days on market $43,000 Active 52 DOM
-
2026-06-07statusdays on market $43,000 Active 51 DOM
-
2026-06-05days on market $43,000 Price Change 49 DOM
-
2026-06-04days on market $43,000 Price Change 47 DOM
-
2026-06-02days on market $43,000 Price Change 46 DOM
-
2026-06-01days on market $43,000 Price Change 45 DOM
-
2026-05-31days on market $43,000 Price Change 44 DOM
-
2026-05-31pricestatusdays on market $43,000 Price Change 43 DOM
-
2026-04-17$69,900 New Listing 470-char remark
Show marketing remark (470 chars)
This 3-bedroom, 2-bathroom ranch-style home sits on nearly 1 acre in Hampton, AR. Built in 1997, this 1,092 sq ft home features hardwood and vinyl flooring, central heat and air, and a one-car carport. The property includes two detached storage buildings. Located in the Hampton School District, just 10 minutes from Hampton and 15 minutes from Highland Industrial Park. Some remodeling started great opportunity for investors or buyers wanting to add value. Call today!
-
1999-06-15soldstatus $33,000
ⓘ Source: listings_history table (triggers on properties + properties_extension) + one-shot
backfill from property_details.listing_events for pre-trigger history.
Climate risk First Street
- Flood 1/10 Low 0% chance over 30 yrs
- Wildfire 5/10 Major
- Heat 6/10 Major 7 d/yr ≥111°F today · 20 d/yr by 30 yrs out
- Wind 6/10 Major 27% chance of damaging wind over 30 yrs
- Air quality 1/10 Low 0 unhealthy d/yr today · 0 by 30 yrs out
Nearby sold comps map
Loading sold comps map…
Walkable amenities ~0.75 mi
Loading nearby amenities…
Taxation est. · year 1
- Rental income
- $12,316
- − Mortgage interest
- −$2,409
- − Property taxes
- −$645
- − Insurance
- −$215
- − Repairs & maintenance
- −$985
- − Management
- −$985
- − Depreciation
- −$1,251
- Taxable income
- $5,826
- Est. tax owed @ 24.0%
- −$1,398
- After-tax cash flow
- $4,765/yr
For passive investors: Depreciation is non-cash, so a rental often shows a tax loss while cash-flowing — sheltering income. Rental losses are passive: they offset passive income freely, and up to $25,000/yr can offset ordinary (W-2) income if you actively participate and your MAGI is under $100k (phasing out to $0 by $150k); unused losses carry forward. On sale, claimed depreciation is recaptured at up to 25%, and gains may owe capital-gains tax (a 1031 exchange can defer both). Figures are a year-1 estimate at your 24.0% rate — not tax advice; consult a CPA.
Schools (NCES district)
- District
- Hampton School District
- NCES district ID
- 0507230
- Math proficiency
- 20% ▼ -9.00%
- Reading proficiency
- 25% ▼ -5.00%
- Median HH income
- $35,288
- Composite
- 18.57/100
- National rank
- #8909
- State rank
- #205 of 238 in AR
Livability — Hampton
- Score
- 68/100
- State rank
- #87
- US rank
- #9720
Category grades
Schools grade is shown separately in the Schools card above.
Census & demographics
- Population (ZIP)
- 2,961
Population outlook (Calhoun County) Hauer SSP2
- Today (2025)
- 4,921 people
- By 2030
- 4,726 · -4.0%
- By 2040
- 4,314 · -12.3%
- By 2050
- 3,912 · -20.5%
- By 2075
- 3,300 · -32.9%
- By 2100
- 2,891 · -41.3%
Race, ethnicity, and origin ACS 2023
- Neighborhood character
- Predominantly White (82%)
- Race & ethnicity
- White 82% Black 9% Two or more races 5% Hispanic / Latino 4%
- Common ancestry
- Serbian 1%
- Foreign-born
- 1% · Canada
- Languages at home
- 99% English-only · Spanish 1%
Political lean MEDSL · Calhoun
- 2024 margin
- Solid R (+61.9) · D 18.1% · R 80.0% · Other 1.9%
- 2008→2024 swing
- -27.1pp toward R · 2008: -34.8pp · 2024: -61.9pp
- All cycles
- 2024: R+61.9 2020: R+53.0 2016: R+40.8 2012: R+36.7 2008: R+34.8
Not yet ingested
- Civics
- —
Market trends
- HPI YoY
- —
- Current HPI
- —
- Rent YoY
- —
- Metro
- —
- State GDP YoY
- ▲ 3.80%
- F500 in state
- 10
Industry mix (Fortune 500 HQ in AR)
| Industry | F500 HQs | Revenue |
|---|---|---|
| Retail | 1 | $681B |
|
||
| Food / Agriculture | 1 | $53B |
|
||
| Retail / Energy | 1 | $22B |
|
||
| Transportation / Logistics | 1 | $12B |
|
||
| Energy | 1 | $4B |
|
||
Price history
+111.8% since first listed2 events — show timeline
- 2026-04-17 Listed $69,900 CARMLS
- 1999-06-15 Sold (Public Records) $33,000 Public Records
Property tax history
-17.9%/yrLatest (2023): $46 · +0.0% YoY. Source: county tax records.
Cash-flow waterfall
monthlySold comps — $/sqft
last 12 mo · ≤1 miLoading sold comps…