1319 N Mulberry St · Mount Carmel, IL
Flood risk 1/10 · Minimal
- FEMA flood zone
- X (unshaded)
- Chance of flooding over 30 yrs
- 0.0%
- Est. flood insurance / yr
- $473 – $860
Fire risk 1/10 · Minimal
- Est. fire insurance / yr
- $804 – $1,492
Heat risk 4/10 · Minor
- Hot days now (above 107°F)
- 7 days/yr
- Hot days in 30 yrs
- 19 days/yr
Wind risk 2/10 · Minimal
- Chance of severe wind over 30 yrs
- 3.0%
Air-quality risk 2/10 · Minimal
- Unhealthy air days now
- 1 days/yr
- Unhealthy air days in 30 yrs
- 2 days/yr
Risk factors via First Street. Map © Google.
Why this score? — see what drove the D grade
The composite is a weighted blend of 9 inputs, each scored 0–100. Each bar is that input's sub-score; the figure is the points it added to the 100-point composite (weight × sub-score).
- Appreciation +10.0/10.0
- Cash flow +8.2/30.0
- ARV discount +7.5/15.0
- Livability +3.2/5.0
- 1% rule +2.7/10.0
- Rent growth +2.5/5.0
- Condition / age +2.5/5.0
- DSCR +2.2/10.0
- Schools +1.5/10.0
$152,500
🖨 Deal sheet 📄 Offer letter ✓ Due diligence
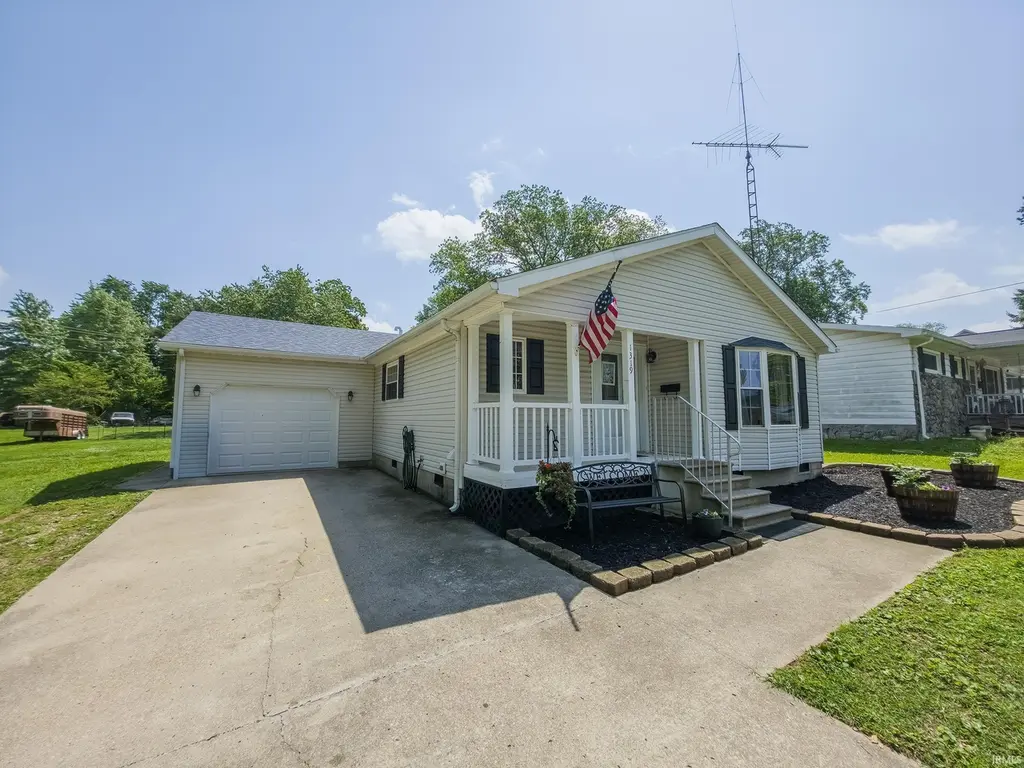
Listing remarks
Beautifully remodeled 3 bedroom, 2 bath home offering modern updates and plenty of space inside and out! Situated on over a half acre lot, this move-in ready property features all new flooring throughout, a spacious updated kitchen with a large island bar, remodeled bathrooms, and generously sized bedrooms with large closets. The inviting living area is highlighted by a stunning stone gas fireplace, creating the perfect gathering space. Recent major updates include new furnace and central air, and new water heater for added peace of mind. Enjoy relaxing on the covered front porch or entertaining on the back patio. Attached 1-car garage and spacious yard complete this impressive property.
Key facts
- Covered front porch
- Remodeled
- Modern updates
Tags
Property features AI
Finance
- Other: Directions: From Market St/IL-1, go east on 13th St, then north on Mulberry St. Property located on the right.
- Financial info: Tax amount provided but excluded per guidelines
- HOA & community: HOA information not provided
Exterior
- Parking: Attached garage (1 car)
- Security: Security features not provided
- Utilities: Public water; Public sewer
- Home design: Manufactured single-story home; Residential property
- Construction: Vinyl siding; Shallow crawl space foundation; Built details not provided
- Exterior features: Lot approximately 0.611 acre; Lot dimensions about 135 x 197; Other lot features
Interior
- Kitchen: Kitchen details not provided
- Bedrooms: Bedrooms information not provided
- Flooring: Flooring details not provided
- Bathrooms: 2 full bathrooms (both on the main level)
- Heating & cooling: Central air conditioning
- Interior features: Fireplace in the living room; Crawl space basement (no finished basement)
- Laundry & utility: Main-level laundry
Neighborhood map
What this means for you Summary
Snapshot
- This is a 3-bed/2.0-bath other listed at $152k.
Deal economics
- At list price, monthly cash flow is $-145 ($-2k/yr) — negative.
- To cash-flow at today's rent, offer at most $127k (16.8% below list).
- To meet the 1% rule (rent ≥ 1% of price), the offer needs to be $118k (22.9% below list).
- Recommended offer: $118k (22.9% below list) — sets the bar for 1% rule.
Location & tenants
- Location reads 64/100 on livability (#700 in IL) — a middle-class / working-renter tenant base. Strengths: crime A+, cost of living A+, housing A; Watch: amenities F, commute F, employment D-.
- Wabash CUSD 348 (town): math 14% / reading 20% proficiency, ranked #478 of 620 in IL (top 77%) — low school quality limits family demand, transient renter base, plan for 1-2y turnover.
- Zoned schools: Mt Carmel Grade School (math 13% / reading 14%, grade F, #1,354 of 2,056 statewide, top 66%, 395 students, 0% FRL); Mt Carmel Junior High School (math 12% / reading 32%, grade F, #389 of 665 statewide, top 60%, 202 students, 0% FRL) — zoned schools average 0% FRL vs 41% district-wide (41 pts lower); this property's tenant base skews higher-income than the district average.
- Market conditions: 18 active listings in the ZIP; 2 units permitted in Wabash County in 2024 (0 in 5+ unit buildings).
Forward outlook
- In year one you build about $16k of equity ($1k loan paydown + $15k appreciation (10.0% local appreciation)).
- Wabash County population projected at -23% by 2050 — secular population decline; favor cash flow + early exit over multi-decade hold.
- By year 3, paydown + projected appreciation supports a ~$41k cash-out refi (75% LTV) — recoverable capital for the next deal without selling this one.
Negotiation context
- Only 5 days on market — expect competitive offers; lowballing is unlikely to land.
- Current owner paid $98k; list at $152k implies a 56% gain — meaningful room to come down on a strong offer.
Questions for the listing agent
- What do current leases actually rent for vs. the listed asking? Can we see a recent rent roll and the last 12 months of T-12 income?
- Is there a deadline driving the sale (1031 exchange, divorce, estate, relocation)? That informs how much negotiation room exists.
- Schools are F-rated, which usually means shorter tenancies and higher turnover. Who's the typical renter profile here, and what's been the actual vacancy rate?
- The area grade is low — what's the realistic commute time and amenity access for the typical tenant pool here? Any planned neighborhood developments (good or bad) we should know about?
- What's the average days-on-market for RENTAL listings here right now (not sales)? A rising rental-DOM trend means longer vacancies and softer asking-rent achievability than the comps imply.
- What's the recent tenant-quality profile in this submarket — average credit score on applications, eviction rate, late-payment / NSF rate, and stable-employment percentage? A property-management company in the area should have these aggregated.
- How much new for-sale + rental construction is in the pipeline within 1–3 miles? Heavy new supply typically softens prices + rents 12–24 months out; constrained supply supports both.
Investment metrics
- 1% rule
- 0.77% ✗
- Cap rate
- 5.15%
- Cash-on-cash
- -4.09%
- DSCR
- 0.82
- GRM
- 10.8
CMA / ARV
No comps found within radius.
Projected returns pro-forma
10.0% appreciation · 3.0% rent growth · sell at horizon
- IRR
- 21.4%
- Equity multiple
- 2.73×
- Total profit
- $73,821
- Equity at exit
- $137,384
- IRR
- 19.3%
- Equity multiple
- 6.26×
- Total profit
- $224,736
- Equity at exit
- $296,274
Cash invested: $42,700 (down + closing). Projections, not guarantees.
Landlord ↔ Tenant lean methodology
- Overall (STATE)
- 43 Moderately Tenant-Leaning
- State Illinois
- 43 Moderately Tenant-Leaning · D+7
- County
- — inherits STATE
- City
- — inherits STATE
ZIP-level market 62863
- Home prices YoY
- 10.9%
- Active inventory
- 18
- Price-to-rent
- 10.8×
Monthly cashflow live
- Estimated rent
- $1,175 medium interval (Pro) →
- Mortgage (P&I)
- −$800
- Tax from tax record
- −$211 /mo · $2,528/yr
- Insurance
- −$64
- HOA
- −$0
- Vacancy / Maint / Mgmt
- −$247
- Net cashflow
- $-145
Break-even live
UW: 25.0% down · 7.5% · 30yr · 1.5% tax · 5.0% vac · 8.0% maint · 8.0% mgmt
Financing live
Cash to close
- Down payment
- $38,125
- Closing costs
- $4,575
- Reserves months
- —
- Total cash needed
- —
Loan-product check · same deal, 3 products live
Conventional
25% down · 7.5% · 30yr
- Down + closing
- —
- Monthly P&I
- —
- Monthly cashflow
- —
- DSCR
- —
- Eligible?
- —
Personal DTI + credit; lowest rate.
DSCR
20% down · 8.5% · 30yr
- Down + closing
- —
- Monthly P&I
- —
- Monthly cashflow
- —
- DSCR
- —
- Eligible?
- —
No personal income docs; deal must DSCR.
Hard money
10% down · 12.0% · 12mo
- Down + closing
- —
- Monthly P&I
- —
- Monthly cashflow
- —
- DSCR
- —
- Eligible?
- —
Short-term bridge; refi at stabilization.
Listing history 2 events
-
2026-05-20$152,500 Active
-
2007-01-16soldstatus $98,000
ⓘ Source: listings_history table (triggers on properties + properties_extension) + one-shot
backfill from property_details.listing_events for pre-trigger history.
Tax reassessment forecast IL · Partial reset (capped growth)
- Current annual tax
- $2,528 · $211/mo
- Projected year-2 tax
- $2,995 · $250/mo
- Expected delta
- +$467/yr (+$39/mo · 18.5%)
ⓘ Screening estimate from a state-policy table — verify with the county assessor before closing.
Climate risk First Street
- Flood 1/10 Low FEMA zone X (unshaded) · 0% chance over 30 yrs
- Wildfire 1/10 Low
- Heat 4/10 Moderate 7 d/yr ≥107°F today · 19 d/yr by 30 yrs out
- Wind 2/10 Low 3% chance of damaging wind over 30 yrs
- Air quality 2/10 Low 1 unhealthy d/yr today · 2 by 30 yrs out
Nearby sold comps map
Loading sold comps map…
Walkable amenities ~0.75 mi
Loading nearby amenities…
Taxation est. · year 1
- Rental income
- $14,103
- − Mortgage interest
- −$8,542
- − Property taxes
- −$2,528
- − Insurance
- −$762
- − Repairs & maintenance
- −$1,128
- − Management
- −$1,128
- − Depreciation
- −$4,436
- Taxable loss
- −$4,422
- Est. tax savings @ 24.0%
- +$1,061
- After-tax cash flow
- $-684/yr
For passive investors: Depreciation is non-cash, so a rental often shows a tax loss while cash-flowing — sheltering income. Rental losses are passive: they offset passive income freely, and up to $25,000/yr can offset ordinary (W-2) income if you actively participate and your MAGI is under $100k (phasing out to $0 by $150k); unused losses carry forward. On sale, claimed depreciation is recaptured at up to 25%, and gains may owe capital-gains tax (a 1031 exchange can defer both). Figures are a year-1 estimate at your 24.0% rate — not tax advice; consult a CPA.
Schools (NCES district)
- District
- Wabash CUSD 348
- NCES district ID
- 1740470
- Math proficiency
- 14% ▼ -12.00%
- Reading proficiency
- 20% ▼ -20.00%
- Median HH income
- $45,869
- Composite
- 15.01/100
- National rank
- #9359
- State rank
- #478 of 620 in IL
Livability — Mount Carmel
- Score
- 64/100
- State rank
- #700
- US rank
- #14280
Category grades
Schools grade is shown separately in the Schools card above.
Census & demographics
- Census place
- Mount Carmel, IL
- Population (ZIP)
- 9,438
Population outlook (Wabash County) Hauer SSP2
- Today (2025)
- 10,660 people
- By 2030
- 10,134 · -4.9%
- By 2040
- 9,122 · -14.4%
- By 2050
- 8,212 · -23.0%
- By 2075
- 6,435 · -39.6%
- By 2100
- 4,890 · -54.1%
Race, ethnicity, and origin ACS 2023
- Neighborhood character
- Predominantly White (94%)
- Race & ethnicity
- White 94% Two or more races 3% Hispanic / Latino 2% Asian 1% Black 1%
- Common ancestry
- Lithuanian 2% Slovak 2% Italian 2%
- Foreign-born
- 2% · South Korea, Canada
- Languages at home
- 97% English-only · Spanish 2% Korean 1%
Political lean MEDSL · Wabash
- 2024 margin
- Solid R (+53.8) · D 22.3% · R 76.2% · Other 1.5%
- 2008→2024 swing
- -40.1pp toward R · 2008: -13.7pp · 2024: -53.8pp
- All cycles
- 2024: R+53.8 2020: R+53.2 2016: R+53.6 2012: R+36.8 2008: R+13.7
Not yet ingested
- Civics
- —
Market trends
- HPI YoY
- ▲ 27.59%
- Current HPI
- 280.61
- Rent YoY
- —
- Metro
- —
- State GDP YoY
- ▲ 1.59%
- F500 in state
- 60
Industry mix (Fortune 500 HQ in IL)
| Industry | F500 HQs | Revenue |
|---|---|---|
| Insurance | 4 | $201B |
|
||
| Consumer Goods | 4 | $87B |
|
||
| Industrial Machinery | 3 | $64B |
|
||
| Healthcare | 2 | $55B |
|
||
| Retail / Pharmacy | 1 | $148B |
|
||
| Agriculture / Food | 1 | $86B |
|
||
Price history
+55.6% since first listed2 events — show timeline
- 2026-05-20 Listed $152,500 IRMLS
- 2007-01-16 Sold (Public Records) $98,000 Public Records
Property tax history
+3.4%/yrLatest (2025): $2,528 · +25.3% YoY. Source: county tax records.
Cash-flow waterfall
monthlySold comps — $/sqft
last 12 mo · ≤1 miLoading sold comps…