 Duplex
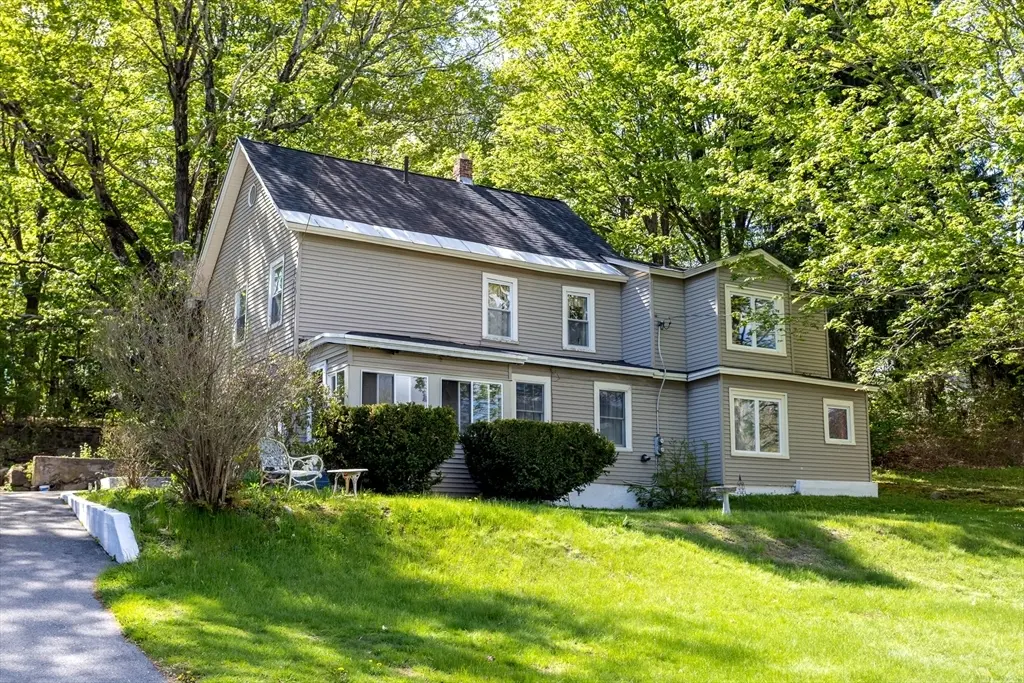
102 Summer St · Athol, MA
Flood risk 1/10 · Minimal
- FEMA flood zone
- —
- Chance of flooding over 30 yrs
- 0.0%
- Est. flood insurance / yr
- —
Fire risk 3/10 · Minor
- Est. fire insurance / yr
- $915 – $1,699
Heat risk 3/10 · Minor
- Hot days now (above 92°F)
- 7 days/yr
- Hot days in 30 yrs
- 17 days/yr
Wind risk 4/10 · Minor
- Chance of severe wind over 30 yrs
- 18.0%
Air-quality risk 2/10 · Minimal
- Unhealthy air days now
- 1 days/yr
- Unhealthy air days in 30 yrs
- 1 days/yr
Risk factors via First Street. Map © Google.
Why this score? — see what drove the B- grade
The composite is a weighted blend of 9 inputs, each scored 0–100. Each bar is that input's sub-score; the figure is the points it added to the 100-point composite (weight × sub-score).
- Cash flow +30.0/30.0
- DSCR +10.0/10.0
- 1% rule +8.1/10.0
- ARV discount +6.1/15.0
- Livability +3.7/5.0
- Rent growth +2.5/5.0
- Condition / age +2.5/5.0
- Schools +2.4/10.0
- Appreciation +0.0/10.0
$299,900
🖨 Deal sheet (PDF) 📄 Offer letter ✓ Due diligence
Multi-family units
County records classify this as Multi-Family (2-4 Unit). Listing-text estimate: 2 units. confirmed
Listing remarks MLS
GREAT PROPERTY WITH MANY OPTIONS. 1ST FLR HAS NEW KITCHEN, NEW DINING RM AND NEW FULL BATH. A NEW OFFICE SPACE CAN GO WITH EITHER 1ST OR 2ND FLOOR. POSSIBLY ENOUGH LAND FOR AN ADD'L BUILDING LOT. HOME COULD BE USED AS A SINGLE FAMILY.
Key facts
- Hardwood flooring
- 2 family home
- Accessible attic
Tags
Property features AI
Finance
- Other: Property includes two units (each with one level); Unit 1 and Unit 2 are not leased; Total building area approximately 2,242
- HOA & community: Community offers access to public transportation, shopping, parks, walk/jog trails, medical facility, laundromat, conservation area, highway access, houses of worship, and public school
Exterior
- Parking: Paved off-street parking; Open parking for 6 vehicles
- Utilities: Public water; Public sewer; 100 amp electric service with circuit breakers; Electric hookups for range, oven, and dryer
- Home design: 2-family, up/down configuration; 2 stories
- Construction: Frame construction; Stone and brick/mortar foundation; Shingle roof; Tan exterior color; Built year: unknown/mixed
- Exterior features: Enclosed porch; Stone wall; Cleared, sloped lot; Paved public road frontage; Public maintained road
Interior
- Kitchen: Range; Dishwasher; Microwave; Refrigerator
- Flooring: Wood; Vinyl; Hardwood
- Bathrooms: 2 full bathrooms
- Heating & cooling: Baseboard heating (oil); Heating present; No central cooling
- Interior features: Total of 10 rooms; Bathroom with shower stall; Living room; Dining room; Kitchen; Storm door(s); Insulated windows; Internet available (broadband)
- Laundry & utility: Washer hookup; Electric dryer hookup
Neighborhood map
What this means for you Summary
Snapshot
- This is a 2 × 2-bed/1.0-bath units multifamily listed at $300k.
Deal economics
- At list price, monthly cash flow is $1k ($14k/yr) — positive. Per door: $577/mo.
- The deal already cash-flows at list — no discount required.
- Meets the 1% rule at list price ($4k rent vs $300k).
- Recommended offer: $295k (1.5% below list) — sets the bar for market timing.
- Cap rate 10.9% vs local median 4.0% in Athol — top-decile yield for the area; either an underpriced asset or a hidden risk that comps aren't pricing in. Stress-test before assuming the spread holds.
Location & tenants
- Location reads 74/100 on livability (#84 in MA, #4,383 nationally) — a middle-class / working-renter tenant base. Strengths: housing A+, health & safety A+, cost of living A-; Watch: employment D, schools F, amenities F.
- Athol-Royalston (town): math 22% / reading 33% proficiency, ranked #265 of 302 in MA (top 88%) — low school quality limits family demand, transient renter base, plan for 1-2y turnover.
- Market conditions: 46 active listings in the ZIP; 4 comparable units currently listed for rent nearby; rentals at typical pace (median 15d on market — plan ~3-4 weeks tenant-placement turnaround); 2,293 units permitted in Worcester County in 2024 (1,205 in 5+ unit buildings).
Forward outlook
- Local home prices are declining (-3.0%/yr); year-one equity from $2k of loan paydown is wiped out by about $9k of value loss. Plan a longer hold.
- At projected returns (-3.0% appreciation + 3.0% rent growth), your $84k cash investment doubles in ~8 years — after that, you're playing with house money.
Negotiation context
- It's been on market 29 days — a 2% lower offer ($295k) is reasonable based on typical stale-listing flexibility.
- 3 sale attempts since 24y ago with the ask held roughly flat each time — persistent listings suggest the price (not the market) is what's stuck; bring a comps-based counter.
- Current owner paid $143k; list at $300k implies a 110% gain — meaningful room to come down on a strong offer.
Risks & watch-outs
- Watch-outs: built in 1900 — expect roof / HVAC / electrical / plumbing capex.
Questions for the listing agent
- Can we see the unit-by-unit rent roll, current vacancy, and any below-market leases? What's the average tenancy length?
- What capital expenditures (roof, boiler, parking lot, exteriors) have been made in the last 5 years, and what's planned in the next 2?
- Built in 1900 — when were the roof, HVAC, electrical panel, plumbing, and water heater last replaced?
- Is there a deadline driving the sale (1031 exchange, divorce, estate, relocation)? That informs how much negotiation room exists.
- Schools are F-rated, which usually means shorter tenancies and higher turnover. Who's the typical renter profile here, and what's been the actual vacancy rate?
- What's the average days-on-market for RENTAL listings here right now (not sales)? A rising rental-DOM trend means longer vacancies and softer asking-rent achievability than the comps imply.
- What's the recent tenant-quality profile in this submarket — average credit score on applications, eviction rate, late-payment / NSF rate, and stable-employment percentage? A property-management company in the area should have these aggregated.
- How much new apartment / multifamily construction is in the pipeline within 1–3 miles? Heavy new supply (>2% of stock underway) typically softens rents 12–24 months out; light construction supports rent growth.
Investment metrics
- 1% rule
- 1.31% ✓
- Cap rate
- 10.91%
- Cash-on-cash
- 16.49%
- DSCR
- 1.73
- GRM
- 6.4
CMA / ARV
- ARV (median comp)
- $291,040
- List price
- $299,900
- Delta
- 3.04%
- Verdict
- FAIR
- Comps
- 20 within 1.0 mi
Show comp detail 1 sale within ~0.75 mi
| Address | Dist | Beds/Ba | Sqft | Sold | Price | $/sf | Match |
|---|---|---|---|---|---|---|---|
| 42 Prospect St | 0.70mi | 4/2.0 | 2,082 (-7%) | 3mo | $365,000 | $175 | 53 |
Match score weights: distance 35% · size 25% · config 20% · recency 20%. Top-matched comps best support the ARV.
Projected returns pro-forma
-3.0% appreciation · 3.0% rent growth · sell at horizon
- IRR
- 7.6%
- Equity multiple
- 1.30×
- Total profit
- $24,882
- Equity at exit
- $44,716
- IRR
- 16.9%
- Equity multiple
- 2.38×
- Total profit
- $116,244
- Equity at exit
- $25,930
Cash invested: $83,972 (down + closing). Projections, not guarantees.
Landlord ↔ Tenant lean methodology
- Overall (STATE)
- 20 Strongly Tenant-Friendly
- State Massachusetts
- 20 Strongly Tenant-Friendly · D+15
- County
- — inherits STATE
- City
- — inherits STATE
ZIP-level market 01331
- Home prices YoY
- -9.9%
- Active inventory
- 46
- Price-to-rent
- 12.7×
Monthly cashflow live
- Estimated rent
- $3,933 high interval (Pro) →
- Mortgage (P&I)
- −$1,573
- Tax from tax record
- −$256 /mo · $3,066/yr
- Insurance
- −$125
- HOA
- −$0
- Vacancy / Maint / Mgmt
- −$826
- Net cashflow
- $1,154
Break-even live
Sensitivity live
| Price | -10% $1,324 | -5% $1,239 | +0% $1,154 | +5% $1,069 | +10% $984 |
|---|---|---|---|---|---|
| Rent | -10% $843 | -5% $999 | +0% $1,154 | +5% $1,309 | +10% $1,465 |
| Rate | -1.0pp $1,305 | -0.5pp $1,230 | base $1,154 | +0.5pp $1,076 | +1.0pp $997 |
2-unit breakdown (identical units grouped — click to expand)
| Units | Beds | Baths | Est. rent |
|---|---|---|---|
| 2× units | 2 | 1 | $3,932 |
| #1 | 2 | 1 | $1,966 |
| #2 | 2 | 1 | $1,966 |
| Total (2 units) | $3,933 | ||
UW: 25.0% down · 7.5% · 30yr · 1.5% tax · 5.0% vac · 8.0% maint · 8.0% mgmt
Financing live
Cash to close
- Down payment
- $74,975
- Closing costs
- $8,997
- Reserves months
- —
- Total cash needed
- —
Loan-product check · same deal, 3 products live
Conventional
25% down · 7.5% · 30yr
- Down + closing
- —
- Monthly P&I
- —
- Monthly cashflow
- —
- DSCR
- —
- Eligible?
- —
Personal DTI + credit; lowest rate.
DSCR
20% down · 8.5% · 30yr
- Down + closing
- —
- Monthly P&I
- —
- Monthly cashflow
- —
- DSCR
- —
- Eligible?
- —
No personal income docs; deal must DSCR.
Hard money
10% down · 12.0% · 12mo
- Down + closing
- —
- Monthly P&I
- —
- Monthly cashflow
- —
- DSCR
- —
- Eligible?
- —
Short-term bridge; refi at stabilization.
Rent comps 4 comps
| Address | Beds | Baths | Sqft | Rent | $/sqft | DOM | Units | Dist |
|---|---|---|---|---|---|---|---|---|
| 150 Green St Unit 1 Athol, MA | 4.0 | 1.0 | 1500 | $2,300 | $1.53 | 14d | 1 | 0.31mi |
| 199 High St Unit 1 Athol, MA | 3.0 | 1.0 | 1500 | $2,100 | $1.40 | 14d | 1 | 0.41mi |
| 551 Chestnut St #2 Athol, MA | 3.0 | 1.0 | 2595 | $2,200 | $0.85 | 14d | 1 | 0.77mi |
| 73 Walnut St Unit 2 Athol, MA | 3.0 | 1.0 | 1500 | $1,900 | $1.27 | 14d | 1 | 1.23mi |
Listing history 21 events
-
2026-06-21statusdays on market $299,900 Under Agreement 29 DOM
-
2026-06-18days on market $299,900 Active 28 DOM
-
2026-06-17days on market $299,900 Active 27 DOM
-
2026-06-16days on market $299,900 Active 26 DOM
-
2026-06-15days on market $299,900 Active 25 DOM
-
2026-06-13days on market $299,900 Active 23 DOM
-
2026-06-12days on market $299,900 Active 22 DOM
-
2026-06-09days on market $299,900 Active 19 DOM
-
2026-06-08days on market $299,900 Active 18 DOM
-
2026-06-07days on market $299,900 Active 17 DOM
-
2026-06-07days on market $299,900 Active 16 DOM
-
2026-06-04days on market $299,900 Active 13 DOM
-
2026-06-02statusdays on market $299,900 Active 12 DOM
-
2026-06-01days on market $299,900 Back On Market 11 DOM
-
2026-05-31days on market $299,900 Back On Market 10 DOM
-
2026-05-31days on market $299,900 Back On Market 9 DOM
-
2026-05-12$299,900 New 916-char remark
-
2002-10-29soldstatus $143,000 237-char remark
Show marketing remark (237 chars)
GREAT PROPERTY WITH MANY OPTIONS. 1ST FLR HAS NEW KITCHEN, NEW DINING RM AND NEW FULL BATH. A NEW OFFICE SPACE CAN GO WITH EITHER 1ST OR 2ND FLOOR. POSSIBLY ENOUGH LAND FOR AN ADD'L BUILDING LOT. HOME COULD BE USED AS A SINGLE FAMILY.
-
2002-10-29soldstatus $143,000
Show marketing remark (237 chars)
GREAT PROPERTY WITH MANY OPTIONS. 1ST FLR HAS NEW KITCHEN, NEW DINING RM AND NEW FULL BATH. A NEW OFFICE SPACE CAN GO WITH EITHER 1ST OR 2ND FLOOR. POSSIBLY ENOUGH LAND FOR AN ADD'L BUILDING LOT. HOME COULD BE USED AS A SINGLE FAMILY.
-
2002-09-05historical 237-char remark
Show marketing remark (237 chars)
GREAT PROPERTY WITH MANY OPTIONS. 1ST FLR HAS NEW KITCHEN, NEW DINING RM AND NEW FULL BATH. A NEW OFFICE SPACE CAN GO WITH EITHER 1ST OR 2ND FLOOR. POSSIBLY ENOUGH LAND FOR AN ADD'L BUILDING LOT. HOME COULD BE USED AS A SINGLE FAMILY.
-
2002-06-01$142,000 237-char remark
Show marketing remark (237 chars)
GREAT PROPERTY WITH MANY OPTIONS. 1ST FLR HAS NEW KITCHEN, NEW DINING RM AND NEW FULL BATH. A NEW OFFICE SPACE CAN GO WITH EITHER 1ST OR 2ND FLOOR. POSSIBLY ENOUGH LAND FOR AN ADD'L BUILDING LOT. HOME COULD BE USED AS A SINGLE FAMILY.
ⓘ Source: listings_history table (triggers on properties + properties_extension) + one-shot
backfill from property_details.listing_events for pre-trigger history.
Tax reassessment forecast MA · Partial reset (capped growth)
- Current annual tax
- $3,066 · $256/mo
- Projected year-2 tax
- $3,377 · $281/mo
- Expected delta
- +$311/yr (+$26/mo · 10.2%)
ⓘ Screening estimate from a state-policy table — verify with the county assessor before closing.
Climate risk First Street
- Flood 1/10 Low 0% chance over 30 yrs
- Wildfire 3/10 Moderate
- Heat 3/10 Moderate 7 d/yr ≥92°F today · 17 d/yr by 30 yrs out
- Wind 4/10 Moderate 18% chance of damaging wind over 30 yrs
- Air quality 2/10 Low 1 unhealthy d/yr today · 1 by 30 yrs out
Nearby sold comps map
Loading sold comps map…
Walkable amenities ~0.75 mi
Loading nearby amenities…
Taxation est. · year 1
- Rental income
- $47,196
- − Mortgage interest
- −$16,799
- − Property taxes
- −$3,066
- − Insurance
- −$1,500
- − Repairs & maintenance
- −$3,776
- − Management
- −$3,776
- − Depreciation
- −$8,724
- Taxable income
- $9,556
- Est. tax owed @ 24.0%
- −$2,293
- After-tax cash flow
- $11,553/yr
For passive investors: Depreciation is non-cash, so a rental often shows a tax loss while cash-flowing — sheltering income. Rental losses are passive: they offset passive income freely, and up to $25,000/yr can offset ordinary (W-2) income if you actively participate and your MAGI is under $100k (phasing out to $0 by $150k); unused losses carry forward. On sale, claimed depreciation is recaptured at up to 25%, and gains may owe capital-gains tax (a 1031 exchange can defer both). Figures are a year-1 estimate at your 24.0% rate — not tax advice; consult a CPA.
Schools (NCES district)
- District
- Athol-Royalston
- NCES district ID
- 2502160
- Math proficiency
- 22% ▼ -14.00%
- Reading proficiency
- 33% ▼ -5.00%
- Median HH income
- $49,570
- Composite
- 24.05/100
- National rank
- #7764
- State rank
- #265 of 302 in MA
Livability — Athol
- Score
- 74/100
- State rank
- #84
- US rank
- #4383
Category grades
Schools grade is shown separately in the Schools card above.
Census & demographics
- Census place
- Athol, MA
- Population (ZIP)
- 13,865
Population outlook (Worcester County) Hauer SSP2
- Today (2025)
- 850,858 people
- By 2030
- 860,403 · +1.1%
- By 2040
- 869,902 · +2.2%
- By 2050
- 869,110 · +2.1%
- By 2075
- 870,120 · +2.3%
- By 2100
- 829,703 · -2.5%
Race, ethnicity, and origin ACS 2023
- Neighborhood character
- Predominantly White (89%)
- Race & ethnicity
- White 89% Hispanic / Latino 5% Two or more races 4% Black 2%
- Hispanic origin (detail)
- Puerto Rican 4%
- Common ancestry
- Lithuanian 14% Romanian 6% Slovak 2%
- Foreign-born
- 3% · Canada
- Languages at home
- 94% English-only · Spanish 2% French/Haitian/Cajun 2% German/W. Germanic 1%
Political lean MEDSL · Worcester
- 2024 margin
- D (+10.0) · D 53.9% · R 43.9% · Other 2.2%
- 2008→2024 swing
- -3.8pp toward R · 2008: 13.8pp · 2024: 10.0pp
- All cycles
- 2024: D+10.0 2020: D+17.8 2016: D+10.5 2012: D+9.2 2008: D+13.8
Not yet ingested
- Civics
- —
Market trends
- HPI YoY
- ▼ -37.02%
- Current HPI
- 336.1238
- Rent YoY
- —
- Metro
- —
- State GDP YoY
- ▲ 2.28%
- F500 in state
- 38
Industry mix (Fortune 500 HQ in MA)
| Industry | F500 HQs | Revenue |
|---|---|---|
| Technology | 3 | $17B |
|
||
| Insurance | 2 | $84B |
|
||
| Retail | 2 | $76B |
|
||
| Life Sciences | 1 | $43B |
|
||
| Energy Technology | 1 | $31B |
|
||
| Aerospace / Defense | 1 | $18B |
|
||
Price history
+111.2% since first listed7 events — show timeline
- 2026-05-29 Relisted — MLS PIN
- 2026-05-21 Pending — MLS PIN
- 2026-05-12 Listed $299,900 MLS PIN
- 2002-10-29 Sold (Public Records) $143,000 Public Records
- 2002-10-29 Sold (MLS) $143,000 MLS PIN
- 2002-09-05 Listing Removed — MLS PIN
- 2002-06-01 Listed $142,000 MLS PIN
Property tax history
+2.5%/yrLatest (2023): $3,066 · +9.2% YoY. Source: county tax records.
Cash-flow waterfall
monthlySold comps — $/sqft
last 12 mo · ≤1 miLoading sold comps…