 Duplex
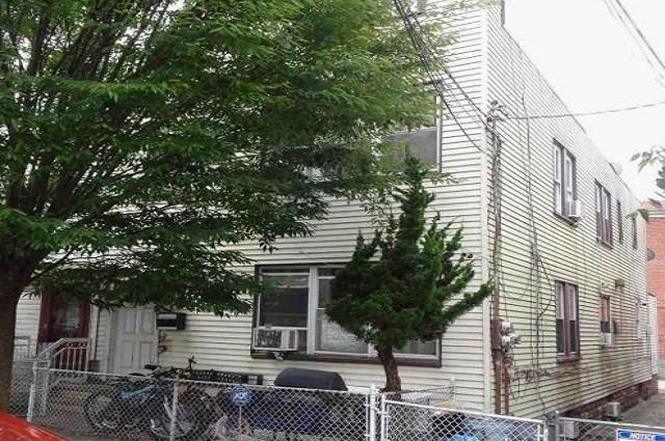
1644 E 96th St · New York, NY
Flood risk 7/10 · Major
- FEMA flood zone
- X (unshaded)
- Chance of flooding over 30 yrs
- 0.59%
- Est. flood insurance / yr
- $507 – $1,088
Fire risk 1/10 · Minimal
- Est. fire insurance / yr
- $691 – $1,283
Heat risk 7/10 · Major
- Hot days now (above 96°F)
- 7 days/yr
- Hot days in 30 yrs
- 15 days/yr
Wind risk 6/10 · Moderate
- Chance of severe wind over 30 yrs
- 68.0%
Air-quality risk 5/10 · Moderate
- Unhealthy air days now
- 6 days/yr
- Unhealthy air days in 30 yrs
- 8 days/yr
Risk factors via First Street. Map © Google.
Why this score? — see what drove the B+ grade
The composite is a weighted blend of 9 inputs, each scored 0–100. Each bar is that input's sub-score; the figure is the points it added to the 100-point composite (weight × sub-score).
- Cash flow +30.0/30.0
- ARV discount +15.0/15.0
- DSCR +10.0/10.0
- 1% rule +9.1/10.0
- Schools +5.0/10.0
- Livability +3.8/5.0
- Rent growth +2.5/5.0
- Condition / age +2.5/5.0
- Appreciation +0.0/10.0
$549,000
🖨 Deal sheet 📄 Offer letter ✓ Due diligence
Multi-family units
County records classify this as Multi-Family (2-4 Unit). Listing-text estimate: 2 units. confirmed
Listing remarks
Investment opportunity in Brooklyn, NY!! Property appears to be a duplex each with three bedrooms and 1 bathroom. Appears to have a full basement but maybe unfinished. Property was built in 1930. Cloud in title being cleared up from recent foreclosure that requires a strict foreclosure to be completed. Can take up to 12 months or sooner to resolve. The buyer will receive letter from Foreclosure attorney that they will clear title and Buyer will take the property subject to the title issue, the issue will be listed under exception in the policy that is being issued. Once the issue is resolved based on given ETA the underwriter will issue an elimination endorsement eliminating the title issue
Key facts
- 2,016 sq ft lot
- Built 1930
- Listed 512 days
Neighborhood map
What this means for you Summary
Snapshot
- This is a 2 × 3-bed/1.0-bath units multifamily listed at $549k.
Deal economics
- At list price, monthly cash flow is $2k ($28k/yr) — positive. Per door: $1k/mo.
- The deal already cash-flows at list — no discount required.
- Meets the 1% rule at list price ($8k rent vs $549k).
- Recommended offer: $483k (12.0% below list) — sets the bar for market timing.
- Cap rate 11.6% vs local median 2.6% in New York — top-decile yield for the area; either an underpriced asset or a hidden risk that comps aren't pricing in. Stress-test before assuming the spread holds.
Location & tenants
- Location reads 75/100 on livability (#268 in NY, #4,188 nationally) — a middle-class / working-renter tenant base. Strengths: amenities A+, commute A+, health & safety A; Watch: crime F, cost of living F.
- Market conditions: 228 active listings in the ZIP; solid renter incomes; 10,063 units permitted in Kings County in 2024 (9,789 in 5+ unit buildings).
- At $7,748/mo this rent would consume 114% of the median local household income ($81k/yr) (locally 4225% of renters already pay >50% of income on rent) — very limited rent-growth headroom before tenants either downsize or default.
Forward outlook
- Local home prices are declining (-3.0%/yr); year-one equity from $4k of loan paydown is wiped out by about $16k of value loss. Plan a longer hold.
- Kings County population projected at +13% by 2050 — modest demand growth; plan on rents tracking national, not racing it.
- At projected returns (-3.0% appreciation + 3.0% rent growth), your $154k cash investment doubles in ~7 years — after that, you're playing with house money.
Negotiation context
- It's been on market 512 days — a 12% lower offer ($483k) is reasonable based on typical stale-listing flexibility.
- 5 sale attempts since 2y ago; this cycle's ask has dropped $148k (21%) from the opening price — seller is motivated, your offer sets the floor, not the list.
Risks & watch-outs
- Watch-outs: flood insurance adds $66/mo; built in 1930 — expect roof / HVAC / electrical / plumbing capex.
- Climate carrying-cost: major flood risk; major wind risk, 68% chance of damaging wind over 30y; extreme-heat days projected 7→15/yr by 2055 (HVAC capex compounding) — expect insurance premiums to compound above CPI over the hold.
Questions for the listing agent
- It's been on market 512 days. Have you received any prior offers? Is the seller open to a 12% concession, seller financing, or rate buy-down credit?
- Can we see the unit-by-unit rent roll, current vacancy, and any below-market leases? What's the average tenancy length?
- What capital expenditures (roof, boiler, parking lot, exteriors) have been made in the last 5 years, and what's planned in the next 2?
- Built in 1930 — when were the roof, HVAC, electrical panel, plumbing, and water heater last replaced?
- What's the actual annual flood-insurance premium (NFIP or private), and is the property in a SFHA with mandatory coverage?
- Why hasn't it sold? Are there any deal-killer items the seller is aware of (foundation, flood, title, zoning, code violations)?
- Is there a deadline driving the sale (1031 exchange, divorce, estate, relocation)? That informs how much negotiation room exists.
- Schools are B-rated — typically a magnet for longer-tenancy family renters. What's the average tenant stay here, and is there a school-zone premium baked into asking?
- Crime grade is F in this area — have there been break-ins, vandalism, or insurance claims at this property in the last 3 years? What carrier currently insures it and at what premium?
- What's the average days-on-market for RENTAL listings here right now (not sales)? A rising rental-DOM trend means longer vacancies and softer asking-rent achievability than the comps imply.
- What's the recent tenant-quality profile in this submarket — average credit score on applications, eviction rate, late-payment / NSF rate, and stable-employment percentage? A property-management company in the area should have these aggregated.
- How much new apartment / multifamily construction is in the pipeline within 1–3 miles? Heavy new supply (>2% of stock underway) typically softens rents 12–24 months out; light construction supports rent growth.
Investment metrics
- 1% rule
- 1.41% ✓
- Cap rate
- 11.63%
- Cash-on-cash
- 19.05%
- DSCR
- 1.85
- GRM
- 5.9
CMA / ARV
- ARV (on-the-fly)
- $844,800
- Comps found
- 9
Show comp detail 9 sales within ~0.75 mi
| Address | Dist | Beds/Ba | Sqft | Sold | Price | $/sf | Match |
|---|---|---|---|---|---|---|---|
| 1462 E 92nd St | 0.40mi | 7/2.0 (+1) | 1,908 (-1%) | 10mo | $860,000 | $451 | 67 |
| 8916 Avenue L | 0.52mi | 6/4.0 | 1,890 (-2%) | 6mo | $772,500 | $409 | 60 |
| 1419 E 98th St | 0.37mi | 5/2.5 (-1) | 2,100 (+9%) | 5mo | $955,000 | $455 | 56 |
| 1467 EAST 101 St | 0.29mi | 5/3.0 (-1) | 2,151 (+12%) | 5mo | $850,000 | $395 | 53 |
| 1142 E 89th St | 0.62mi | 6/4.0 | 1,840 (-4%) | 13mo | $950,000 | $516 | 45 |
| 10103 Seaview Ave | 0.29mi | 5/3.5 (-1) | 2,160 (+12%) | 18mo | $900,000 | $417 | 39 |
| 9 Holmes Ln | 0.53mi | 6/5.0 | 2,122 (+10%) | 8mo | $975,000 | $459 | 39 |
| 1327 E 94th St | 0.59mi | 6/2.5 | 2,184 (+14%) | 14mo | $960,000 | $440 | 36 |
| 10529 Flatlands 4th St | 0.72mi | 5/3.0 (-1) | 2,200 (+15%) | 10mo | $950,000 | $432 | 25 |
Match score weights: distance 35% · size 25% · config 20% · recency 20%. Top-matched comps best support the ARV.
Projected returns pro-forma
-3.0% appreciation · 3.0% rent growth · sell at horizon
- IRR
- 10.3%
- Equity multiple
- 1.41×
- Total profit
- $62,310
- Equity at exit
- $81,858
- IRR
- 19.4%
- Equity multiple
- 2.62×
- Total profit
- $249,290
- Equity at exit
- $47,467
Cash invested: $153,720 (down + closing). Projections, not guarantees.
Landlord ↔ Tenant lean methodology
- Overall (CITY)
- 0 Strongly Tenant-Friendly
- State New York
- 15 Strongly Tenant-Friendly · D+10
- County
- — inherits STATE
- City New York
- 0 Strongly Tenant-Friendly · D+34
ZIP-level market 11236
- Active inventory
- 228
- Price-to-rent
- 11.8×
Monthly cashflow live
- Estimated rent
- $7,748 medium interval (Pro) →
- Mortgage (P&I)
- −$2,879
- Tax from tax record
- −$573 /mo · $6,876/yr
- Insurance
- −$229
- Flood insurance flood zone
- −$66 /mo · $798/yr
- HOA
- −$0
- Vacancy / Maint / Mgmt
- −$1,627
- Net cashflow
- $2,374
Break-even live
2-unit breakdown (identical units grouped — click to expand)
| Units | Beds | Baths | Est. rent |
|---|---|---|---|
| 2× units | 3 | 1 | $7,748 |
| #1 | 3 | 1 | $3,874 |
| #2 | 3 | 1 | $3,874 |
| Total (2 units) | $7,748 | ||
UW: 25.0% down · 7.5% · 30yr · 1.5% tax · 5.0% vac · 8.0% maint · 8.0% mgmt
Financing live
Cash to close
- Down payment
- $137,250
- Closing costs
- $16,470
- Reserves months
- —
- Total cash needed
- —
Loan-product check · same deal, 3 products live
Conventional
25% down · 7.5% · 30yr
- Down + closing
- —
- Monthly P&I
- —
- Monthly cashflow
- —
- DSCR
- —
- Eligible?
- —
Personal DTI + credit; lowest rate.
DSCR
20% down · 8.5% · 30yr
- Down + closing
- —
- Monthly P&I
- —
- Monthly cashflow
- —
- DSCR
- —
- Eligible?
- —
No personal income docs; deal must DSCR.
Hard money
10% down · 12.0% · 12mo
- Down + closing
- —
- Monthly P&I
- —
- Monthly cashflow
- —
- DSCR
- —
- Eligible?
- —
Short-term bridge; refi at stabilization.
Listing history 45 events
-
2026-02-19status Pending
-
2026-02-07price $549,000
-
2026-01-16status Active
-
2026-01-15historical
-
2026-01-14price $553,400
-
2025-12-23price $556,200
-
2025-12-04price $559,000
-
2025-11-12price $563,200
-
2025-10-22price $566,100
-
2025-10-01price $569,000
-
2025-09-09price $573,200
-
2025-08-25price $576,100
-
2025-08-06price $579,000
-
2025-07-21price $583,000
-
2025-07-01price $586,000
-
2025-06-16price $589,000
-
2025-05-28price $593,700
-
2025-05-09price $596,700
-
2025-04-22price $599,700
-
2025-04-01price $602,800
-
2025-03-12price $605,900
-
2025-02-20price $609,000
-
2025-02-05price $612,100
-
2025-01-21price $646,100
-
2025-01-02price $649,400
-
2024-12-18price $652,700
-
2024-11-28price $668,200
-
2024-11-12price $671,600
-
2024-10-28price $675,000
-
2024-10-01historical
-
2024-09-24$697,400 Active
-
2024-09-24historical
-
2024-09-24$697,400 Active
-
2024-09-24$697,400 Active
-
2024-09-13historical
-
2024-08-01price $697,400
-
2024-07-17price $764,500
-
2024-07-02price $824,000
-
2024-06-17price $894,700
-
2024-05-28price $958,500
-
2024-05-10price $963,400
-
2024-04-25price $1,054,700
-
2024-04-10$1,060,000 Active
-
2005-11-07soldstatus $530,000
-
1991-09-11soldstatus $180,000
ⓘ Source: listings_history table (triggers on properties + properties_extension) + one-shot
backfill from property_details.listing_events for pre-trigger history.
Tax reassessment forecast NY · Partial reset (capped growth)
- Current annual tax
- $6,876 · $573/mo
- Projected year-2 tax
- $8,077 · $673/mo
- Expected delta
- +$1,201/yr (+$100/mo · 17.5%)
ⓘ Screening estimate from a state-policy table — verify with the county assessor before closing.
Climate risk First Street
- Flood 7/10 Severe FEMA zone X (unshaded) · 59% chance over 30 yrs
- Wildfire 1/10 Low
- Heat 7/10 Severe 7 d/yr ≥96°F today · 15 d/yr by 30 yrs out
- Wind 6/10 Major 68% chance of damaging wind over 30 yrs
- Air quality 5/10 Major 6 unhealthy d/yr today · 8 by 30 yrs out
Nearby sold comps map
Loading sold comps map…
Walkable amenities ~0.75 mi
Loading nearby amenities…
Taxation est. · year 1
- Rental income
- $92,976
- − Mortgage interest
- −$30,753
- − Property taxes
- −$6,876
- − Insurance
- −$3,542
- − Repairs & maintenance
- −$7,438
- − Management
- −$7,438
- − Depreciation
- −$15,971
- Taxable income
- $20,958
- Est. tax owed @ 24.0%
- −$5,030
- After-tax cash flow
- $23,455/yr
For passive investors: Depreciation is non-cash, so a rental often shows a tax loss while cash-flowing — sheltering income. Rental losses are passive: they offset passive income freely, and up to $25,000/yr can offset ordinary (W-2) income if you actively participate and your MAGI is under $100k (phasing out to $0 by $150k); unused losses carry forward. On sale, claimed depreciation is recaptured at up to 25%, and gains may owe capital-gains tax (a 1031 exchange can defer both). Figures are a year-1 estimate at your 24.0% rate — not tax advice; consult a CPA.
Schools (NCES district)
No district data.
Livability — New York
- Score
- 75/100
- State rank
- #268
- US rank
- #4188
Category grades
Schools grade is shown separately in the Schools card above.
Census & demographics
- Census place
- New York, NY
- County
- Kings County · 2,614,986 people
- City population
- 7,731,280
- Metro
- New York-Newark-Jersey City, NY-NJ-PA
- Population (ZIP)
- 88,051
- Household income
- $81,464
- Rent vs Own
- Severe rent burden
- 4225.0
Population outlook (Kings County) Hauer SSP2
- Today (2025)
- 2,847,441 people
- By 2030
- 2,937,006 · +3.1%
- By 2040
- 3,095,491 · +8.7%
- By 2050
- 3,228,968 · +13.4%
- By 2075
- 3,321,723 · +16.7%
- By 2100
- 3,111,387 · +9.3%
Race, ethnicity, and origin ACS 2023
- Neighborhood character
- Predominantly Black (79%)
- Race & ethnicity
- Black 79% Hispanic / Latino 8% Two or more races 8% White 4% Asian 2%
- Hispanic origin (detail)
- Puerto Rican 3% Dominican 2%
- Common ancestry
- Hispanic 14%
- Foreign-born
- 45% · Canada, Mexico, China
- Languages at home
- 74% English-only · French/Haitian/Cajun 14% Spanish 6% Chinese 1%
Political lean MEDSL · Kings
- 2024 margin
- Solid D (+44.0) · D 72.0% · R 28.0%
- 2008→2024 swing
- -15.5pp toward R · 2008: 59.4pp · 2024: 44.0pp
- All cycles
- 2024: D+44.0 2020: D+54.8 2016: D+61.8 2012: D+63.9 2008: D+59.4
Not yet ingested
- Civics
- —
Market trends
- HPI YoY
- ▼ -375.21%
- Current HPI
- 330.8367
- Rent YoY
- —
- Metro
- New York-Newark-Jersey City, NY-NJ-PA
- State GDP YoY
- ▲ 2.60%
- F500 in state
- 92
Industry mix (Fortune 500 HQ in NY)
| Industry | F500 HQs | Revenue |
|---|---|---|
| Financial Services | 10 | $950B |
|
||
| Consumer Goods | 9 | $162B |
|
||
| Insurance | 4 | $225B |
|
||
| Telecommunications | 2 | $144B |
|
||
| Pharmaceuticals | 2 | $112B |
|
||
| Media / Entertainment | 2 | $69B |
|
||
Price history
+205.0% since first listed45 events — show timeline
- 2026-02-19 Pending — OneKey® MLS as Distributed by MLS Grid
- 2026-02-07 Price Changed $549,000 OneKey® MLS as Distributed by MLS Grid
- 2026-01-16 Relisted — OneKey® MLS as Distributed by MLS Grid
- 2026-01-15 Listing Removed — OneKey® MLS as Distributed by MLS Grid
- 2026-01-14 Price Changed $553,400 OneKey® MLS as Distributed by MLS Grid
- 2025-12-23 Price Changed $556,200 OneKey® MLS as Distributed by MLS Grid
- 2025-12-04 Price Changed $559,000 OneKey® MLS as Distributed by MLS Grid
- 2025-11-12 Price Changed $563,200 OneKey® MLS as Distributed by MLS Grid
- 2025-10-22 Price Changed $566,100 OneKey® MLS as Distributed by MLS Grid
- 2025-10-01 Price Changed $569,000 OneKey® MLS as Distributed by MLS Grid
- 2025-09-09 Price Changed $573,200 OneKey® MLS as Distributed by MLS Grid
- 2025-08-25 Price Changed $576,100 OneKey® MLS as Distributed by MLS Grid
- 2025-08-06 Price Changed $579,000 OneKey® MLS as Distributed by MLS Grid
- 2025-07-21 Price Changed $583,000 OneKey® MLS as Distributed by MLS Grid
- 2025-07-01 Price Changed $586,000 OneKey® MLS as Distributed by MLS Grid
- 2025-06-16 Price Changed $589,000 OneKey® MLS as Distributed by MLS Grid
- 2025-05-28 Price Changed $593,700 OneKey® MLS as Distributed by MLS Grid
- 2025-05-09 Price Changed $596,700 OneKey® MLS as Distributed by MLS Grid
- 2025-04-22 Price Changed $599,700 OneKey® MLS as Distributed by MLS Grid
- 2025-04-01 Price Changed $602,800 OneKey® MLS as Distributed by MLS Grid
- 2025-03-12 Price Changed $605,900 OneKey® MLS as Distributed by MLS Grid
- 2025-02-20 Price Changed $609,000 OneKey® MLS as Distributed by MLS Grid
- 2025-02-05 Price Changed $612,100 OneKey® MLS as Distributed by MLS Grid
- 2025-01-21 Price Changed $646,100 OneKey® MLS as Distributed by MLS Grid
- 2025-01-02 Price Changed $649,400 OneKey® MLS as Distributed by MLS Grid
- 2024-12-18 Price Changed $652,700 OneKey® MLS as Distributed by MLS Grid
- 2024-11-28 Price Changed $668,200 OneKey® MLS as Distributed by MLS Grid
- 2024-11-12 Price Changed $671,600 OneKey® MLS as Distributed by MLS Grid
- 2024-10-28 Price Changed $675,000 OneKey® MLS as Distributed by MLS Grid
- 2024-10-01 Listing Removed — OneKey® MLS as Distributed by MLS Grid
- 2024-09-24 Listed $697,400 OneKey® MLS as Distributed by MLS Grid
- 2024-09-24 Listed $697,400 OneKey® MLS as Distributed by MLS Grid
- 2024-09-24 Listing Removed — OneKey® MLS as Distributed by MLS Grid
- 2024-09-24 Listed $697,400 OneKey® MLS as Distributed by MLS Grid
- 2024-09-13 Listing Removed — OneKey® MLS as Distributed by MLS Grid
- 2024-08-01 Price Changed $697,400 OneKey® MLS as Distributed by MLS Grid
- 2024-07-17 Price Changed $764,500 OneKey® MLS as Distributed by MLS Grid
- 2024-07-02 Price Changed $824,000 OneKey® MLS as Distributed by MLS Grid
- 2024-06-17 Price Changed $894,700 OneKey® MLS as Distributed by MLS Grid
- 2024-05-28 Price Changed $958,500 OneKey® MLS as Distributed by MLS Grid
- 2024-05-10 Price Changed $963,400 OneKey® MLS as Distributed by MLS Grid
- 2024-04-25 Price Changed $1,054,700 OneKey® MLS as Distributed by MLS Grid
- 2024-04-10 Listed $1,060,000 OneKey® MLS as Distributed by MLS Grid
- 2005-11-07 Sold (Public Records) $530,000 Public Records
- 1991-09-11 Sold (Public Records) $180,000 Public Records
Property tax history
+4.3%/yrLatest (2025): $6,876 · -0.3% YoY. Source: county tax records.
Cash-flow waterfall
monthlySold comps — $/sqft
last 12 mo · ≤1 miLoading sold comps…