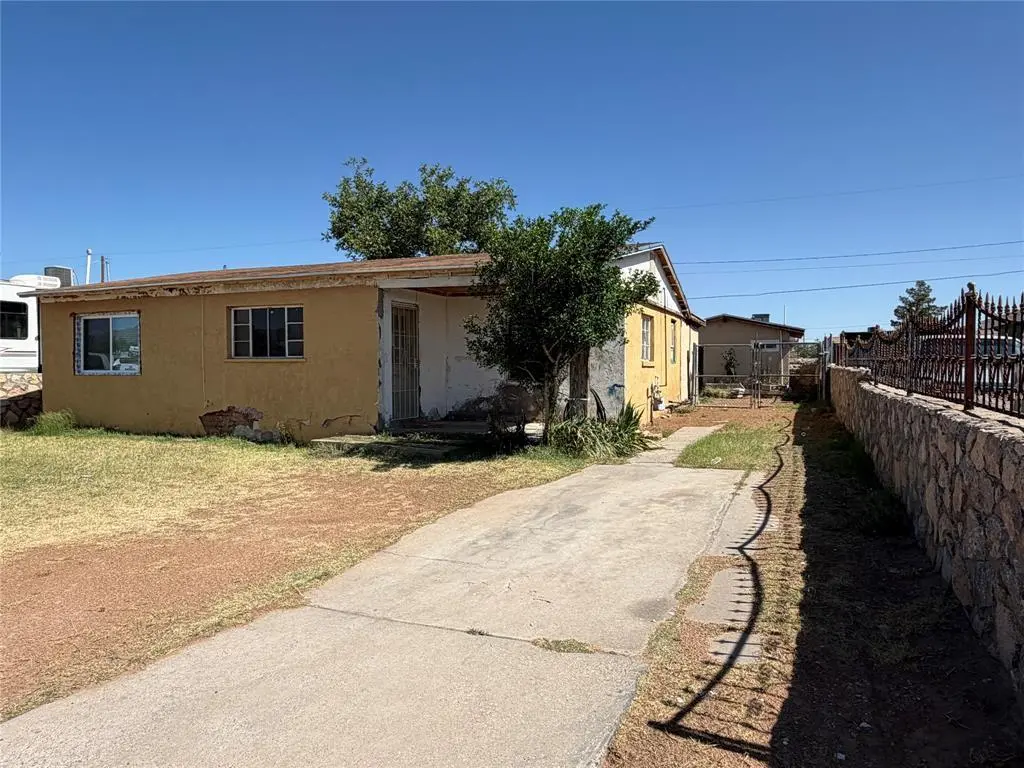
5633 Manila Dr · El Paso, TX
Flood risk 1/10 · Minimal
- FEMA flood zone
- X
- Chance of flooding over 30 yrs
- 0.0%
- Est. flood insurance / yr
- $507 – $1,088
Fire risk 3/10 · Minor
- Est. fire insurance / yr
- $1,222 – $2,270
Heat risk 6/10 · Moderate
- Hot days now (above 100°F)
- 7 days/yr
- Hot days in 30 yrs
- 25 days/yr
Wind risk 1/10 · Minimal
- Chance of severe wind over 30 yrs
- —
Air-quality risk 3/10 · Minor
- Unhealthy air days now
- 2 days/yr
- Unhealthy air days in 30 yrs
- 2 days/yr
Risk factors via First Street. Map © Google.
Why this score? — see what drove the B grade
The composite is a weighted blend of 9 inputs, each scored 0–100. Each bar is that input's sub-score; the figure is the points it added to the 100-point composite (weight × sub-score).
- Cash flow +26.0/30.0
- ARV discount +15.0/15.0
- DSCR +8.7/10.0
- 1% rule +7.9/10.0
- Livability +4.0/5.0
- Rent growth +3.6/5.0
- Schools +2.7/10.0
- Condition / age +2.5/5.0
- Appreciation +0.0/10.0
$109,000
🖨 Deal sheet (PDF) 📄 Offer letter ✓ Due diligence
Listing remarks
Opportunity to acquire a 1,279 sq ft, 2-bedroom, 1.5-bath single-family home with strong value-add potential. This property is ideal for investors, flippers, or buyers looking for a renovation project with the opportunity to build equity through improvements. The home will require repairs and updates, making it a strong candidate for a full renovation, resale project, or long-term rental investment. With a functional floor plan and solid potential, this property offers an opportunity to maximize value and create a space tailored to today's market. Property is being sold AS-IS. No repairs will be made by the seller. Buyer to perform their own due diligence. Whether you're searching for your
Key facts
- 6,621 sq ft lot
- 2 parking spots
- Built 1957
Property features AI
Finance
- Other: Possession at closing/funding; Listing is active and offered under exclusive right to sell
- Financial info: Treat as clear loan type; No second mortgage
- HOA & community: No association
Exterior
- Parking: Carport with 2 spaces; Outside parking
- Utilities: Municipal utility district: No; Other utilities
- Home design: Single family residence; Residential property; Built in 1957; One story
- Construction: Year built 1957
- Exterior features: Lot in the Sahara subdivision; Less than 0.5 acre lot
Interior
- Kitchen: No appliances included
- Bedrooms: 2 bedrooms (Primary bedroom on first level, approx. 10 x 10)
- Bathrooms: 1 full bathroom; 1 half bathroom
- Interior features: One-level layout; One living area; One dining area; Other interior features
- Laundry & utility: No specific laundry/utility features listed
Neighborhood map
What this means for you Summary
Snapshot
- This is a 2-bed/1.0-bath single-family listed at $109k.
Deal economics
- At list price, monthly cash flow is $271 ($3k/yr) — positive.
- The deal already cash-flows at list — no discount required.
- Meets the 1% rule at list price ($1k rent vs $109k).
Location & tenants
- Location reads 81/100 on livability (#23 in TX, #1,375 nationally) — a professional / high-income tenant draw. Strengths: commute A+, cost of living A+, housing A+; Watch: employment D+.
- El Paso ISD (urban): math 27% / reading 37% proficiency, ranked #591 of 826 in TX (top 72%) — families likely to look elsewhere, expect single-tenant / working-renter base with shorter leases; 65% free/reduced lunch — lower-income household profile, screen leases tightly.
- Zoned schools: Terrace Hills Middle (math 17% / reading 24%); Irvin H S (math 27% / reading 19%, grade F, #1,348 of 1,632 statewide, top 83%, 987 students, 98% FRL) — zoned schools average 98% FRL vs 65% district-wide (33 pts higher); higher-poverty schools than district average — tighter screening recommended.
- Market conditions: Rents rising fast (+4.5%/yr); 248 active listings in the ZIP; 35 comparable units currently listed for rent nearby; rentals at typical pace (median 26d on market — plan ~3-4 weeks tenant-placement turnaround); 40% of comp listings sitting > 30 days — soft ceiling on asking rent; 2,196 units permitted in El Paso County in 2024 (143 in 5+ unit buildings).
Forward outlook
- Local home prices are declining (-3.0%/yr); year-one equity from $754 of loan paydown is wiped out by about $3k of value loss. Plan a longer hold.
- El Paso County population projected at +10% by 2050 — modest demand growth; plan on rents tracking national, not racing it.
- At projected returns (-3.0% appreciation + 4.5% rent growth), your $31k cash investment doubles in ~9 years — after that, you're playing with house money.
Negotiation context
- Only 10 days on market — expect competitive offers; lowballing is unlikely to land.
Risks & watch-outs
- Watch-outs: built in 1957 — expect roof / HVAC / electrical / plumbing capex.
- Climate carrying-cost: extreme-heat days projected 7→25/yr by 2055 (HVAC capex compounding) — expect insurance premiums to compound above CPI over the hold.
Questions for the listing agent
- Built in 1957 — when were the roof, HVAC, electrical panel, plumbing, and water heater last replaced?
- Is there a deadline driving the sale (1031 exchange, divorce, estate, relocation)? That informs how much negotiation room exists.
- Schools are B-rated — typically a magnet for longer-tenancy family renters. What's the average tenant stay here, and is there a school-zone premium baked into asking?
- What's the average days-on-market for RENTAL listings here right now (not sales)? A rising rental-DOM trend means longer vacancies and softer asking-rent achievability than the comps imply.
- What's the recent tenant-quality profile in this submarket — average credit score on applications, eviction rate, late-payment / NSF rate, and stable-employment percentage? A property-management company in the area should have these aggregated.
- How much new for-sale + rental construction is in the pipeline within 1–3 miles? Heavy new supply typically softens prices + rents 12–24 months out; constrained supply supports both.
Investment metrics
- 1% rule
- 1.29% ✓
- Cap rate
- 9.28%
- Cash-on-cash
- 10.67%
- DSCR
- 1.47
- GRM
- 6.5
CMA / ARV
- ARV (on-the-fly)
- $190,571
- Comps found
- 1
Show comp detail 1 sale within ~0.75 mi
| Address | Dist | Beds/Ba | Sqft | Sold | Price | $/sf | Match |
|---|---|---|---|---|---|---|---|
| 9500 Verbena Dr | 0.71mi | 3/2.0 (+1) | 1,106 (-14%) | 5mo | $164,999 | $149 | 31 |
Match score weights: distance 35% · size 25% · config 20% · recency 20%. Top-matched comps best support the ARV.
Projected returns pro-forma
-3.0% appreciation · 4.5% rent growth · sell at horizon
- IRR
- 1.6%
- Equity multiple
- 1.06×
- Total profit
- $1,858
- Equity at exit
- $16,252
- IRR
- 12.8%
- Equity multiple
- 2.09×
- Total profit
- $33,308
- Equity at exit
- $9,424
Cash invested: $30,520 (down + closing). Projections, not guarantees.
Landlord ↔ Tenant lean methodology
- Overall (STATE)
- 87 Strongly Landlord-Friendly
- State Texas
- 87 Strongly Landlord-Friendly · R+5
- County
- — inherits STATE
- City
- — inherits STATE
ZIP-level market 79924
- Home prices YoY
- -13.2%
- Rents YoY
- 4.5%
- Active inventory
- 248
- Price-to-rent
- 6.5×
Monthly cashflow live
- Estimated rent
- $1,408 high interval (Pro) →
- Mortgage (P&I)
- −$572
- Tax from tax record
- −$224 /mo · $2,682/yr
- Insurance
- −$45
- HOA
- −$0
- Vacancy / Maint / Mgmt
- −$296
- Net cashflow
- $271
Break-even live
Sensitivity live
| Price | -10% $333 | -5% $302 | +0% $271 | +5% $241 | +10% $210 |
|---|---|---|---|---|---|
| Rent | -10% $160 | -5% $216 | +0% $271 | +5% $327 | +10% $383 |
| Rate | -1.0pp $326 | -0.5pp $299 | base $271 | +0.5pp $243 | +1.0pp $214 |
UW: 25.0% down · 7.5% · 30yr · 1.5% tax · 5.0% vac · 8.0% maint · 8.0% mgmt
Financing live
Cash to close
- Down payment
- $27,250
- Closing costs
- $3,270
- Reserves months
- —
- Total cash needed
- —
Loan-product check · same deal, 3 products live
Conventional
25% down · 7.5% · 30yr
- Down + closing
- —
- Monthly P&I
- —
- Monthly cashflow
- —
- DSCR
- —
- Eligible?
- —
Personal DTI + credit; lowest rate.
DSCR
20% down · 8.5% · 30yr
- Down + closing
- —
- Monthly P&I
- —
- Monthly cashflow
- —
- DSCR
- —
- Eligible?
- —
No personal income docs; deal must DSCR.
Hard money
10% down · 12.0% · 12mo
- Down + closing
- —
- Monthly P&I
- —
- Monthly cashflow
- —
- DSCR
- —
- Eligible?
- —
Short-term bridge; refi at stabilization.
Rent comps 35 comps
| Address | Beds | Baths | Sqft | Rent | $/sqft | DOM | Units | Dist |
|---|---|---|---|---|---|---|---|---|
| 5724 Saluki Dr Unit B El Paso, TX | 3.0 | 2.0 | 1189 | $1,325 | $1.11 | 45d | 1 | 0.08mi |
| 9779 McCombs St Unit A-3 El Paso, TX | 3.0 | 2.0 | 1368 | $1,495 | $1.09 | 45d | 1 | 0.12mi |
| 9779 McCombs St Apt E4 El Paso, TX | 2.0 | 2.0 | 1220 | $1,395 | $1.14 | 45d | 1 | 0.12mi |
| 9779 McCombs St Unit A-8 El Paso, TX | 3.0 | 2.0 | 1220 | $1,495 | $1.23 | 25d | 1 | 0.12mi |
| 9820 Eloice Rd El Paso, TX | 3.0 | 3.0 | 1824 | $1,950 | $1.07 | 16d | 1 | 0.39mi |
| 5945 Tautoga Dr El Paso, TX | 3.0 | 2.0 | 1404 | $1,550 | $1.10 | 16d | 1 | 0.52mi |
| 5516 Fairbanks Dr El Paso, TX | 3.0 | 2.0 | 1303 | $1,500 | $1.15 | 45d | 1 | 0.69mi |
| 5725 Waycross Ave El Paso, TX | 3.0 | 2.0 | 1240 | $1,425 | $1.15 | 25d | 1 | 0.82mi |
| 5104 Paris Ave El Paso, TX | 3.0 | 2.0 | 1196 | $1,495 | $1.25 | 4d | 1 | 0.87mi |
| 5613 Creston Ave El Paso, TX | 3.0 | 2.0 | 1364 | $1,550 | $1.14 | 4d | 1 | 0.91mi |
| 10132 Dyer St Unit 8 El Paso, TX | 3.0 | 2.5 | 1510 | $1,300 | $0.86 | 4d | 1 | 0.95mi |
| 9406 Montgomery Dr El Paso, TX | 3.0 | 2.0 | 1661 | $1,500 | $0.90 | 4d | 1 | 0.96mi |
| 5249 Wren Ave El Paso, TX | 1.0–3.0 | 1.0–2.0 | 850 | $940 | $1.11 | 4d | 9 | 1.01mi |
| 10028 Cross St El Paso, TX | 3.0 | 3.0 | 1230 | $1,599 | $1.30 | 12d | 1 | 1.08mi |
| 5947 Deer Ave El Paso, TX | 2.0 | 1.0 | 893 | $1,250 | $1.40 | 16d | 1 | 1.11mi |
| 6262 Woodrow Bean Transmountain Unit 2 El Paso, TX | 2.0 | 2.5 | 1000 | $1,345 | $1.34 | 45d | 1 | 1.13mi |
| 10202 Niagara Falls Pl El Paso, TX | 3.0 | 1.5 | 1077 | $1,295 | $1.20 | 45d | 1 | 1.16mi |
| 10037 Oakwood Dr El Paso, TX | 3.0 | 1.5 | 1039 | $1,200 | $1.15 | 45d | 1 | 1.17mi |
| 5944 Bridalveil Dr El Paso, TX | 2.0 | 2.0 | 912 | $1,250 | $1.37 | 25d | 1 | 1.17mi |
| 10208 Niagara Falls Pl El Paso, TX | 2.0 | 1.0 | 1050 | $1,250 | $1.19 | 45d | 1 | 1.17mi |
| 5732 Arrowhead Dr El Paso, TX | 3.0 | 1.0 | 957 | $1,175 | $1.23 | 45d | 1 | 1.18mi |
| 5741 Arrowhead Dr El Paso, TX | 3.0 | 2.0 | 1080 | $1,175 | $1.09 | 45d | 1 | 1.21mi |
| 5140 Tropicana Ave El Paso, TX | 3.0 | 1.0 | 998 | $1,100 | $1.10 | 13d | 1 | 1.28mi |
| 5140 Tropicana Ave El Paso, TX | 3.0 | 1.0 | 998 | $1,050 | $1.05 | 4d | 1 | 1.28mi |
| 10125 Racoon Dr El Paso, TX | 3.0 | 2.0 | 1194 | $1,395 | $1.17 | 25d | 1 | 1.31mi |
| 10021 Railroad Dr #402 El Paso, TX | 2.0 | 2.0 | 989 | $1,100 | $1.11 | 45d | 1 | 1.32mi |
| 10051 Railroad Dr Unit 202 El Paso, TX | 2.0 | 2.0 | 989 | $975 | $0.99 | 25d | 1 | 1.39mi |
| 10344 Redwood St El Paso, TX | 3.0 | 2.0 | 1179 | $1,275 | $1.08 | 25d | 1 | 1.39mi |
| 10051 Railroad Dr Unit 704 El Paso, TX | 2.0 | 2.0 | 989 | $975 | $0.99 | 16d | 1 | 1.39mi |
| 10051 Railroad Dr Unit 502 El Paso, TX | 3.0 | 2.5 | 1168 | $1,250 | $1.07 | 4d | 1 | 1.39mi |
| 10051 Railroad Dr Unit 704 El Paso, TX | 2.0 | 2.0 | 989 | $975 | $0.99 | 45d | 1 | 1.39mi |
| 10051 Railroad Dr #802 El Paso, TX | 3.0 | 2.5 | 1189 | $1,250 | $1.05 | 45d | 1 | 1.39mi |
| 5912 Cielo Del Rey Pl Unit B El Paso, TX | 3.0 | 2.5 | 1200 | $1,500 | $1.25 | 45d | 1 | 1.41mi |
| 5904 Cielo Del Rey Pl Unit A El Paso, TX | 3.0 | 2.5 | 1165 | $1,395 | $1.20 | 4d | 1 | 1.42mi |
| 5916 Cielo Del Rey Pl Unit A El Paso, TX | 3.0 | 2.5 | 1165 | $1,250 | $1.07 | 25d | 1 | 1.42mi |
Listing history 9 events
-
2026-06-15statusdays on market $109,000 Pending 10 DOM
-
2026-06-13days on market $109,000 Active Option Contract 9 DOM
-
2026-06-13days on market $109,000 Active Option Contract 8 DOM
-
2026-06-10days on market $109,000 Active Option Contract 6 DOM
-
2026-06-09days on market $109,000 Active Option Contract 5 DOM
-
2026-06-08days on market $109,000 Active Option Contract 4 DOM
-
2026-06-07statusdays on market $109,000 Active Option Contract 3 DOM
-
2026-06-05remarks 699-char remark
-
2026-06-05$109,000 Active 1 DOM
ⓘ Source: listings_history table (triggers on properties + properties_extension) + one-shot
backfill from property_details.listing_events for pre-trigger history.
Tax reassessment forecast TX · Resets to sale price
- Current annual tax
- $2,682 · $224/mo
- Projected year-2 tax
- $2,682 · $224/mo
- Expected delta
- $0/yr ($0/mo · 0.0%)
ⓘ Screening estimate from a state-policy table — verify with the county assessor before closing.
Climate risk First Street
- Flood 1/10 Low FEMA zone X · 0% chance over 30 yrs
- Wildfire 3/10 Moderate
- Heat 6/10 Major 7 d/yr ≥100°F today · 25 d/yr by 30 yrs out
- Wind 1/10 Low
- Air quality 3/10 Moderate 2 unhealthy d/yr today · 2 by 30 yrs out
Nearby sold comps map
Loading sold comps map…
Walkable amenities ~0.75 mi
Loading nearby amenities…
Taxation est. · year 1
- Rental income
- $16,891
- − Mortgage interest
- −$6,106
- − Property taxes
- −$2,682
- − Insurance
- −$545
- − Repairs & maintenance
- −$1,351
- − Management
- −$1,351
- − Depreciation
- −$3,171
- Taxable income
- $1,685
- Est. tax owed @ 24.0%
- −$404
- After-tax cash flow
- $2,853/yr
For passive investors: Depreciation is non-cash, so a rental often shows a tax loss while cash-flowing — sheltering income. Rental losses are passive: they offset passive income freely, and up to $25,000/yr can offset ordinary (W-2) income if you actively participate and your MAGI is under $100k (phasing out to $0 by $150k); unused losses carry forward. On sale, claimed depreciation is recaptured at up to 25%, and gains may owe capital-gains tax (a 1031 exchange can defer both). Figures are a year-1 estimate at your 24.0% rate — not tax advice; consult a CPA.
Schools (NCES district)
- District
- El Paso ISD
- NCES district ID
- 4818300
- Math proficiency
- 27% ▼ -24.00%
- Reading proficiency
- 37% ▼ -7.00%
- Median HH income
- $38,704
- Composite
- 26.75/100
- National rank
- #7138
- State rank
- #591 of 826 in TX
Livability — El Paso
- Score
- 81/100
- State rank
- #23
- US rank
- #1375
Category grades
Schools grade is shown separately in the Schools card above.
Census & demographics
- Census place
- El Paso, TX
- County
- El Paso County · 761,266 people
- City population
- 630,223
- Metro
- El Paso, TX
- Population (ZIP)
- 60,364
- Household income
- $56,976
- Rent vs Own
- Severe rent burden
- 1903.0
Population outlook (El Paso County) Hauer SSP2
- Today (2025)
- 897,899 people
- By 2030
- 922,694 · +2.8%
- By 2040
- 960,492 · +7.0%
- By 2050
- 982,919 · +9.5%
- By 2075
- 997,266 · +11.1%
- By 2100
- 900,630 · +0.3%
Race, ethnicity, and origin ACS 2023
- Neighborhood character
- Predominantly Hispanic (72%)
- Race & ethnicity
- Hispanic / Latino 72% Two or more races 35% White 16% Black 7% Asian 1% Native American 1%
- Hispanic origin (detail)
- Mexican 66% Puerto Rican 2%
- Common ancestry
- Lithuanian 1% Italian 1% Romanian 1%
- Foreign-born
- 19% · Canada, South Korea
- Languages at home
- 42% English-only · Spanish 56% German/W. Germanic 1% Korean 1%
Political lean MEDSL · El Paso
- 2024 margin
- D (+15.1) · D 57.0% · R 41.8% · Other 1.2%
- 2008→2024 swing
- -17.4pp toward R · 2008: 32.5pp · 2024: 15.1pp
- All cycles
- 2024: D+15.1 2020: D+35.1 2016: D+43.2 2012: D+32.6 2008: D+32.5
Not yet ingested
- Civics
- —
Market trends
- HPI YoY
- ▼ -40.46%
- Current HPI
- 265.8729
- Rent YoY
- ▲ 4.50%
- Metro
- El Paso, TX
- State GDP YoY
- ▲ 3.95%
- F500 in state
- 110
Industry mix (Fortune 500 HQ in TX)
| Industry | F500 HQs | Revenue |
|---|---|---|
| Energy | 16 | $1,198B |
|
||
| Technology | 5 | $198B |
|
||
| Engineering / Construction | 4 | $72B |
|
||
| Energy Services | 3 | $60B |
|
||
| Utilities | 3 | $41B |
|
||
| Healthcare | 2 | $330B |
|
||
Price history
8 events — show timeline
- 2026-06-04 Listed $109,000 NTREIS
- 2026-04-16 Sold (Public Records) — Public Records
- 2026-04-16 Sold (Public Records) — Public Records
- 2026-04-16 Sold (Public Records) — Public Records
- 2026-04-16 Sold (Public Records) — Public Records
- 2026-04-01 Sold (Public Records) — Public Records
- 2026-04-01 Sold (Public Records) — Public Records
- 1988-05-16 Sold (Public Records) — Public Records
Property tax history
+11.4%/yrLatest (2025): $2,682 · +22.2% YoY. Source: county tax records.
Cash-flow waterfall
monthlySold comps — $/sqft
last 12 mo · ≤1 miLoading sold comps…