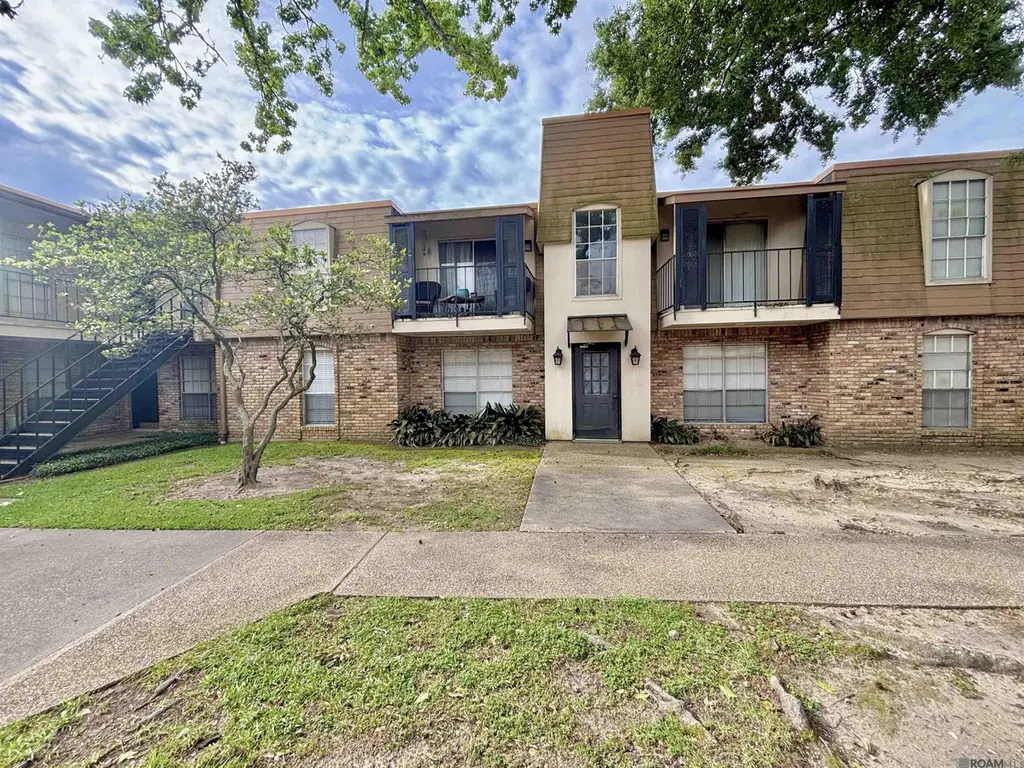
2100 College Dr #120 · Baton Rouge, LA
Flood risk 1/10 · Minimal
- FEMA flood zone
- X (unshaded)
- Chance of flooding over 30 yrs
- 0.0%
- Est. flood insurance / yr
- $507 – $1,088
Fire risk 1/10 · Minimal
- Est. fire insurance / yr
- $1,269 – $2,357
Heat risk 8/10 · Major
- Hot days now (above 108°F)
- 7 days/yr
- Hot days in 30 yrs
- 21 days/yr
Wind risk 9/10 · Severe
- Chance of severe wind over 30 yrs
- 99.0%
Air-quality risk 3/10 · Minor
- Unhealthy air days now
- 3 days/yr
- Unhealthy air days in 30 yrs
- 3 days/yr
Risk factors via First Street. Map © Google.
Why this score? — see what drove the C grade
The composite is a weighted blend of 9 inputs, each scored 0–100. Each bar is that input's sub-score; the figure is the points it added to the 100-point composite (weight × sub-score).
- Cash flow +21.7/30.0
- ARV discount +9.4/15.0
- 1% rule +8.4/10.0
- DSCR +6.9/10.0
- Livability +3.7/5.0
- Rent growth +2.9/5.0
- Condition / age +2.5/5.0
- Schools +2.4/10.0
- Appreciation +0.0/10.0
$75,000
🖨 Deal sheet 📄 Offer letter ✓ Due diligence
Listing remarks MLS
great 1 bed/1 bath condo in bienville towers! would be a great rental or spot for a student!
Key facts
- $193 HOA
- Community pool
- Built 1980
Property features AI
Finance
- Other: Subdivision: Bienville Towers; Community directions: Enter complex from entrance nearest Corporate Drive; park on the back side of the condos. Unit entry is in the middle courtyard; walk up to the second floor.
- HOA & community: Homeowners association with annual fee; Annual association fee $2,321 (approximately $193.42/month); HOA covers grounds maintenance and water
Exterior
- Parking: Assigned parking
- Utilities: Public water service; Public sewer service
- Home design: Residential condominium; Attached property; Second-floor entry (unit accessed via courtyard and up stairs)
- Construction: Stucco construction; Slab foundation
- Exterior features: Pool; Public water; Public sewer
Interior
- Bedrooms: Condominium (attached)
- Bathrooms: 1 full bathroom
- Interior features: Central heating; Central air conditioning
Neighborhood map
What this means for you Summary
Snapshot
- This is a 1-bed/1.0-bath condo listed at $75k.
Deal economics
- At list price, monthly cash flow is $116 ($1k/yr) — positive.
- The deal already cash-flows at list — no discount required.
- Meets the 1% rule at list price ($1k rent vs $75k).
- Recommended offer: $73k (3.0% below list) — sets the bar for market timing.
- Cap rate 8.1% vs local median 4.3% in Baton Rouge — top-decile yield for the area; either an underpriced asset or a hidden risk that comps aren't pricing in. Stress-test before assuming the spread holds.
Location & tenants
- Location reads 74/100 on livability (#24 in LA, #4,535 nationally) — a middle-class / working-renter tenant base. Strengths: commute A+, cost of living A+, health & safety A+; Watch: amenities D, crime F, employment D-.
- East Baton Rouge Parish (urban): math 22% / reading 34% proficiency, ranked #47 of 98 in LA (top 48%) — low school quality limits family demand, transient renter base, plan for 1-2y turnover; 77% free/reduced lunch — lower-income household profile, screen leases tightly.
- Market conditions: Rents rising (+1.5%/yr); 297 active listings in the ZIP; 17 comparable units currently listed for rent nearby; rentals at typical pace (median 14d on market — plan ~3-4 weeks tenant-placement turnaround); 2,252 units permitted in East Baton Rouge Parish in 2024 (440 in 5+ unit buildings).
- This rent is only 17% of the median local income ($69k/yr) — well below the 30% rent-burden line; pricing power to push rent on renewal without tenant pushback.
Forward outlook
- Local home prices are declining (-3.0%/yr); year-one equity from $519 of loan paydown is wiped out by about $2k of value loss. Plan a longer hold.
- East Baton Rouge County population projected at +4% by 2050 — modest demand growth; plan on rents tracking national, not racing it.
Negotiation context
- It's been on market 56 days — a 3% lower offer ($73k) is reasonable based on typical stale-listing flexibility.
- 5 sale attempts since 26y ago; this cycle's ask has dropped $4k (5%) from the opening price — seller is motivated, your offer sets the floor, not the list.
- Current owner paid $64k; 18% above their basis — modest negotiation headroom, anchor on the comps not their cost.
Risks & watch-outs
- Climate carrying-cost: severe wind risk, 99% chance of damaging wind over 30y; extreme-heat days projected 7→21/yr by 2055 (HVAC capex compounding) — expect insurance premiums to compound above CPI over the hold.
Questions for the listing agent
- It's been on market 56 days. Have you received any prior offers? Is the seller open to a 3% concession, seller financing, or rate buy-down credit?
- What does the HOA fee cover, when was the last increase, and are there any pending special assessments or reserve-fund shortfalls?
- Any open or pending special assessments — roof, HVAC, plumbing, elevator, façade? What's the per-unit balance and payoff schedule, and is the seller paying it off at close or rolling it to the buyer?
- Is there a deadline driving the sale (1031 exchange, divorce, estate, relocation)? That informs how much negotiation room exists.
- Crime grade is F in this area — have there been break-ins, vandalism, or insurance claims at this property in the last 3 years? What carrier currently insures it and at what premium?
- What's the average days-on-market for RENTAL listings here right now (not sales)? A rising rental-DOM trend means longer vacancies and softer asking-rent achievability than the comps imply.
- What's the recent tenant-quality profile in this submarket — average credit score on applications, eviction rate, late-payment / NSF rate, and stable-employment percentage? A property-management company in the area should have these aggregated.
- How much new apartment / multifamily construction is in the pipeline within 1–3 miles? Heavy new supply (>2% of stock underway) typically softens rents 12–24 months out; light construction supports rent growth.
Investment metrics
- 1% rule
- 1.34% ✓
- Cap rate
- 8.14%
- Cash-on-cash
- 6.61%
- DSCR
- 1.29
- GRM
- 6.2
CMA / ARV
- ARV (median comp)
- $78,290
- List price
- $75,000
- Delta
- -4.20%
- Verdict
- FAIR
- Comps
- 20 within 1.0 mi
Projected returns pro-forma
-3.0% appreciation · 1.54% rent growth · sell at horizon
- IRR
- -8.1%
- Equity multiple
- 0.71×
- Total profit
- $-6,130
- Equity at exit
- $11,183
- IRR
- -0.9%
- Equity multiple
- 0.94×
- Total profit
- $-1,198
- Equity at exit
- $6,485
Cash invested: $21,000 (down + closing). Projections, not guarantees.
Landlord ↔ Tenant lean methodology
- Overall (STATE)
- 90 Strongly Landlord-Friendly
- State Louisiana
- 90 Strongly Landlord-Friendly · R+12
- County
- — inherits STATE
- City
- — inherits STATE
ZIP-level market 70808
- Rents YoY
- 1.5%
- Active inventory
- 297
- Price-to-rent
- 6.2×
Monthly cashflow live
- Estimated rent
- $1,008 high interval (Pro) →
- Mortgage (P&I)
- −$393
- Tax from tax record
- −$63 /mo · $754/yr
- Insurance
- −$31
- HOA
- −$193
- Vacancy / Maint / Mgmt
- −$212
- Net cashflow
- $116
Break-even live
UW: 25.0% down · 7.5% · 30yr · 1.5% tax · 5.0% vac · 8.0% maint · 8.0% mgmt
Financing live
Cash to close
- Down payment
- $18,750
- Closing costs
- $2,250
- Reserves months
- —
- Total cash needed
- —
Loan-product check · same deal, 3 products live
Conventional
25% down · 7.5% · 30yr
- Down + closing
- —
- Monthly P&I
- —
- Monthly cashflow
- —
- DSCR
- —
- Eligible?
- —
Personal DTI + credit; lowest rate.
DSCR
20% down · 8.5% · 30yr
- Down + closing
- —
- Monthly P&I
- —
- Monthly cashflow
- —
- DSCR
- —
- Eligible?
- —
No personal income docs; deal must DSCR.
Hard money
10% down · 12.0% · 12mo
- Down + closing
- —
- Monthly P&I
- —
- Monthly cashflow
- —
- DSCR
- —
- Eligible?
- —
Short-term bridge; refi at stabilization.
Rent comps 17 comps
| Address | Beds | Baths | Sqft | Rent | $/sqft | DOM | Units | Dist |
|---|---|---|---|---|---|---|---|---|
| 2100 College Dr Baton Rouge, LA | 1.0–2.0 | 1.0–2.0 | 915 | $937 | $1.02 | 14d | 12 | 0.08mi |
| 2225 College Dr Baton Rouge, LA | 1.0–3.0 | 1.0–2.0 | 954 | $700 | $0.73 | 14d | 32 | 0.25mi |
| 5522 Corporate Blvd Baton Rouge, LA | 1.0 | 1.0–2.0 | 708 | $1,085 | $1.53 | 14d | 4 | 0.33mi |
| 1100 S Foster Dr Baton Rouge, LA | 1.0–2.0 | 1.0–1.5 | 795 | $885 | $1.11 | 14d | 3 | 0.63mi |
| 950 S Foster Dr Baton Rouge, LA | 1.0–2.0 | 1.0–2.0 | 888 | $825 | $0.93 | 14d | 1 | 0.75mi |
| 6929 Commerce Cir Baton Rouge, LA | 1.0–2.0 | 1.0–2.0 | 969 | $1,231 | $1.27 | 14d | 16 | 0.81mi |
| 5000 Claycut Rd Baton Rouge, LA | 1.0–4.0 | 1.0–2.5 | 1600 | $920 | $0.57 | 14d | 1 | 0.85mi |
| 6810 Jefferson Hwy Baton Rouge, LA | 1.0–3.0 | 1.0–2.0 | 1051 | $1,269 | $1.21 | 14d | 29 | 0.96mi |
| 605 Ingleside Dr Unit A Baton Rouge, LA | 2.0 | 1.0 | 700 | $1,350 | $1.93 | 43d | 1 | 1.17mi |
| 450 Cloud Dr Baton Rouge, LA | 1.0–2.0 | 1.0 | 649 | $635 | $0.98 | 23d | 1 | 1.17mi |
| 849 Blanchard St Baton Rouge, LA | 1.0 | 1.0 | 600 | $1,000 | $1.67 | 23d | 1 | 1.18mi |
| 849 Blanchard St Baton Rouge, LA | 1.0 | 1.0 | 600 | $1,000 | $1.67 | 43d | 1 | 1.18mi |
| 4735 Government St #102 Baton Rouge, LA | 1.0 | 1.0 | 690 | $875 | $1.27 | 14d | 1 | 1.20mi |
| 330 Ingleside Dr Baton Rouge, LA | 1.0–3.0 | 1.0–2.0 | 773 | $887 | $1.15 | 14d | 6 | 1.34mi |
| 4430 Hatcher Ave Unit 115 Baton Rouge, LA | 1.0 | 1.0 | 598 | $900 | $1.51 | 43d | 1 | 1.36mi |
| 5500 Perkins Rd Baton Rouge, LA | 1.0–2.0 | 1.0–2.0 | 940 | $1,235 | $1.31 | 14d | 29 | 1.45mi |
| 115 S Leo St Baton Rouge, LA | 1.0 | 1.0 | 550 | $1,100 | $2.00 | 23d | 1 | 1.48mi |
HOA detail condo
- Monthly dues
- $193 · $2,316/yr
- Assessments
- None detected in remarks — confirm with the listing agent.
Listing history 24 events
-
2026-06-18days on market $75,000 Active 56 DOM
-
2026-06-17days on market $75,000 Active 55 DOM
-
2026-06-16days on market $75,000 Active 54 DOM
-
2026-06-15days on market $75,000 Active 53 DOM
-
2026-06-14pricedays on market $75,000 Active 51 DOM
-
2026-06-10days on market $79,000 Active 48 DOM
-
2026-06-09days on market $79,000 Active 47 DOM
-
2026-06-08days on market $79,000 Active 46 DOM
-
2026-06-07days on market $79,000 Active 45 DOM
-
2026-06-05days on market $79,000 Active 42 DOM
-
2026-06-03days on market $79,000 Active 41 DOM
-
2026-06-02days on market $79,000 Active 40 DOM
-
2026-06-01days on market $79,000 Active 39 DOM
-
2026-05-31days on market $79,000 Active 38 DOM
-
2026-05-31days on market $79,000 Active 37 DOM
-
2026-04-23$79,000 Active 92-char remark
Show marketing remark (92 chars)
great 1 bed/1 bath condo in bienville towers! would be a great rental or spot for a student!
-
2026-04-23$79,000 Active 92-char remark
Show marketing remark (92 chars)
great 1 bed/1 bath condo in bienville towers! would be a great rental or spot for a student!
-
2015-07-01soldstatus $63,500
-
2011-09-06$72,500
-
2011-09-06$72,500
-
2006-03-03soldstatus $60,000
-
2000-08-18soldstatus
-
2000-08-14soldstatus
-
2000-07-21$42,000
ⓘ Source: listings_history table (triggers on properties + properties_extension) + one-shot
backfill from property_details.listing_events for pre-trigger history.
Tax reassessment forecast LA · Resets to sale price
- Current annual tax
- $754 · $63/mo
- Projected year-2 tax
- $754 · $63/mo
- Expected delta
- $0/yr ($0/mo · 0.0%)
ⓘ Screening estimate from a state-policy table — verify with the county assessor before closing.
Climate risk First Street
- Flood 1/10 Low FEMA zone X (unshaded) · 0% chance over 30 yrs
- Wildfire 1/10 Low
- Heat 8/10 Severe 7 d/yr ≥108°F today · 21 d/yr by 30 yrs out
- Wind 9/10 Extreme 99% chance of damaging wind over 30 yrs
- Air quality 3/10 Moderate 3 unhealthy d/yr today · 3 by 30 yrs out
Nearby sold comps map
Loading sold comps map…
Walkable amenities ~0.75 mi
Loading nearby amenities…
Taxation est. · year 1
- Rental income
- $12,092
- − Mortgage interest
- −$4,201
- − Property taxes
- −$754
- − Insurance
- −$375
- − Repairs & maintenance
- −$967
- − Management
- −$967
- − HOA
- −$2,316
- − Depreciation
- −$2,182
- Taxable income
- $330
- Est. tax owed @ 24.0%
- −$79
- After-tax cash flow
- $1,309/yr
For passive investors: Depreciation is non-cash, so a rental often shows a tax loss while cash-flowing — sheltering income. Rental losses are passive: they offset passive income freely, and up to $25,000/yr can offset ordinary (W-2) income if you actively participate and your MAGI is under $100k (phasing out to $0 by $150k); unused losses carry forward. On sale, claimed depreciation is recaptured at up to 25%, and gains may owe capital-gains tax (a 1031 exchange can defer both). Figures are a year-1 estimate at your 24.0% rate — not tax advice; consult a CPA.
Schools (NCES district)
- District
- East Baton Rouge Parish
- NCES district ID
- 2200540
- Math proficiency
- 22% ▼ -36.00%
- Reading proficiency
- 34% ▼ -31.00%
- Median HH income
- $46,263
- Composite
- 24.14/100
- National rank
- #7745
- State rank
- #47 of 98 in LA
Livability — Baton Rouge
- Score
- 74/100
- State rank
- #24
- US rank
- #4535
Category grades
Schools grade is shown separately in the Schools card above.
Census & demographics
- Census place
- Baton Rouge, LA
- County
- East Baton Rouge Parish · 399,686 people
- City population
- 351,868
- Metro
- Baton Rouge, LA
- Population (ZIP)
- 35,843
- Household income
- $69,418
- Rent vs Own
- Severe rent burden
- 2545.0
Population outlook (East Baton Rouge County) Hauer SSP2
- Today (2025)
- 464,810 people
- By 2030
- 472,137 · +1.6%
- By 2040
- 480,243 · +3.3%
- By 2050
- 484,422 · +4.2%
- By 2075
- 492,069 · +5.9%
- By 2100
- 476,347 · +2.5%
Race, ethnicity, and origin ACS 2023
- Neighborhood character
- Predominantly White (66%)
- Race & ethnicity
- White 66% Black 20% Two or more races 7% Hispanic / Latino 6% Asian 5%
- Hispanic origin (detail)
- Mexican 1%
- Common ancestry
- Lithuanian 12% Slovak 2% Romanian 2%
- Foreign-born
- 8% · Canada, China, Vietnam
- Languages at home
- 90% English-only · Spanish 2% French/Haitian/Cajun 2% Other Indo-European 1%
Political lean MEDSL · East Baton Rouge
- 2024 margin
- D (+11.1) · D 54.5% · R 43.4% · Other 2.1%
- 2008→2024 swing
- +8.9pp toward D · 2008: 2.2pp · 2024: 11.1pp
- All cycles
- 2024: D+11.1 2020: D+13.1 2016: D+9.2 2012: D+5.2 2008: D+2.2
Not yet ingested
- Civics
- —
Market trends
- HPI YoY
- ▼ -351.73%
- Current HPI
- 196.4406
- Rent YoY
- ▲ 1.54%
- Metro
- Baton Rouge, LA
- State GDP YoY
- ▲ 3.29%
- F500 in state
- 10
Industry mix (Fortune 500 HQ in LA)
| Industry | F500 HQs | Revenue |
|---|---|---|
| Telecommunications | 2 | $23B |
|
||
| Utilities | 1 | $12B |
|
||
| Wholesale / Distribution | 1 | $5B |
|
||
| Advertising | 1 | $2B |
|
||
Price history
+78.6% since first listed11 events — show timeline
- 2026-06-12 Price Changed $75,000 AcadianaMLS
- 2026-06-12 Price Changed $75,000 GBRMLS
- 2026-04-23 Listed $79,000 GBRMLS
- 2026-04-23 Listed $79,000 AcadianaMLS
- 2015-07-01 Sold (Public Records) $63,500 Public Records
- 2011-09-06 Listed $72,500 AcadianaMLS
- 2011-09-06 Listed $72,500 GBRMLS
- 2006-03-03 Sold (Public Records) $60,000 Public Records
- 2000-08-18 Sold (Public Records) — Public Records
- 2000-08-14 Sold (MLS) — GBRMLS
- 2000-07-21 Listed $42,000 GBRMLS
Property tax history
+0.7%/yrLatest (2025): $754 · +4.7% YoY. Source: county tax records.
Cash-flow waterfall
monthlySold comps — $/sqft
last 12 mo · ≤1 miLoading sold comps…