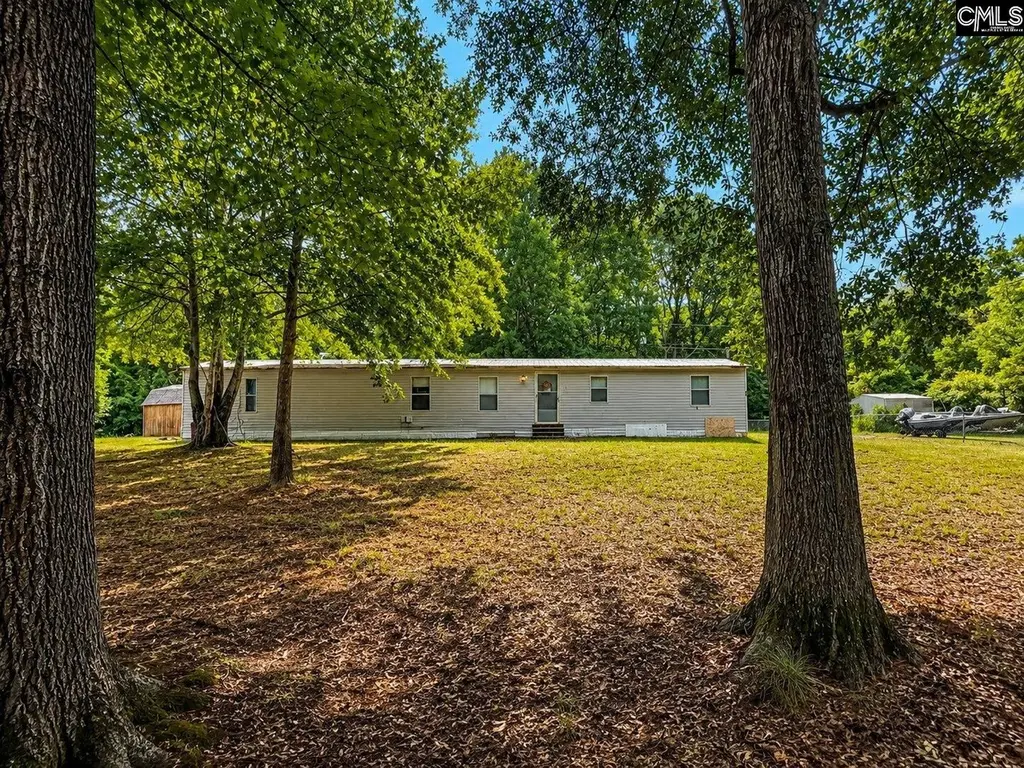
126 Crawford St · Piedmont, SC
Flood risk 1/10 · Minimal
- FEMA flood zone
- X (unshaded)
- Chance of flooding over 30 yrs
- 0.0%
- Est. flood insurance / yr
- $507 – $1,088
Fire risk 4/10 · Minor
- Est. fire insurance / yr
- $783 – $1,453
Heat risk 5/10 · Moderate
- Hot days now (above 105°F)
- 7 days/yr
- Hot days in 30 yrs
- 17 days/yr
Wind risk 2/10 · Minimal
- Chance of severe wind over 30 yrs
- 1.0%
Air-quality risk 4/10 · Minor
- Unhealthy air days now
- 3 days/yr
- Unhealthy air days in 30 yrs
- 4 days/yr
Risk factors via First Street. Map © Google.
Why this score? — see what drove the B grade
The composite is a weighted blend of 9 inputs, each scored 0–100. Each bar is that input's sub-score; the figure is the points it added to the 100-point composite (weight × sub-score).
- Cash flow +30.0/30.0
- 1% rule +10.0/10.0
- DSCR +10.0/10.0
- ARV discount +7.5/15.0
- Schools +5.0/10.0
- Livability +3.2/5.0
- Condition / age +2.5/5.0
- Rent growth +1.8/5.0
- Appreciation +0.0/10.0
$94,900
🖨 Deal sheet 📄 Offer letter ✓ Due diligence
Listing remarks
Escape to serenity in this charming country living home. Experience the perfect blend of comfort, affordability and country charm in this 3 bedroom 1 bath manufactured home. Nestled on a spacious lot, this property offers privacy and the peaceful lifestyle you've been dreaming of. Disclaimer: CMLS has not reviewed and, therefore, does not endorse vendors who may appear in listings.
Key facts
- Privacy
- Spacious lot
- 0.71 acre lot
Tags
Property features AI
Exterior
- Utilities: Public water; Septic sewer
- Home design: Single-family style property on a 0.71-acre lot
- Construction: Crawlspace foundation
- Exterior features: Vinyl exterior finish; Gravel road access
Interior
- Bedrooms: Primary bedroom on the main level
- Bathrooms: One full bathroom
- Heating & cooling: Electric heating; Wall-mounted cooling units
- Interior features: Total heated area about 925
Neighborhood map
What this means for you Summary
Snapshot
- This is a 3-bed/1.0-bath manufactured listed at $95k.
Deal economics
- At list price, monthly cash flow is $592 ($7k/yr) — positive.
- The deal already cash-flows at list — no discount required.
- Meets the 1% rule at list price ($2k rent vs $95k).
- Cap rate 13.8% vs local median 3.4% in Piedmont — top-decile yield for the area; either an underpriced asset or a hidden risk that comps aren't pricing in. Stress-test before assuming the spread holds.
Location & tenants
- Location reads 64/100 on livability (#160 in SC) — a middle-class / working-renter tenant base. Strengths: cost of living A+, housing A+; Watch: employment D+, schools D, crime D.
- Anderson 01 (rural): math 58% / reading 60% proficiency, ranked #3 of 80 in SC (top 4%) — acceptable for families but not a draw, mixed tenant base, ~2y average lease.
- Market conditions: Rents soft (-2.7%/yr); 535 active listings in the ZIP; 1,255 units permitted in Anderson County in 2024 (0 in 5+ unit buildings).
Forward outlook
- Local home prices are declining (-3.0%/yr); year-one equity from $656 of loan paydown is wiped out by about $3k of value loss. Plan a longer hold.
- Anderson County population projected at +14% by 2050 — modest demand growth; plan on rents tracking national, not racing it.
- At projected returns (-3.0% appreciation + 0.0% rent growth), your $27k cash investment doubles in ~6 years — after that, you're playing with house money.
Negotiation context
- Only 5 days on market — expect competitive offers; lowballing is unlikely to land.
- Current owner paid $35k; list at $95k implies a 172% gain — meaningful room to come down on a strong offer.
Risks & watch-outs
- Climate carrying-cost: extreme-heat days projected 7→17/yr by 2055 (HVAC capex compounding) — expect insurance premiums to compound above CPI over the hold.
Questions for the listing agent
- Is there a deadline driving the sale (1031 exchange, divorce, estate, relocation)? That informs how much negotiation room exists.
- Schools are D-rated, which usually means shorter tenancies and higher turnover. Who's the typical renter profile here, and what's been the actual vacancy rate?
- Crime grade is D in this area — have there been break-ins, vandalism, or insurance claims at this property in the last 3 years? What carrier currently insures it and at what premium?
- What's the average days-on-market for RENTAL listings here right now (not sales)? A rising rental-DOM trend means longer vacancies and softer asking-rent achievability than the comps imply.
- What's the recent tenant-quality profile in this submarket — average credit score on applications, eviction rate, late-payment / NSF rate, and stable-employment percentage? A property-management company in the area should have these aggregated.
- How much new for-sale + rental construction is in the pipeline within 1–3 miles? Heavy new supply typically softens prices + rents 12–24 months out; constrained supply supports both.
Investment metrics
- 1% rule
- 1.66% ✓
- Cap rate
- 13.78%
- Cash-on-cash
- 26.74%
- DSCR
- 2.19
- GRM
- 5.0
CMA / ARV
No comps found within radius.
Projected returns pro-forma
-3.0% appreciation · 0.0% rent growth · sell at horizon
- IRR
- 17.2%
- Equity multiple
- 1.67×
- Total profit
- $17,735
- Equity at exit
- $14,150
- IRR
- 23.4%
- Equity multiple
- 2.74×
- Total profit
- $46,216
- Equity at exit
- $8,205
Cash invested: $26,572 (down + closing). Projections, not guarantees.
Landlord ↔ Tenant lean methodology
- Overall (STATE)
- 90 Strongly Landlord-Friendly
- State South Carolina
- 90 Strongly Landlord-Friendly · R+6
- County
- — inherits STATE
- City
- — inherits STATE
ZIP-level market 29673
- Home prices YoY
- -28.0%
- Rents YoY
- -2.7%
- Active inventory
- 535
- Price-to-rent
- 5.0×
Monthly cashflow live
- Estimated rent
- $1,580 medium interval (Pro) →
- Mortgage (P&I)
- −$498
- Tax est. 1.5%
- −$119 /mo · $1,424/yr
- Insurance
- −$40
- HOA
- −$0
- Vacancy / Maint / Mgmt
- −$332
- Net cashflow
- $592
Break-even live
UW: 25.0% down · 7.5% · 30yr · 1.5% tax · 5.0% vac · 8.0% maint · 8.0% mgmt
Financing live
Cash to close
- Down payment
- $23,725
- Closing costs
- $2,847
- Reserves months
- —
- Total cash needed
- —
Loan-product check · same deal, 3 products live
Conventional
25% down · 7.5% · 30yr
- Down + closing
- —
- Monthly P&I
- —
- Monthly cashflow
- —
- DSCR
- —
- Eligible?
- —
Personal DTI + credit; lowest rate.
DSCR
20% down · 8.5% · 30yr
- Down + closing
- —
- Monthly P&I
- —
- Monthly cashflow
- —
- DSCR
- —
- Eligible?
- —
No personal income docs; deal must DSCR.
Hard money
10% down · 12.0% · 12mo
- Down + closing
- —
- Monthly P&I
- —
- Monthly cashflow
- —
- DSCR
- —
- Eligible?
- —
Short-term bridge; refi at stabilization.
Listing history 5 events
-
2026-06-01days on market $94,900 Active 5 DOM
-
2026-05-31days on market $94,900 Active 4 DOM
-
2026-05-26$94,900 Active
-
1999-08-02soldstatus $34,900
-
1996-10-11soldstatus $26,000
ⓘ Source: listings_history table (triggers on properties + properties_extension) + one-shot
backfill from property_details.listing_events for pre-trigger history.
Climate risk First Street
- Flood 1/10 Low FEMA zone X (unshaded) · 0% chance over 30 yrs
- Wildfire 4/10 Moderate
- Heat 5/10 Major 7 d/yr ≥105°F today · 17 d/yr by 30 yrs out
- Wind 2/10 Low 100% chance of damaging wind over 30 yrs
- Air quality 4/10 Moderate 3 unhealthy d/yr today · 4 by 30 yrs out
Nearby sold comps map
Loading sold comps map…
Walkable amenities ~0.75 mi
Loading nearby amenities…
Taxation est. · year 1
- Rental income
- $18,958
- − Mortgage interest
- −$5,316
- − Property taxes
- −$1,424
- − Insurance
- −$474
- − Repairs & maintenance
- −$1,517
- − Management
- −$1,517
- − Depreciation
- −$2,761
- Taxable income
- $5,950
- Est. tax owed @ 24.0%
- −$1,428
- After-tax cash flow
- $5,679/yr
For passive investors: Depreciation is non-cash, so a rental often shows a tax loss while cash-flowing — sheltering income. Rental losses are passive: they offset passive income freely, and up to $25,000/yr can offset ordinary (W-2) income if you actively participate and your MAGI is under $100k (phasing out to $0 by $150k); unused losses carry forward. On sale, claimed depreciation is recaptured at up to 25%, and gains may owe capital-gains tax (a 1031 exchange can defer both). Figures are a year-1 estimate at your 24.0% rate — not tax advice; consult a CPA.
Schools (NCES district)
- District
- Anderson 01
- NCES district ID
- 4500780
- Math proficiency
- 58% ▼ -6.00%
- Reading proficiency
- 60% ▼ -1.00%
- Median HH income
- $52,196
- Composite
- 50.46/100
- National rank
- #1861
- State rank
- #3 of 80 in SC
Livability — Piedmont
- Score
- 64/100
- State rank
- #160
- US rank
- #14725
Category grades
Schools grade is shown separately in the Schools card above.
Census & demographics
- Census place
- Piedmont, SC
- County
- Greenville County · 573,815 people
- City population
- 30,461
- Metro
- Greenville-Anderson, SC
- Population (ZIP)
- 30,461
- Household income
- $71,444
- Rent vs Own
- Severe rent burden
- 499.0
Population outlook (Anderson County) Hauer SSP2
- Today (2025)
- 210,546 people
- By 2030
- 217,791 · +3.4%
- By 2040
- 230,643 · +9.5%
- By 2050
- 240,220 · +14.1%
- By 2075
- 259,518 · +23.3%
- By 2100
- 258,696 · +22.9%
Race, ethnicity, and origin ACS 2023
- Neighborhood character
- Predominantly White (68%)
- Race & ethnicity
- White 68% Black 18% Two or more races 9% Hispanic / Latino 7% Asian 2%
- Hispanic origin (detail)
- Mexican 3%
- Common ancestry
- Slovak 3% Serbian 1% Lithuanian 1%
- Foreign-born
- 4% · Canada
- Languages at home
- 94% English-only · Spanish 4% German/W. Germanic 1% Other Indo-European 1%
Political lean MEDSL · Anderson
- 2024 margin
- Solid R (+47.4) · D 25.7% · R 73.1% · Other 1.2%
- 2008→2024 swing
- -14.1pp toward R · 2008: -33.3pp · 2024: -47.4pp
- All cycles
- 2024: R+47.4 2020: R+42.0 2016: R+43.7 2012: R+36.4 2008: R+33.3
Not yet ingested
- Civics
- —
Market trends
- HPI YoY
- ▼ -92.86%
- Current HPI
- 238.4347
- Rent YoY
- ▼ -2.71%
- Metro
- Greenville-Anderson, SC
- State GDP YoY
- ▲ 4.51%
- F500 in state
- 2
Industry mix (Fortune 500 HQ in SC)
| Industry | F500 HQs | Revenue |
|---|---|---|
| Packaging | 1 | $7B |
|
||
Price history
+265.0% since first listed3 events — show timeline
- 2026-05-26 Listed $94,900 Consolidated MLS
- 1999-08-02 Sold (Public Records) $34,900 Public Records
- 1996-10-11 Sold (Public Records) $26,000 Public Records
Property tax history
+0.0%/yrLatest (2022): $40 · +0.0% YoY. Source: county tax records.
Cash-flow waterfall
monthlySold comps — $/sqft
last 12 mo · ≤1 miLoading sold comps…