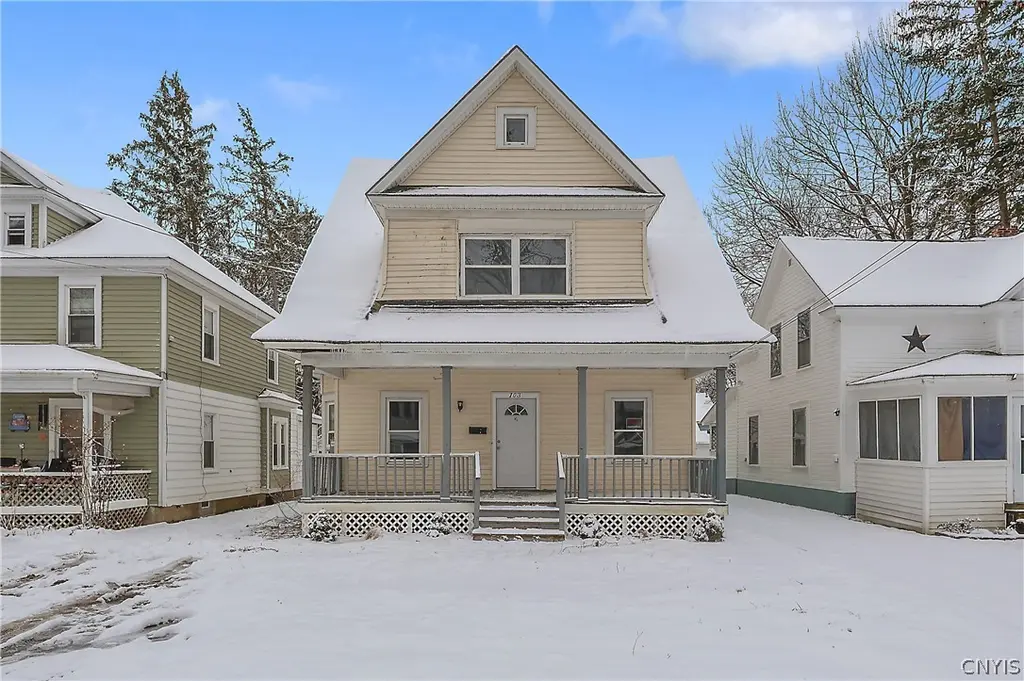
103 Meredith Ave · Nedrow, NY
Flood risk 1/10 · Minimal
- FEMA flood zone
- X (unshaded)
- Chance of flooding over 30 yrs
- 0.0%
- Est. flood insurance / yr
- $473 – $860
Fire risk 1/10 · Minimal
- Est. fire insurance / yr
- $691 – $1,283
Heat risk 3/10 · Minor
- Hot days now (above 93°F)
- 7 days/yr
- Hot days in 30 yrs
- 17 days/yr
Wind risk 1/10 · Minimal
- Chance of severe wind over 30 yrs
- 0.0%
Air-quality risk 2/10 · Minimal
- Unhealthy air days now
- 0 days/yr
- Unhealthy air days in 30 yrs
- 1 days/yr
Risk factors via First Street. Map © Google.
Why this score? — see what drove the C- grade
The composite is a weighted blend of 9 inputs, each scored 0–100. Each bar is that input's sub-score; the figure is the points it added to the 100-point composite (weight × sub-score).
- ARV discount +11.8/15.0
- Cash flow +11.6/30.0
- Appreciation +9.1/10.0
- Schools +5.0/10.0
- Livability +3.6/5.0
- 1% rule +3.5/10.0
- DSCR +3.4/10.0
- Rent growth +2.5/5.0
- Condition / age +2.5/5.0
$184,900
🖨 Deal sheet (PDF) 📄 Offer letter ✓ Due diligence
Listing remarks
Welcome Home! Check out this spectacular 3 bedroom 2 full bath home with many modern features. The front entrance brings you in through a covered front porch and into a large living room the width of the home with lots of space and built in bench. This leads into the formal dining room, hosting plenty of room for a sizeable table and great space for hosting guests. Off of the dining room there is a completely updated full bathroom. And then from the dining room, into the updated kitchen with new cabinets, countertops and lighting. There is also a laundry room off the kitchen, for an added convenience. Upstairs there are 3 generous sized bedrooms and another updated full bathroom with tiled
Key facts
- Covered front porch
- Built in bench
- Formal dining room
Tags
Neighborhood map
What this means for you Summary
Snapshot
- This is a 5-bed/1.0-bath single-family listed at $185k.
Deal economics
- At list price, monthly cash flow is $-58 ($-702/yr) — negative.
- To cash-flow at today's rent, offer at most $175k (5.6% below list).
- To meet the 1% rule (rent ≥ 1% of price), the offer needs to be $157k (15.0% below list).
- Recommended offer: $157k (15.0% below list) — sets the bar for 1% rule.
Location & tenants
- Location reads 71/100 on livability (#415 in NY) — a middle-class / working-renter tenant base. Strengths: cost of living A+, housing A+, health & safety A; Watch: employment C-, amenities F, commute F.
- Onondaga Central School District (rural): math 54% / reading 61% proficiency, ranked #261 of 590 in NY (top 44%) — acceptable for families but not a draw, mixed tenant base, ~2y average lease.
- Zoned schools: Wheeler Elementary School (math 47% / reading 62%, grade C, #908 of 2,108 statewide, top 46%, 233 students, 54% FRL); Onondaga Senior High School (math 62% / reading 67%, grade B-, #776 of 1,100 statewide, top 73%, 327 students, 50% FRL) — zoned schools average 52% FRL vs 30% district-wide (22 pts higher); higher-poverty schools than district average — tighter screening recommended.
- Market conditions: 9 active listings in the ZIP; 616 units permitted in Onondaga County in 2024 (256 in 5+ unit buildings).
Forward outlook
- In year one you build about $16k of equity ($1k loan paydown + $15k appreciation (8.1% local appreciation)).
- Onondaga County population projected to shrink 9% by 2050 — rents likely to lag national; underwrite the cash flow, not the appreciation.
- At projected returns (8.1% appreciation + 3.0% rent growth), your $52k cash investment doubles in ~3 years — after that, you're playing with house money.
- By year 3, paydown + projected appreciation supports a ~$41k cash-out refi (75% LTV) — recoverable capital for the next deal without selling this one.
Negotiation context
- It's been on market 94 days — a 9% lower offer ($168k) is reasonable based on typical stale-listing flexibility.
Risks & watch-outs
- Watch-outs: built in 1890 — expect roof / HVAC / electrical / plumbing capex.
Questions for the listing agent
- What do current leases actually rent for vs. the listed asking? Can we see a recent rent roll and the last 12 months of T-12 income?
- It's been on market 94 days. Have you received any prior offers? Is the seller open to a 15% concession, seller financing, or rate buy-down credit?
- Built in 1890 — when were the roof, HVAC, electrical panel, plumbing, and water heater last replaced?
- Why hasn't it sold? Are there any deal-killer items the seller is aware of (foundation, flood, title, zoning, code violations)?
- Is there a deadline driving the sale (1031 exchange, divorce, estate, relocation)? That informs how much negotiation room exists.
- Schools are D-rated, which usually means shorter tenancies and higher turnover. Who's the typical renter profile here, and what's been the actual vacancy rate?
- What's the average days-on-market for RENTAL listings here right now (not sales)? A rising rental-DOM trend means longer vacancies and softer asking-rent achievability than the comps imply.
- What's the recent tenant-quality profile in this submarket — average credit score on applications, eviction rate, late-payment / NSF rate, and stable-employment percentage? A property-management company in the area should have these aggregated.
- How much new for-sale + rental construction is in the pipeline within 1–3 miles? Heavy new supply typically softens prices + rents 12–24 months out; constrained supply supports both.
Investment metrics
- 1% rule
- 0.85% ✗
- Cap rate
- 5.91%
- Cash-on-cash
- -1.36%
- DSCR
- 0.94
- GRM
- 9.8
CMA / ARV
- ARV (on-the-fly)
- $204,660
- Comps found
- 5
Show comp detail 5 sales within ~0.75 mi
| Address | Dist | Beds/Ba | Sqft | Sold | Price | $/sf | Match |
|---|---|---|---|---|---|---|---|
| 222 Hoover Dr | 0.52mi | 4/2.0 (-1) | 1,460 (-4%) | 8mo | $197,000 | $135 | 54 |
| 132 Wendell Ave | 0.17mi | 4/2.0 (-1) | 1,300 (-14%) | 9mo | $167,500 | $129 | 52 |
| 104 W Roswell Ave | 0.17mi | 4/1.0 (-1) | 1,330 (-12%) | 18mo | $65,000 | $49 | 52 |
| 6408 S Salina St | 0.12mi | 4/2.0 (-1) | 1,290 (-15%) | 17mo | $210,000 | $163 | 46 |
| 220 Hoover Dr | 0.51mi | 4/1.5 (-1) | 1,308 (-14%) | 5mo | $179,900 | $138 | 42 |
Match score weights: distance 35% · size 25% · config 20% · recency 20%. Top-matched comps best support the ARV.
Projected returns pro-forma
8.13% appreciation · 3.0% rent growth · sell at horizon
- IRR
- 19.3%
- Equity multiple
- 2.43×
- Total profit
- $74,011
- Equity at exit
- $142,099
- IRR
- 18.0%
- Equity multiple
- 5.20×
- Total profit
- $217,644
- Equity at exit
- $283,631
Cash invested: $51,772 (down + closing). Projections, not guarantees.
Landlord ↔ Tenant lean methodology
- Overall (STATE)
- 15 Strongly Tenant-Friendly
- State New York
- 15 Strongly Tenant-Friendly · D+10
- County
- — inherits STATE
- City
- — inherits STATE
ZIP-level market 13120
- Home prices YoY
- 2.9%
- Active inventory
- 9
- Price-to-rent
- 9.8×
Monthly cashflow live
- Estimated rent
- $1,572 medium interval (Pro) →
- Mortgage (P&I)
- −$970
- Tax from tax record
- −$254 /mo · $3,048/yr
- Insurance
- −$77
- HOA
- −$0
- Vacancy / Maint / Mgmt
- −$330
- Net cashflow
- $-58
Break-even live
Sensitivity live
| Price | -10% $46 | -5% $-6 | +0% $-58 | +5% $-111 | +10% $-163 |
|---|---|---|---|---|---|
| Rent | -10% $-183 | -5% $-121 | +0% $-58 | +5% $4 | +10% $66 |
| Rate | -1.0pp $35 | -0.5pp $-11 | base $-58 | +0.5pp $-106 | +1.0pp $-155 |
UW: 25.0% down · 7.5% · 30yr · 1.5% tax · 5.0% vac · 8.0% maint · 8.0% mgmt
Financing live
Cash to close
- Down payment
- $46,225
- Closing costs
- $5,547
- Reserves months
- —
- Total cash needed
- —
Loan-product check · same deal, 3 products live
Conventional
25% down · 7.5% · 30yr
- Down + closing
- —
- Monthly P&I
- —
- Monthly cashflow
- —
- DSCR
- —
- Eligible?
- —
Personal DTI + credit; lowest rate.
DSCR
20% down · 8.5% · 30yr
- Down + closing
- —
- Monthly P&I
- —
- Monthly cashflow
- —
- DSCR
- —
- Eligible?
- —
No personal income docs; deal must DSCR.
Hard money
10% down · 12.0% · 12mo
- Down + closing
- —
- Monthly P&I
- —
- Monthly cashflow
- —
- DSCR
- —
- Eligible?
- —
Short-term bridge; refi at stabilization.
Listing history 19 events
-
2026-06-21days on market $184,900 Active 94 DOM
-
2026-06-18days on market $184,900 Active 91 DOM
-
2026-06-17days on market $184,900 Active 90 DOM
-
2026-06-16days on market $184,900 Active 89 DOM
-
2026-06-15days on market $184,900 Active 88 DOM
-
2026-06-14days on market $184,900 Active 86 DOM
-
2026-06-13days on market $184,900 Active 85 DOM
-
2026-06-10statusdays on market $184,900 Active 83 DOM
-
2026-06-09days on market $184,900 Active Under Contract 82 DOM
-
2026-06-08days on market $184,900 Active Under Contract 81 DOM
-
2026-06-07days on market $184,900 Active Under Contract 80 DOM
-
2026-06-05days on market $184,900 Active Under Contract 77 DOM
-
2026-06-03days on market $184,900 Active Under Contract 76 DOM
-
2026-06-02days on market $184,900 Active Under Contract 75 DOM
-
2026-06-01days on market $184,900 Active Under Contract 74 DOM
-
2026-05-31days on market $184,900 Active Under Contract 73 DOM
-
2026-05-30days on market $184,900 Active Under Contract 72 DOM
-
2026-03-31historical Active Under Contract
-
2026-03-19$184,900 Active
ⓘ Source: listings_history table (triggers on properties + properties_extension) + one-shot
backfill from property_details.listing_events for pre-trigger history.
Tax reassessment forecast NY · Partial reset (capped growth)
- Current annual tax
- $3,048 · $254/mo
- Projected year-2 tax
- $3,086 · $257/mo
- Expected delta
- +$38/yr (+$3/mo · 1.3%)
ⓘ Screening estimate from a state-policy table — verify with the county assessor before closing.
Climate risk First Street
- Flood 1/10 Low FEMA zone X (unshaded) · 0% chance over 30 yrs
- Wildfire 1/10 Low
- Heat 3/10 Moderate 7 d/yr ≥93°F today · 17 d/yr by 30 yrs out
- Wind 1/10 Low 0% chance of damaging wind over 30 yrs
- Air quality 2/10 Low 0 unhealthy d/yr today · 1 by 30 yrs out
Nearby sold comps map
Loading sold comps map…
Walkable amenities ~0.75 mi
Loading nearby amenities…
Taxation est. · year 1
- Rental income
- $18,869
- − Mortgage interest
- −$10,357
- − Property taxes
- −$3,048
- − Insurance
- −$924
- − Repairs & maintenance
- −$1,510
- − Management
- −$1,510
- − Depreciation
- −$5,379
- Taxable loss
- −$3,859
- Est. tax savings @ 24.0%
- +$926
- After-tax cash flow
- $225/yr
For passive investors: Depreciation is non-cash, so a rental often shows a tax loss while cash-flowing — sheltering income. Rental losses are passive: they offset passive income freely, and up to $25,000/yr can offset ordinary (W-2) income if you actively participate and your MAGI is under $100k (phasing out to $0 by $150k); unused losses carry forward. On sale, claimed depreciation is recaptured at up to 25%, and gains may owe capital-gains tax (a 1031 exchange can defer both). Figures are a year-1 estimate at your 24.0% rate — not tax advice; consult a CPA.
Schools (NCES district)
- District
- Onondaga Central School District
- NCES district ID
- 3621810
- Math proficiency
- 54% ▼ -5.00%
- Reading proficiency
- 61% ▲ 16.00%
- Median HH income
- $60,148
- Composite
- 49.95/100
- National rank
- #1929
- State rank
- #261 of 590 in NY
Livability — Nedrow
- Score
- 71/100
- State rank
- #415
- US rank
- #7218
Category grades
Schools grade is shown separately in the Schools card above.
Census & demographics
- Census place
- Nedrow, NY
- Population (ZIP)
- 1,881
Population outlook (Onondaga County) Hauer SSP2
- Today (2025)
- 467,894 people
- By 2030
- 463,381 · -1.0%
- By 2040
- 447,697 · -4.3%
- By 2050
- 426,399 · -8.9%
- By 2075
- 373,661 · -20.1%
- By 2100
- 307,967 · -34.2%
Race, ethnicity, and origin ACS 2023
- Neighborhood character
- Predominantly White (69%)
- Race & ethnicity
- White 69% Native American 21% Black 4% Two or more races 3% Asian 3% Hispanic / Latino 1%
- Common ancestry
- Slovak 5% Romanian 5% Iranian 4%
- Foreign-born
- 5% · China, Canada
- Languages at home
- 94% English-only · Chinese 3% Spanish 1%
Political lean MEDSL · Onondaga
- 2024 margin
- D (+17.3) · D 58.6% · R 41.4%
- 2008→2024 swing
- -3.0pp toward R · 2008: 20.3pp · 2024: 17.3pp
- All cycles
- 2024: D+17.3 2020: D+20.6 2016: D+12.8 2012: D+21.1 2008: D+20.3
Not yet ingested
- Civics
- —
Market trends
- HPI YoY
- ▲ 8.13%
- Current HPI
- 285.9921
- Rent YoY
- —
- Metro
- —
- State GDP YoY
- ▲ 2.60%
- F500 in state
- 92
Industry mix (Fortune 500 HQ in NY)
| Industry | F500 HQs | Revenue |
|---|---|---|
| Financial Services | 10 | $950B |
|
||
| Consumer Goods | 9 | $162B |
|
||
| Insurance | 4 | $225B |
|
||
| Telecommunications | 2 | $144B |
|
||
| Pharmaceuticals | 2 | $112B |
|
||
| Media / Entertainment | 2 | $69B |
|
||
Price history
2 events — show timeline
- 2026-03-31 Contingent — CNYIS
- 2026-03-19 Listed $184,900 CNYIS
Property tax history
+0.6%/yrLatest (2025): $3,048 · +1.6% YoY. Source: county tax records.
Cash-flow waterfall
monthlySold comps — $/sqft
last 12 mo · ≤1 miLoading sold comps…