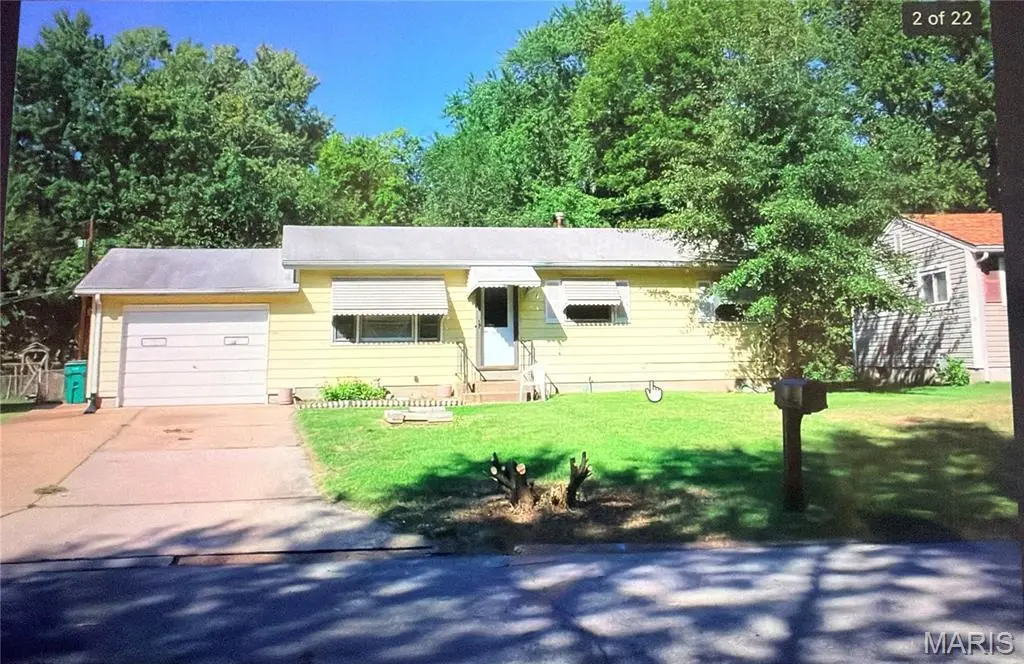
11905 Homestead Ave · Spanish Lake, MO
Flood risk 1/10 · Minimal
- FEMA flood zone
- X (unshaded)
- Chance of flooding over 30 yrs
- 0.0%
- Est. flood insurance / yr
- $473 – $860
Fire risk 1/10 · Minimal
- Est. fire insurance / yr
- $1,054 – $1,958
Heat risk 5/10 · Moderate
- Hot days now (above 107°F)
- 7 days/yr
- Hot days in 30 yrs
- 21 days/yr
Wind risk 2/10 · Minimal
- Chance of severe wind over 30 yrs
- 1.0%
Air-quality risk 4/10 · Minor
- Unhealthy air days now
- 4 days/yr
- Unhealthy air days in 30 yrs
- 5 days/yr
Risk factors via First Street. Map © Google.
Why this score? — see what drove the C+ grade
The composite is a weighted blend of 9 inputs, each scored 0–100. Each bar is that input's sub-score; the figure is the points it added to the 100-point composite (weight × sub-score).
- Cash flow +27.7/30.0
- DSCR +9.7/10.0
- ARV discount +9.1/15.0
- 1% rule +7.3/10.0
- Livability +2.6/5.0
- Condition / age +2.5/5.0
- Rent growth +2.1/5.0
- Schools +1.7/10.0
- Appreciation +0.0/10.0
$114,000
🖨 Deal sheet 📄 Offer letter ✓ Due diligence
Listing remarks MLS
Excellent turnkey investment opportunity! This tenant-occupied 3-bedroom home offers immediate rental income in a peaceful neighborhood setting. Inside, enjoy a low-maintenance blend of wood and vinyl flooring and a massive kitchen featuring abundant cabinetry and generous counter space that flows seamlessly into the open dining and family areas. The wide driveway and 1-car garage provide ample parking, while the spacious, level backyard and private deck create desirable outdoor living space. A strong addition to any rental portfolio with lasting tenant appeal.
Key facts
- Abundant cabinetry
- Wide driveway
- Tenant-occupied home
Tags
Neighborhood map
What this means for you Summary
Snapshot
- This is a 3-bed/1.0-bath single-family listed at $114k.
Deal economics
- At list price, monthly cash flow is $344 ($4k/yr) — positive.
- The deal already cash-flows at list — no discount required.
- Meets the 1% rule at list price ($1k rent vs $114k).
- Recommended offer: $104k (9.0% below list) — sets the bar for market timing.
- Cap rate 9.9% vs local median 7.9% in Spanish Lake — meaningfully above typical; check what's discounted (condition, days-on-market, listing class) to confirm the premium yield is real.
Location & tenants
- Location reads 51/100 on livability (#870 in MO) — a working-class tenant base; expect higher turnover. Strengths: cost of living A+, housing A+; Watch: schools F, crime F, amenities F.
- Hazelwood (suburban): math 11% / reading 26% proficiency, ranked #306 of 324 in MO (top 94%) — low school quality limits family demand, transient renter base, plan for 1-2y turnover.
- Market conditions: Rents soft (-1.5%/yr); 101 active listings in the ZIP; 20 comparable units currently listed for rent nearby; rentals at typical pace (median 24d on market — plan ~3-4 weeks tenant-placement turnaround); 40% of comp listings sitting > 30 days — soft ceiling on asking rent; 920 units permitted in St. Louis County in 2024 (250 in 5+ unit buildings).
Forward outlook
- Local home prices are declining (-3.0%/yr); year-one equity from $788 of loan paydown is wiped out by about $3k of value loss. Plan a longer hold.
Negotiation context
- It's been on market 105 days — a 9% lower offer ($104k) is reasonable based on typical stale-listing flexibility.
- 2 sale attempts since 14y ago with the ask held roughly flat each time — persistent listings suggest the price (not the market) is what's stuck; bring a comps-based counter.
- Current owner paid $74k; list at $114k implies a 55% gain — meaningful room to come down on a strong offer.
Risks & watch-outs
- Climate carrying-cost: extreme-heat days projected 7→21/yr by 2055 (HVAC capex compounding) — expect insurance premiums to compound above CPI over the hold.
Questions for the listing agent
- It's been on market 105 days. Have you received any prior offers? Is the seller open to a 9% concession, seller financing, or rate buy-down credit?
- Built in 1961 — when were the roof, HVAC, electrical panel, plumbing, and water heater last replaced?
- Why hasn't it sold? Are there any deal-killer items the seller is aware of (foundation, flood, title, zoning, code violations)?
- Is there a deadline driving the sale (1031 exchange, divorce, estate, relocation)? That informs how much negotiation room exists.
- Schools are F-rated, which usually means shorter tenancies and higher turnover. Who's the typical renter profile here, and what's been the actual vacancy rate?
- Crime grade is F in this area — have there been break-ins, vandalism, or insurance claims at this property in the last 3 years? What carrier currently insures it and at what premium?
- What's the average days-on-market for RENTAL listings here right now (not sales)? A rising rental-DOM trend means longer vacancies and softer asking-rent achievability than the comps imply.
- What's the recent tenant-quality profile in this submarket — average credit score on applications, eviction rate, late-payment / NSF rate, and stable-employment percentage? A property-management company in the area should have these aggregated.
- How much new for-sale + rental construction is in the pipeline within 1–3 miles? Heavy new supply typically softens prices + rents 12–24 months out; constrained supply supports both.
Investment metrics
- 1% rule
- 1.23% ✓
- Cap rate
- 9.91%
- Cash-on-cash
- 12.92%
- DSCR
- 1.57
- GRM
- 6.8
CMA / ARV
- ARV (median comp)
- $118,215
- List price
- $114,000
- Delta
- -3.57%
- Verdict
- FAIR
- Comps
- 20 within 1.0 mi
Show comp detail 12 sales within ~0.75 mi
| Address | Dist | Beds/Ba | Sqft | Sold | Price | $/sf | Match |
|---|---|---|---|---|---|---|---|
| 12019 Krenning Ln | 0.22mi | 3/1.0 | 930 (+2%) | 1mo | $119,900 | $129 | 85 |
| 1459 Cove Ln | 0.17mi | 3/1.5 | 988 (+8%) | 3mo | $79,900 | $81 | 74 |
| 1209 Northdale Ave | 0.54mi | 2/1.0 (-1) | 864 (-5%) | 1mo | $79,900 | $92 | 60 |
| 1231 Reale Ave | 0.48mi | 2/1.5 (-1) | 864 (-5%) | 2mo | $69,900 | $81 | 60 |
| 1135 Cove Ln | 0.65mi | 2/1.0 (-1) | 936 (+3%) | 2mo | $85,000 | $91 | 59 |
| 1136 Walker Ave | 0.67mi | 3/1.0 | 864 (-5%) | 3mo | $125,000 | $145 | 57 |
| 1125 Walker Ave | 0.69mi | 3/1.0 | 864 (-5%) | 3mo | $114,999 | $133 | 57 |
| 1200 Baron Ave | 0.71mi | 3/1.0 | 864 (-5%) | 2mo | $77,500 | $90 | 56 |
| 12336 Santa Maria Dr | 0.60mi | 3/1.0 | 1,020 (+12%) | 1mo | $125,000 | $123 | 51 |
| 1321 Dominica Dr | 0.62mi | 3/1.0 | 1,012 (+11%) | 2mo | $124,900 | $123 | 51 |
| 12371 Pinta Dr | 0.66mi | 3/1.0 | 1,020 (+12%) | 3mo | $72,900 | $71 | 47 |
| 1316 Bayonne Dr | 0.66mi | 2/1.5 (-1) | 1,015 (+11%) | 2mo | $105,000 | $103 | 42 |
Match score weights: distance 35% · size 25% · config 20% · recency 20%. Top-matched comps best support the ARV.
Projected returns pro-forma
-3.0% appreciation · 0.0% rent growth · sell at horizon
- IRR
- -0.6%
- Equity multiple
- 0.98×
- Total profit
- $-695
- Equity at exit
- $16,998
- IRR
- 5.7%
- Equity multiple
- 1.37×
- Total profit
- $11,717
- Equity at exit
- $9,857
Cash invested: $31,920 (down + closing). Projections, not guarantees.
Landlord ↔ Tenant lean methodology
- Overall (STATE)
- 81 Strongly Landlord-Friendly
- State Missouri
- 81 Strongly Landlord-Friendly · R+10
- County
- — inherits STATE
- City
- — inherits STATE
ZIP-level market 63138
- Home prices YoY
- -31.0%
- Rents YoY
- -1.5%
- Active inventory
- 101
- Price-to-rent
- 6.8×
Monthly cashflow live
- Estimated rent
- $1,402 high interval (Pro) →
- Mortgage (P&I)
- −$598
- Tax from tax record
- −$119 /mo · $1,425/yr
- Insurance
- −$48
- HOA
- −$0
- Vacancy / Maint / Mgmt
- −$294
- Net cashflow
- $344
Break-even live
UW: 25.0% down · 7.5% · 30yr · 1.5% tax · 5.0% vac · 8.0% maint · 8.0% mgmt
Financing live
Cash to close
- Down payment
- $28,500
- Closing costs
- $3,420
- Reserves months
- —
- Total cash needed
- —
Loan-product check · same deal, 3 products live
Conventional
25% down · 7.5% · 30yr
- Down + closing
- —
- Monthly P&I
- —
- Monthly cashflow
- —
- DSCR
- —
- Eligible?
- —
Personal DTI + credit; lowest rate.
DSCR
20% down · 8.5% · 30yr
- Down + closing
- —
- Monthly P&I
- —
- Monthly cashflow
- —
- DSCR
- —
- Eligible?
- —
No personal income docs; deal must DSCR.
Hard money
10% down · 12.0% · 12mo
- Down + closing
- —
- Monthly P&I
- —
- Monthly cashflow
- —
- DSCR
- —
- Eligible?
- —
Short-term bridge; refi at stabilization.
Rent comps 20 comps
| Address | Beds | Baths | Sqft | Rent | $/sqft | DOM | Units | Dist |
|---|---|---|---|---|---|---|---|---|
| 1504 Redman Blvd Saint Louis, MO | 3.0 | 2.0 | 1014 | $1,299 | $1.28 | 4d | 1 | 0.11mi |
| 1473 Broadlawns Ln Saint Louis, MO | 3.0 | 1.0 | 1000 | $1,400 | $1.40 | 43d | 1 | 0.12mi |
| 1455 Broadlawns Ln Saint Louis, MO | 3.0 | 1.0 | 912 | $1,395 | $1.53 | 12d | 1 | 0.14mi |
| 1376 Cove Ln Saint Louis, MO | 3.0 | 1.0 | 925 | $1,365 | $1.48 | 23d | 1 | 0.32mi |
| 1359 Cove Ln Saint Louis, MO | 3.0 | 1.0 | 925 | $1,427 | $1.54 | 2d | 1 | 0.33mi |
| 11930 Criterion Ave Saint Louis, MO | 3.0 | 1.0 | 816 | $1,350 | $1.65 | 43d | 1 | 0.36mi |
| 1708 San Remo Ct St. Louis, MO | 1.0–3.0 | 1.0–1.5 | 1053 | $1,300 | $1.23 | 1d | 9 | 0.38mi |
| 11891 Bridgevale Ave Saint Louis, MO | 3.0 | 1.0 | 864 | $1,350 | $1.56 | 23d | 1 | 0.40mi |
| 1223 Walker Ave Saint Louis, MO | 4.0 | 1.0 | 936 | $1,800 | $1.92 | 43d | 1 | 0.51mi |
| 1218 Walker Ave Saint Louis, MO | 3.0 | 1.0 | 936 | $1,275 | $1.36 | 23d | 1 | 0.53mi |
| 1321 Dominica Dr Saint Louis, MO | 3.0 | 1.0 | 1012 | $1,400 | $1.38 | 43d | 1 | 0.63mi |
| 1132 Redman Blvd Saint Louis, MO | 4.0 | 1.0 | 1080 | $1,195 | $1.11 | 43d | 1 | 0.64mi |
| 1141 Scott Ave Saint Louis, MO | 3.0 | 1.0 | 864 | $1,400 | $1.62 | 22d | 1 | 0.67mi |
| 11921 Larimore Rd Saint Louis, MO | 3.0 | 1.0 | 1078 | $1,100 | $1.02 | 43d | 1 | 0.79mi |
| 12367 Horizon Village Dr Unit 12367 I St. Louis, MO | 2.0 | 1.0 | 836 | $995 | $1.19 | 23d | 1 | 0.88mi |
| 11969 Continental Dr St. Louis, MO | 2.0–3.0 | 1.5 | 1075 | $1,325 | $1.23 | 1d | 3 | 0.89mi |
| 12401 Horizon Village Dr Unit 12415 A St. Louis, MO | 2.0 | 1.0 | 836 | $995 | $1.19 | 43d | 1 | 0.97mi |
| 1333 N Garden Dr St. Louis, MO | 2.0 | 1.0 | 626 | $1,100 | $1.76 | 43d | 1 | 1.11mi |
| 1342 N Garden Dr Saint Louis, MO | 2.0 | 1.0 | 626 | $1,100 | $1.76 | 1d | 3 | 1.15mi |
| 11592 Las Ladera Dr Florissant, MO | 3.0 | 2.0 | 986 | $1,616 | $1.64 | 7d | 1 | 1.41mi |
Listing history 18 events
-
2026-06-18days on market $114,000 Active 105 DOM
-
2026-06-17days on market $114,000 Active 104 DOM
-
2026-06-16days on market $114,000 Active 103 DOM
-
2026-06-15days on market $114,000 Active 102 DOM
-
2026-06-13days on market $114,000 Active 100 DOM
-
2026-06-13days on market $114,000 Active 99 DOM
-
2026-06-09days on market $114,000 Active 96 DOM
-
2026-06-08days on market $114,000 Active 95 DOM
-
2026-06-07days on market $114,000 Active 94 DOM
-
2026-06-05days on market $114,000 Active 91 DOM
-
2026-06-03days on market $114,000 Active 90 DOM
-
2026-06-02days on market $114,000 Active 89 DOM
-
2026-05-31days on market $114,000 Active 88 DOM
-
2026-03-04$114,000 Active 567-char remark
Show marketing remark (567 chars)
Excellent turnkey investment opportunity! This tenant-occupied 3-bedroom home offers immediate rental income in a peaceful neighborhood setting. Inside, enjoy a low-maintenance blend of wood and vinyl flooring and a massive kitchen featuring abundant cabinetry and generous counter space that flows seamlessly into the open dining and family areas. The wide driveway and 1-car garage provide ample parking, while the spacious, level backyard and private deck create desirable outdoor living space. A strong addition to any rental portfolio with lasting tenant appeal.
-
2012-07-12soldstatus 419-char remark
Show marketing remark (419 chars)
REO PROPERTY - BANK OWNED. PROPERTY SOLD AS IS'' WITHOUT REPAIR, WARRANTY OR SELLER DISCLOSURE. Buyer or Buyer's Agent is responsible for utility activation related to inspections. Listing Broker & Seller assume no responsibility & make no guarantees/warranties or representations as to the availability or accuracy of the property information photographs, or other information depicted or described herein.
-
2012-05-24$27,000 419-char remark
Show marketing remark (419 chars)
REO PROPERTY - BANK OWNED. PROPERTY SOLD AS IS'' WITHOUT REPAIR, WARRANTY OR SELLER DISCLOSURE. Buyer or Buyer's Agent is responsible for utility activation related to inspections. Listing Broker & Seller assume no responsibility & make no guarantees/warranties or representations as to the availability or accuracy of the property information photographs, or other information depicted or described herein.
-
2003-09-26soldstatus $73,505
-
1961-06-05soldstatus
ⓘ Source: listings_history table (triggers on properties + properties_extension) + one-shot
backfill from property_details.listing_events for pre-trigger history.
Tax reassessment forecast MO · Resets to sale price
- Current annual tax
- $1,425 · $119/mo
- Projected year-2 tax
- $1,425 · $119/mo
- Expected delta
- $0/yr ($0/mo · 0.0%)
ⓘ Screening estimate from a state-policy table — verify with the county assessor before closing.
Climate risk First Street
- Flood 1/10 Low FEMA zone X (unshaded) · 0% chance over 30 yrs
- Wildfire 1/10 Low
- Heat 5/10 Major 7 d/yr ≥107°F today · 21 d/yr by 30 yrs out
- Wind 2/10 Low 100% chance of damaging wind over 30 yrs
- Air quality 4/10 Moderate 4 unhealthy d/yr today · 5 by 30 yrs out
Nearby sold comps map
Loading sold comps map…
Walkable amenities ~0.75 mi
Loading nearby amenities…
Taxation est. · year 1
- Rental income
- $16,824
- − Mortgage interest
- −$6,386
- − Property taxes
- −$1,425
- − Insurance
- −$570
- − Repairs & maintenance
- −$1,346
- − Management
- −$1,346
- − Depreciation
- −$3,316
- Taxable income
- $2,436
- Est. tax owed @ 24.0%
- −$585
- After-tax cash flow
- $3,538/yr
For passive investors: Depreciation is non-cash, so a rental often shows a tax loss while cash-flowing — sheltering income. Rental losses are passive: they offset passive income freely, and up to $25,000/yr can offset ordinary (W-2) income if you actively participate and your MAGI is under $100k (phasing out to $0 by $150k); unused losses carry forward. On sale, claimed depreciation is recaptured at up to 25%, and gains may owe capital-gains tax (a 1031 exchange can defer both). Figures are a year-1 estimate at your 24.0% rate — not tax advice; consult a CPA.
Schools (NCES district)
- District
- Hazelwood
- NCES district ID
- 2913830
- Math proficiency
- 11% ▼ -13.00%
- Reading proficiency
- 26% ▼ -6.00%
- Median HH income
- $51,621
- Composite
- 16.77/100
- National rank
- #9156
- State rank
- #306 of 324 in MO
Livability — Spanish Lake
- Score
- 51/100
- State rank
- #870
- US rank
- #25189
Category grades
Schools grade is shown separately in the Schools card above.
Census & demographics
- Census place
- Spanish Lake, MO
- County
- Saint Louis County · 888,823 people
- City population
- 18,233
- Metro
- St. Louis, MO-IL
- Population (ZIP)
- 18,233
- Household income
- $56,096
- Rent vs Own
- Severe rent burden
- 925.0
Population outlook (St. Louis County) Hauer SSP2
- Today (2025)
- 1,025,227 people
- By 2030
- 1,028,023 · +0.3%
- By 2040
- 1,020,940 · -0.4%
- By 2050
- 1,007,280 · -1.8%
- By 2075
- 987,277 · -3.7%
- By 2100
- 921,984 · -10.1%
Race, ethnicity, and origin ACS 2023
- Neighborhood character
- Predominantly Black (81%)
- Race & ethnicity
- Black 81% White 14% Two or more races 4% Hispanic / Latino 1%
- Foreign-born
- 2% · Canada
- Languages at home
- 98% English-only · Spanish 1%
Political lean MEDSL · St. Louis
- 2024 margin
- Strong D (+23.4) · D 60.8% · R 37.4% · Other 1.7%
- 2008→2024 swing
- +3.5pp toward D · 2008: 19.9pp · 2024: 23.4pp
- All cycles
- 2024: D+23.4 2020: D+24.0 2016: D+16.2 2012: D+13.7 2008: D+19.9
Not yet ingested
- Civics
- —
Market trends
- HPI YoY
- ▼ -74.09%
- Current HPI
- 165.2146
- Rent YoY
- ▼ -1.54%
- Metro
- St. Louis, MO-IL
- State GDP YoY
- ▲ 1.84%
- F500 in state
- 20
Industry mix (Fortune 500 HQ in MO)
| Industry | F500 HQs | Revenue |
|---|---|---|
| Healthcare | 1 | $163B |
|
||
| Insurance | 1 | $21B |
|
||
| Industrial Technology | 1 | $17B |
|
||
| Retail | 1 | $16B |
|
||
| Industrial Distribution | 1 | $10B |
|
||
| Utilities | 1 | $9B |
|
||
Price history
+55.1% since first listed5 events — show timeline
- 2026-03-04 Listed $114,000 MARIS as Distributed by MLS Grid
- 2012-07-12 Sold (MLS) — MARIS as Distributed by MLS Grid
- 2012-05-24 Listed $27,000 MARIS as Distributed by MLS Grid
- 2003-09-26 Sold (Public Records) $73,505 Public Records
- 1961-06-05 Sold (Public Records) — Public Records
Property tax history
+1.3%/yrLatest (2022): $1,425 · +1.5% YoY. Source: county tax records.
Cash-flow waterfall
monthlySold comps — $/sqft
last 12 mo · ≤1 miLoading sold comps…