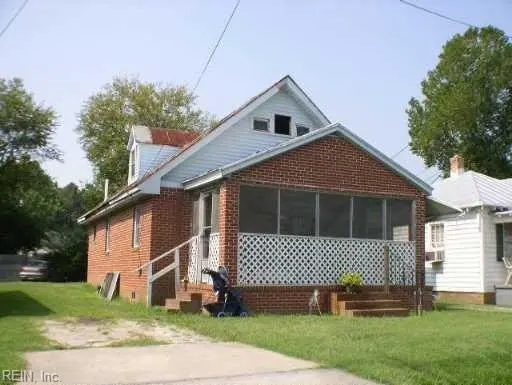
115 Lewis Ave · Suffolk, VA
Flood risk 1/10 · Minimal
- FEMA flood zone
- X (unshaded)
- Chance of flooding over 30 yrs
- 0.0%
- Est. flood insurance / yr
- $507 – $1,088
Fire risk 4/10 · Minor
- Est. fire insurance / yr
- $666 – $1,236
Heat risk 9/10 · Severe
- Hot days now (above 109°F)
- 7 days/yr
- Hot days in 30 yrs
- 16 days/yr
Wind risk 8/10 · Major
- Chance of severe wind over 30 yrs
- 80.0%
Air-quality risk 2/10 · Minimal
- Unhealthy air days now
- 0 days/yr
- Unhealthy air days in 30 yrs
- 1 days/yr
Risk factors via First Street. Map © Google.
Why this score? — see what drove the A- grade
The composite is a weighted blend of 9 inputs, each scored 0–100. Each bar is that input's sub-score; the figure is the points it added to the 100-point composite (weight × sub-score).
- Cash flow +30.0/30.0
- ARV discount +15.0/15.0
- 1% rule +10.0/10.0
- DSCR +10.0/10.0
- Schools +4.8/10.0
- Rent growth +4.0/5.0
- Livability +3.9/5.0
- Condition / age +2.5/5.0
- Appreciation +0.0/10.0
$120,000
🖨 Deal sheet 📄 Offer letter ✓ Due diligence
Listing remarks
Investor special! Sold strictly as-is—seller will make no repairs. This 2-bedroom, 1-bath home offers approximately 800 square feet and presents a prime opportunity for a full renovation. Ideal for cash or hard money buyers looking for their next project. Strong upside potential with an estimated ARV of $260K–$275K, leaving room for a solid return. Don’t miss this value-add opportunity with great profit potential.
Key facts
- Built 1950
- Listed 49 days
Property features AI
Finance
- HOA & community: No HOA fees listed
Exterior
- Parking: Driveway parking spaces
- Utilities: City/County sewer
- Home design: Detached Cape Cod; Single story with 1 living level; Crawl foundation
- Construction: Composite roof
- Exterior features: Brick and vinyl siding; City view
Interior
- Kitchen: Kitchen
- Bedrooms: Master bedroom on the first floor; Additional bedroom
- Bathrooms: 1 full bathroom
- Interior features: First-floor master bedroom; Attic; Living room; Great room; Dining room; Family room; Utility room
- Laundry & utility: Utility room
Neighborhood map
What this means for you Summary
Snapshot
- This is a 3-bed/1.0-bath single-family listed at $120k.
Deal economics
- At list price, monthly cash flow is $901 ($11k/yr) — positive.
- The deal already cash-flows at list — no discount required.
- Meets the 1% rule at list price ($2k rent vs $120k).
- Recommended offer: $116k (3.0% below list) — sets the bar for market timing.
- Cap rate 15.3% vs local median 3.5% in Suffolk — top-decile yield for the area; either an underpriced asset or a hidden risk that comps aren't pricing in. Stress-test before assuming the spread holds.
Location & tenants
- Location reads 77/100 on livability (#88 in VA, #2,896 nationally) — a middle-class / working-renter tenant base. Strengths: housing A+, health & safety A+, employment A-; Watch: crime C-, commute F.
- Suffolk City Public School District (suburban): math 41% / reading 69% proficiency, ranked #72 of 131 in VA (top 55%) — acceptable for families but not a draw, mixed tenant base, ~2y average lease.
- Zoned schools: Booker T. Washington Elementary (math 27% / reading 47%, grade F, #933 of 1,108 statewide, top 86%, 355 students, 64% FRL); Lakeland High (math 33% / reading 77%, grade C, #279 of 319 statewide, top 88%, 1,083 students, 64% FRL) — zoned schools average 64% FRL vs 39% district-wide (25 pts higher); higher-poverty schools than district average — tighter screening recommended.
- Market conditions: Rents rising fast (+5.8%/yr); 536 active listings in the ZIP; 12 comparable units currently listed for rent nearby; rentals at typical pace (median 24d on market — plan ~3-4 weeks tenant-placement turnaround); solid renter incomes; 680 units permitted in Suffolk city in 2024 (0 in 5+ unit buildings).
- This rent runs 32% of the median local income ($80k/yr) — at the standard rent-burdened threshold; future hikes will face affordability resistance.
Forward outlook
- Local home prices are declining (-3.0%/yr); year-one equity from $830 of loan paydown is wiped out by about $4k of value loss. Plan a longer hold.
- Suffolk County population projected at +11% by 2050 — modest demand growth; plan on rents tracking national, not racing it.
- At projected returns (-3.0% appreciation + 5.8% rent growth), your $34k cash investment doubles in ~4 years — after that, you're playing with house money.
Negotiation context
- It's been on market 49 days — a 3% lower offer ($116k) is reasonable based on typical stale-listing flexibility.
- Current owner paid $100k; 20% above their basis — modest negotiation headroom, anchor on the comps not their cost.
Risks & watch-outs
- Watch-outs: built in 1950 — expect roof / HVAC / electrical / plumbing capex.
- Climate carrying-cost: severe wind risk, 80% chance of damaging wind over 30y; extreme-heat days projected 7→16/yr by 2055 (HVAC capex compounding) — expect insurance premiums to compound above CPI over the hold.
Questions for the listing agent
- It's been on market 49 days. Have you received any prior offers? Is the seller open to a 3% concession, seller financing, or rate buy-down credit?
- Built in 1950 — when were the roof, HVAC, electrical panel, plumbing, and water heater last replaced?
- Is there a deadline driving the sale (1031 exchange, divorce, estate, relocation)? That informs how much negotiation room exists.
- Schools are A-rated — typically a magnet for longer-tenancy family renters. What's the average tenant stay here, and is there a school-zone premium baked into asking?
- What's the average days-on-market for RENTAL listings here right now (not sales)? A rising rental-DOM trend means longer vacancies and softer asking-rent achievability than the comps imply.
- What's the recent tenant-quality profile in this submarket — average credit score on applications, eviction rate, late-payment / NSF rate, and stable-employment percentage? A property-management company in the area should have these aggregated.
- How much new for-sale + rental construction is in the pipeline within 1–3 miles? Heavy new supply typically softens prices + rents 12–24 months out; constrained supply supports both.
Investment metrics
- 1% rule
- 1.76% ✓
- Cap rate
- 15.30%
- Cash-on-cash
- 32.17%
- DSCR
- 2.43
- GRM
- 4.7
CMA / ARV
- ARV (median comp)
- $179,520
- List price
- $120,000
- Delta
- -33.16%
- Verdict
- UNDERPRICED
- Comps
- 20 within 1.0 mi
Show comp detail 12 sales within ~0.75 mi
| Address | Dist | Beds/Ba | Sqft | Sold | Price | $/sf | Match |
|---|---|---|---|---|---|---|---|
| 109 Woodrow Ave | 0.06mi | 3/2.5 | 1,638 (-1%) | 1mo | $345,000 | $211 | 90 |
| 114 Lewis Ave | 0.02mi | 3/2.5 | 1,760 (+7%) | 2mo | $319,900 | $182 | 81 |
| 602 County St Unit B | 0.22mi | 4/2.5 (+1) | 1,680 (+2%) | 3mo | $331,999 | $198 | 73 |
| 419 S Main St | 0.27mi | 3/1.0 | 1,509 (-8%) | 3mo | $255,000 | $169 | 71 |
| 501 Mahlon Ave | 0.44mi | 3/2.5 | 1,670 (+1%) | 2mo | $315,000 | $189 | 69 |
| 214 Knight St | 0.27mi | 3/1.5 | 1,820 (+10%) | 1mo | $145,000 | $80 | 67 |
| 503 Spruce St | 0.19mi | 3/2.5 | 1,436 (-13%) | 4mo | $315,000 | $219 | 60 |
| 603 Mason Ave | 0.68mi | 3/2.5 | 1,670 (+1%) | 3mo | $315,000 | $189 | 58 |
| 157 Hall Ave | 0.66mi | 3/2.5 | 1,538 (-7%) | 1mo | $290,000 | $189 | 51 |
| 406 St James Ave | 0.66mi | 3/2.5 | 1,760 (+7%) | 5mo | $309,900 | $176 | 48 |
| 605 Jefferson St | 0.70mi | 3/2.0 | 1,428 (-14%) | 0mo | $220,000 | $154 | 41 |
| 707 Ashley Ave | 0.73mi | 4/2.5 (+1) | 1,850 (+12%) | 5mo | $340,000 | $184 | 31 |
Match score weights: distance 35% · size 25% · config 20% · recency 20%. Top-matched comps best support the ARV.
Projected returns pro-forma
-3.0% appreciation · 5.84% rent growth · sell at horizon
- IRR
- 30.3%
- Equity multiple
- 2.31×
- Total profit
- $44,149
- Equity at exit
- $17,892
- IRR
- 39.1%
- Equity multiple
- 5.15×
- Total profit
- $139,376
- Equity at exit
- $10,375
Cash invested: $33,600 (down + closing). Projections, not guarantees.
Landlord ↔ Tenant lean methodology
- Overall (STATE)
- 55 Moderately Landlord-Leaning
- State Virginia
- 55 Moderately Landlord-Leaning · D+2
- County
- — inherits STATE
- City
- — inherits STATE
ZIP-level market 23434
- Rents YoY
- 5.8%
- Active inventory
- 536
- Price-to-rent
- 4.7×
Monthly cashflow live
- Estimated rent
- $2,117 high interval (Pro) →
- Mortgage (P&I)
- −$629
- Tax from tax record
- −$93 /mo · $1,112/yr
- Insurance
- −$50
- HOA
- −$0
- Vacancy / Maint / Mgmt
- −$445
- Net cashflow
- $901
Break-even live
UW: 25.0% down · 7.5% · 30yr · 1.5% tax · 5.0% vac · 8.0% maint · 8.0% mgmt
Financing live
Cash to close
- Down payment
- $30,000
- Closing costs
- $3,600
- Reserves months
- —
- Total cash needed
- —
Loan-product check · same deal, 3 products live
Conventional
25% down · 7.5% · 30yr
- Down + closing
- —
- Monthly P&I
- —
- Monthly cashflow
- —
- DSCR
- —
- Eligible?
- —
Personal DTI + credit; lowest rate.
DSCR
20% down · 8.5% · 30yr
- Down + closing
- —
- Monthly P&I
- —
- Monthly cashflow
- —
- DSCR
- —
- Eligible?
- —
No personal income docs; deal must DSCR.
Hard money
10% down · 12.0% · 12mo
- Down + closing
- —
- Monthly P&I
- —
- Monthly cashflow
- —
- DSCR
- —
- Eligible?
- —
Short-term bridge; refi at stabilization.
Rent comps 12 comps
| Address | Beds | Baths | Sqft | Rent | $/sqft | DOM | Units | Dist |
|---|---|---|---|---|---|---|---|---|
| 310 Greenfield Cres Suffolk, VA | 3.0 | 2.0 | 1146 | $1,995 | $1.74 | 43d | 1 | 0.17mi |
| 525 Kilby Ave Suffolk, VA | 3.0 | 2.5 | 1776 | $2,500 | $1.41 | 23d | 1 | 0.51mi |
| 116 Franklin St Suffolk, VA | 3.0 | 1.0 | 1335 | $1,750 | $1.31 | 23d | 1 | 0.82mi |
| 116 Franklin St Unit 3 Suffolk, VA | 3.0 | 1.0 | 1335 | $1,750 | $1.31 | 43d | 1 | 0.82mi |
| 181 N Main St Suffolk, VA | 2.0 | 1.0–2.0 | 804 | $1,885 | $2.34 | 1d | 15 | 0.89mi |
| 124 Halifax St Suffolk, VA | 4.0 | 2.0 | 1728 | $2,100 | $1.22 | 43d | 1 | 0.99mi |
| 1341 Devonshire Ct Suffolk, VA | 3.0 | 2.0 | 1795 | $2,295 | $1.28 | 14d | 1 | 1.00mi |
| 1341 Devonshire Ct Suffolk, VA | 3.0 | 2.0 | 1800 | $2,295 | $1.27 | 4d | 1 | 1.00mi |
| 808 Gittings St Suffolk, VA | 4.0 | 2.5 | 2187 | $2,500 | $1.14 | 23d | 1 | 1.10mi |
| 307 N 4th St Suffolk, VA | 4.0 | 2.0 | 1600 | $1,800 | $1.12 | 7d | 1 | 1.30mi |
| 223 N 7th St Suffolk, VA | 3.0 | 2.5 | 1495 | $2,300 | $1.54 | 43d | 1 | 1.38mi |
| 315 Highland Ave Suffolk, VA | 3.0 | 2.0 | 1580 | $2,050 | $1.30 | 23d | 1 | 1.49mi |
Listing history 13 events
-
2026-06-16status $120,000 Under Contract 49 DOM
-
2026-06-15days on market $120,000 Active 49 DOM
-
2026-06-13days on market $120,000 Active 47 DOM
-
2026-06-09days on market $120,000 Active 43 DOM
-
2026-06-08days on market $120,000 Active 42 DOM
-
2026-06-07days on market $120,000 Active 41 DOM
-
2026-06-03days on market $120,000 Active 37 DOM
-
2026-06-02days on market $120,000 Active 36 DOM
-
2026-06-01days on market $120,000 Active 35 DOM
-
2026-05-31days on market $120,000 Active 34 DOM
-
2026-04-27$120,000 Active 434-char remark
-
2025-06-06soldstatus $100,000
-
2005-08-30soldstatus $55,000
ⓘ Source: listings_history table (triggers on properties + properties_extension) + one-shot
backfill from property_details.listing_events for pre-trigger history.
Tax reassessment forecast VA · Resets to sale price
- Current annual tax
- $1,112 · $93/mo
- Projected year-2 tax
- $1,112 · $93/mo
- Expected delta
- $0/yr ($0/mo · 0.0%)
ⓘ Screening estimate from a state-policy table — verify with the county assessor before closing.
Climate risk First Street
- Flood 1/10 Low FEMA zone X (unshaded) · 0% chance over 30 yrs
- Wildfire 4/10 Moderate
- Heat 9/10 Extreme 7 d/yr ≥109°F today · 16 d/yr by 30 yrs out
- Wind 8/10 Severe 80% chance of damaging wind over 30 yrs
- Air quality 2/10 Low 0 unhealthy d/yr today · 1 by 30 yrs out
Nearby sold comps map
Loading sold comps map…
Walkable amenities ~0.75 mi
Loading nearby amenities…
Taxation est. · year 1
- Rental income
- $25,409
- − Mortgage interest
- −$6,722
- − Property taxes
- −$1,112
- − Insurance
- −$600
- − Repairs & maintenance
- −$2,033
- − Management
- −$2,033
- − Depreciation
- −$3,491
- Taxable income
- $9,419
- Est. tax owed @ 24.0%
- −$2,261
- After-tax cash flow
- $8,549/yr
For passive investors: Depreciation is non-cash, so a rental often shows a tax loss while cash-flowing — sheltering income. Rental losses are passive: they offset passive income freely, and up to $25,000/yr can offset ordinary (W-2) income if you actively participate and your MAGI is under $100k (phasing out to $0 by $150k); unused losses carry forward. On sale, claimed depreciation is recaptured at up to 25%, and gains may owe capital-gains tax (a 1031 exchange can defer both). Figures are a year-1 estimate at your 24.0% rate — not tax advice; consult a CPA.
Schools (NCES district)
- District
- Suffolk City Public School District
- NCES district ID
- 5103710
- Math proficiency
- 41% ▼ -43.00%
- Reading proficiency
- 69% ▼ -8.00%
- Median HH income
- $65,573
- Composite
- 48.31/100
- National rank
- #2151
- State rank
- #72 of 131 in VA
Livability — Suffolk
- Score
- 77/100
- State rank
- #88
- US rank
- #2896
Category grades
Schools grade is shown separately in the Schools card above.
Census & demographics
- Census place
- Suffolk, VA
- County
- Suffolk City · 88,108 people
- City population
- 88,108
- Metro
- Virginia Beach-Norfolk-Newport News, VA-NC
- Population (ZIP)
- 54,387
- Household income
- $79,877
- Rent vs Own
- Severe rent burden
- 1934.0
Population outlook (Suffolk County) Hauer SSP2
- Today (2025)
- 95,269 people
- By 2030
- 98,269 · +3.1%
- By 2040
- 103,177 · +8.3%
- By 2050
- 105,777 · +11.0%
- By 2075
- 110,963 · +16.5%
- By 2100
- 103,711 · +8.9%
Race, ethnicity, and origin ACS 2023
- Neighborhood character
- Diverse neighborhood (Simpson 0.58)
- Race & ethnicity
- Black 49% White 41% Two or more races 5% Hispanic / Latino 4% Asian 1%
- Common ancestry
- Lithuanian 1% Slovak 1% Italian 1%
- Foreign-born
- 3% · Canada
- Languages at home
- 96% English-only · Spanish 2%
Political lean MEDSL · Suffolk
- 2024 margin
- D (+15.9) · D 57.4% · R 41.5% · Other 1.2%
- 2008→2024 swing
- +2.7pp toward D · 2008: 13.2pp · 2024: 15.9pp
- All cycles
- 2024: D+15.9 2020: D+17.3 2016: D+13.8 2012: D+15.1 2008: D+13.2
Not yet ingested
- Civics
- —
Market trends
- HPI YoY
- ▼ -383.80%
- Current HPI
- 158.5866
- Rent YoY
- ▲ 5.84%
- Metro
- Virginia Beach-Norfolk-Newport News, VA-NC
- State GDP YoY
- ▲ 2.40%
- F500 in state
- 50
Industry mix (Fortune 500 HQ in VA)
| Industry | F500 HQs | Revenue |
|---|---|---|
| Aerospace / Defense | 4 | $236B |
|
||
| Technology / Defense | 3 | $32B |
|
||
| Financial Services | 2 | $176B |
|
||
| Utilities | 2 | $27B |
|
||
| Insurance | 2 | $25B |
|
||
| Technology | 2 | $15B |
|
||
Price history
+118.2% since first listed4 events — show timeline
- 2026-06-15 Pending — REINMLS
- 2026-04-27 Listed $120,000 REINMLS
- 2025-06-06 Sold (Public Records) $100,000 Public Records
- 2005-08-30 Sold (Public Records) $55,000 Public Records
Property tax history
+3.3%/yrLatest (2025): $1,112 · +3.0% YoY. Source: county tax records.
Cash-flow waterfall
monthlySold comps — $/sqft
last 12 mo · ≤1 miLoading sold comps…