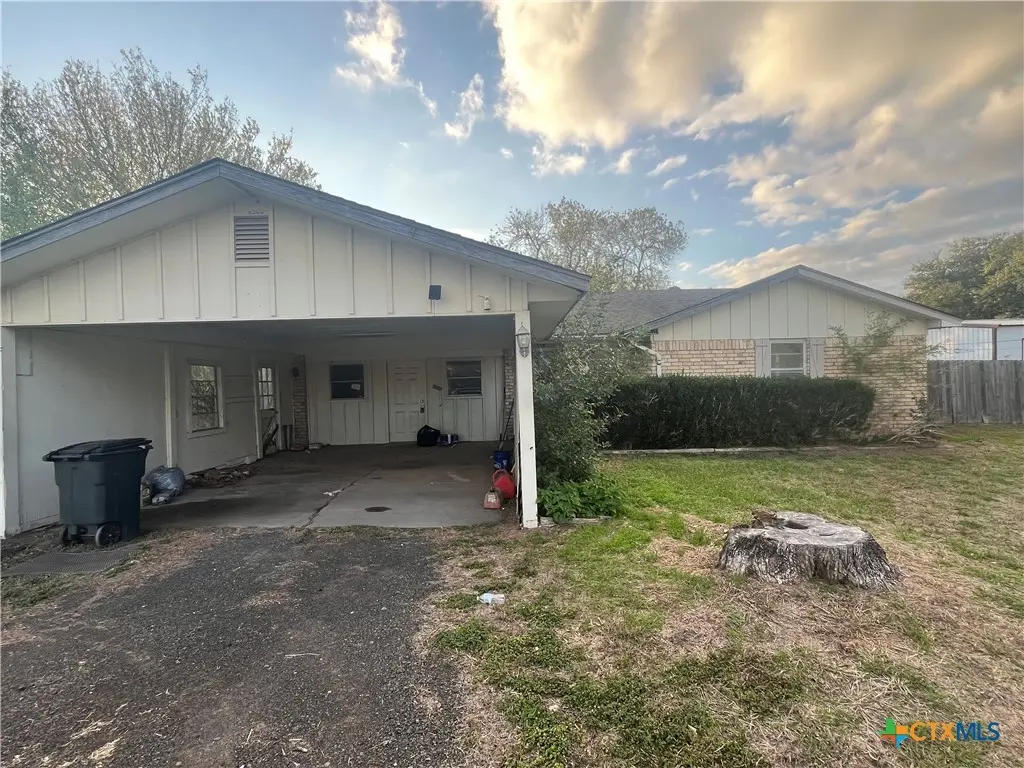
709 Pheasant Dr · Quail Creek, TX
Flood risk 1/10 · Minimal
- FEMA flood zone
- X
- Chance of flooding over 30 yrs
- 0.0%
- Est. flood insurance / yr
- $507 – $1,088
Fire risk 6/10 · Moderate
- Est. fire insurance / yr
- $1,222 – $2,270
Heat risk 9/10 · Severe
- Hot days now (above 111°F)
- 7 days/yr
- Hot days in 30 yrs
- 21 days/yr
Wind risk 9/10 · Severe
- Chance of severe wind over 30 yrs
- 99.0%
Air-quality risk 1/10 · Minimal
- Unhealthy air days now
- 0 days/yr
- Unhealthy air days in 30 yrs
- 0 days/yr
Risk factors via First Street. Map © Google.
Why this score? — see what drove the C grade
The composite is a weighted blend of 9 inputs, each scored 0–100. Each bar is that input's sub-score; the figure is the points it added to the 100-point composite (weight × sub-score).
- Cash flow +19.2/30.0
- ARV discount +15.0/15.0
- DSCR +6.1/10.0
- 1% rule +5.8/10.0
- Livability +3.4/5.0
- Rent growth +2.5/5.0
- Schools +2.5/10.0
- Condition / age +2.5/5.0
- Appreciation +0.0/10.0
$147,000
🖨 Deal sheet (PDF) 📄 Offer letter ✓ Due diligence
Listing remarks MLS
This spacious 3-bedroom, 2-bathroom home with over 1,600 sqft, is located in the desirable Quail Creek neighborhood. This home features vaulted ceilings, an enclosed garage that serves as a versatile bonus space—perfect for a second living area or additional bedroom—and a nicely laid-out kitchen. Outside, enjoy a large covered patio ideal for entertaining, a storage shed for extra space, and a convenient carport for covered parking.
Key facts
- Enclosed garage
- Storage shed
- Large covered patio
Tags
Neighborhood map
What this means for you Summary
Snapshot
- This is a 3-bed/2.0-bath single-family listed at $147k.
Deal economics
- At list price, monthly cash flow is $158 ($2k/yr) — positive.
- The deal already cash-flows at list — no discount required.
- Meets the 1% rule at list price ($2k rent vs $147k).
- Recommended offer: $129k (12.0% below list) — sets the bar for market timing.
- Cap rate 7.6% vs local median 2.1% in Quail Creek — top-decile yield for the area; either an underpriced asset or a hidden risk that comps aren't pricing in. Stress-test before assuming the spread holds.
Location & tenants
- Location reads 68/100 on livability (#476 in TX) — a middle-class / working-renter tenant base. Strengths: crime A+, cost of living A+, housing A+; Watch: health & safety C-, amenities F, commute F.
- Victoria ISD (urban): math 24% / reading 33% proficiency, ranked #645 of 826 in TX (top 78%) — low school quality limits family demand, transient renter base, plan for 1-2y turnover.
- Zoned schools: Aloe El (math 37% / reading 47%, grade F, #1,335 of 4,322 statewide, top 33%, 426 students, 70% FRL); Patti Welder Middle (math 8% / reading 23%, grade F, #1,556 of 1,662 statewide, top 94%, 638 students, 79% FRL); Victoria West H S (math 18% / reading 39%, grade F, #1,157 of 1,632 statewide, top 72%, 1,766 students, 59% FRL).
- Market conditions: 148 active listings in the ZIP; 43 units permitted in Victoria County in 2024 (0 in 5+ unit buildings).
Forward outlook
- Local home prices are declining (-3.0%/yr); year-one equity from $1k of loan paydown is wiped out by about $4k of value loss. Plan a longer hold.
- Victoria County population projected at +34% by 2050 — long-run rental-demand tailwind backs the buy-and-hold thesis.
Negotiation context
- It's been on market 184 days — a 12% lower offer ($129k) is reasonable based on typical stale-listing flexibility.
- 5 sale attempts since 25y ago; this cycle's ask has dropped $40k (22%) from the opening price — seller is motivated, your offer sets the floor, not the list.
Risks & watch-outs
- Climate carrying-cost: severe wind risk, 99% chance of damaging wind over 30y; major wildfire risk; extreme-heat days projected 7→21/yr by 2055 (HVAC capex compounding) — expect insurance premiums to compound above CPI over the hold.
Questions for the listing agent
- It's been on market 184 days. Have you received any prior offers? Is the seller open to a 12% concession, seller financing, or rate buy-down credit?
- Built in 1977 — when were the roof, HVAC, electrical panel, plumbing, and water heater last replaced?
- Why hasn't it sold? Are there any deal-killer items the seller is aware of (foundation, flood, title, zoning, code violations)?
- Is there a deadline driving the sale (1031 exchange, divorce, estate, relocation)? That informs how much negotiation room exists.
- Schools are D-rated, which usually means shorter tenancies and higher turnover. Who's the typical renter profile here, and what's been the actual vacancy rate?
- What's the average days-on-market for RENTAL listings here right now (not sales)? A rising rental-DOM trend means longer vacancies and softer asking-rent achievability than the comps imply.
- What's the recent tenant-quality profile in this submarket — average credit score on applications, eviction rate, late-payment / NSF rate, and stable-employment percentage? A property-management company in the area should have these aggregated.
- How much new for-sale + rental construction is in the pipeline within 1–3 miles? Heavy new supply typically softens prices + rents 12–24 months out; constrained supply supports both.
Investment metrics
- 1% rule
- 1.08% ✓
- Cap rate
- 7.59%
- Cash-on-cash
- 4.62%
- DSCR
- 1.21
- GRM
- 7.7
CMA / ARV
- ARV (median comp)
- $265,000
- List price
- $147,000
- Delta
- -44.53%
- Verdict
- UNDERPRICED
- Comps
- 15 within 1.0 mi
Show comp detail 7 sales within ~0.75 mi
| Address | Dist | Beds/Ba | Sqft | Sold | Price | $/sf | Match |
|---|---|---|---|---|---|---|---|
| 55 E Grouse Rd | 0.38mi | 3/2.0 | 1,584 (-5%) | 7mo | $319,000 | $201 | 68 |
| 417 Dove Dr | 0.41mi | 4/2.0 (+1) | 1,466 (-12%) | 2mo | $278,000 | $190 | 54 |
| 305 Turkey Ln | 0.58mi | 3/2.0 | 1,500 (-10%) | 3mo | $341,000 | $227 | 54 |
| 703 Duck Dr | 0.33mi | 3/2.0 | 1,418 (-15%) | 8mo | $185,000 | $130 | 53 |
| 313 Pheasant | 0.60mi | 3/2.0 | 1,833 (+10%) | 6mo | $250,000 | $136 | 51 |
| 405 Turkey Ln | 0.60mi | 4/2.0 (+1) | 1,822 (+9%) | 6mo | $379,900 | $209 | 46 |
| 102 Owl Rd | 0.68mi | 3/2.0 | 1,431 (-14%) | 3mo | $265,000 | $185 | 42 |
Match score weights: distance 35% · size 25% · config 20% · recency 20%. Top-matched comps best support the ARV.
Projected returns pro-forma
-3.0% appreciation · 3.0% rent growth · sell at horizon
- IRR
- -9.0%
- Equity multiple
- 0.67×
- Total profit
- $-13,654
- Equity at exit
- $21,918
- IRR
- 0.5%
- Equity multiple
- 1.03×
- Total profit
- $1,411
- Equity at exit
- $12,710
Cash invested: $41,160 (down + closing). Projections, not guarantees.
Landlord ↔ Tenant lean methodology
- Overall (STATE)
- 87 Strongly Landlord-Friendly
- State Texas
- 87 Strongly Landlord-Friendly · R+5
- County
- — inherits STATE
- City
- — inherits STATE
ZIP-level market 77905
- Home prices YoY
- -33.0%
- Active inventory
- 148
- Price-to-rent
- 7.7×
Monthly cashflow live
- Estimated rent
- $1,593 medium interval (Pro) →
- Mortgage (P&I)
- −$771
- Tax from tax record
- −$268 /mo · $3,216/yr
- Insurance
- −$61
- HOA
- −$0
- Vacancy / Maint / Mgmt
- −$335
- Net cashflow
- $158
Break-even live
Sensitivity live
| Price | -10% $242 | -5% $200 | +0% $158 | +5% $117 | +10% $75 |
|---|---|---|---|---|---|
| Rent | -10% $33 | -5% $95 | +0% $158 | +5% $221 | +10% $284 |
| Rate | -1.0pp $232 | -0.5pp $196 | base $158 | +0.5pp $120 | +1.0pp $82 |
UW: 25.0% down · 7.5% · 30yr · 1.5% tax · 5.0% vac · 8.0% maint · 8.0% mgmt
Financing live
Cash to close
- Down payment
- $36,750
- Closing costs
- $4,410
- Reserves months
- —
- Total cash needed
- —
Loan-product check · same deal, 3 products live
Conventional
25% down · 7.5% · 30yr
- Down + closing
- —
- Monthly P&I
- —
- Monthly cashflow
- —
- DSCR
- —
- Eligible?
- —
Personal DTI + credit; lowest rate.
DSCR
20% down · 8.5% · 30yr
- Down + closing
- —
- Monthly P&I
- —
- Monthly cashflow
- —
- DSCR
- —
- Eligible?
- —
No personal income docs; deal must DSCR.
Hard money
10% down · 12.0% · 12mo
- Down + closing
- —
- Monthly P&I
- —
- Monthly cashflow
- —
- DSCR
- —
- Eligible?
- —
Short-term bridge; refi at stabilization.
Listing history 27 events
-
2026-06-21days on market $147,000 Active 184 DOM
-
2026-06-19days on market $147,000 Active 182 DOM
-
2026-06-13days on market $147,000 Active 181 DOM
-
2026-06-10days on market $147,000 Active 179 DOM
-
2026-06-09days on market $147,000 Active 178 DOM
-
2026-06-08days on market $147,000 Active 177 DOM
-
2026-06-07days on market $147,000 Active 176 DOM
-
2026-06-03days on market $147,000 Active 172 DOM
-
2026-06-02days on market $147,000 Active 171 DOM
-
2026-06-01days on market $147,000 Active 170 DOM
-
2026-05-31days on market $147,000 Active 169 DOM
-
2026-05-30days on market $147,000 Active 168 DOM
-
2026-03-24price $147,000 448-char remark
Show marketing remark (448 chars)
This spacious 3-bedroom, 2-bathroom home with over 1,600 sqft, is located in the desirable Quail Creek neighborhood. This home features vaulted ceilings, an enclosed garage that serves as a versatile bonus space—perfect for a second living area or additional bedroom—and a nicely laid-out kitchen. Outside, enjoy a large covered patio ideal for entertaining, a storage shed for extra space, and a convenient carport for covered parking.
-
2026-02-10price $162,500 448-char remark
Show marketing remark (448 chars)
This spacious 3-bedroom, 2-bathroom home with over 1,600 sqft, is located in the desirable Quail Creek neighborhood. This home features vaulted ceilings, an enclosed garage that serves as a versatile bonus space—perfect for a second living area or additional bedroom—and a nicely laid-out kitchen. Outside, enjoy a large covered patio ideal for entertaining, a storage shed for extra space, and a convenient carport for covered parking.
-
2026-01-16price $174,000 448-char remark
Show marketing remark (448 chars)
This spacious 3-bedroom, 2-bathroom home with over 1,600 sqft, is located in the desirable Quail Creek neighborhood. This home features vaulted ceilings, an enclosed garage that serves as a versatile bonus space—perfect for a second living area or additional bedroom—and a nicely laid-out kitchen. Outside, enjoy a large covered patio ideal for entertaining, a storage shed for extra space, and a convenient carport for covered parking.
-
2025-12-12$187,500 Active 448-char remark
Show marketing remark (448 chars)
This spacious 3-bedroom, 2-bathroom home with over 1,600 sqft, is located in the desirable Quail Creek neighborhood. This home features vaulted ceilings, an enclosed garage that serves as a versatile bonus space—perfect for a second living area or additional bedroom—and a nicely laid-out kitchen. Outside, enjoy a large covered patio ideal for entertaining, a storage shed for extra space, and a convenient carport for covered parking.
-
2025-06-05historical
-
2025-06-04price $199,400
-
2025-05-28$199,500 Active
-
2013-06-25soldstatus
-
2013-06-21soldstatus $139,900
-
2013-01-28$139,900
-
2008-08-08soldstatus
-
2008-08-07soldstatus $120,300
-
2008-06-02$117,889
-
2008-05-22soldstatus
-
2001-04-01$72,000
ⓘ Source: listings_history table (triggers on properties + properties_extension) + one-shot
backfill from property_details.listing_events for pre-trigger history.
Tax reassessment forecast TX · Resets to sale price
- Current annual tax
- $3,216 · $268/mo
- Projected year-2 tax
- $3,216 · $268/mo
- Expected delta
- $0/yr ($0/mo · 0.0%)
ⓘ Screening estimate from a state-policy table — verify with the county assessor before closing.
Climate risk First Street
- Flood 1/10 Low FEMA zone X · 0% chance over 30 yrs
- Wildfire 6/10 Major
- Heat 9/10 Extreme 7 d/yr ≥111°F today · 21 d/yr by 30 yrs out
- Wind 9/10 Extreme 99% chance of damaging wind over 30 yrs
- Air quality 1/10 Low 0 unhealthy d/yr today · 0 by 30 yrs out
Nearby sold comps map
Loading sold comps map…
Walkable amenities ~0.75 mi
Loading nearby amenities…
Taxation est. · year 1
- Rental income
- $19,117
- − Mortgage interest
- −$8,234
- − Property taxes
- −$3,216
- − Insurance
- −$735
- − Repairs & maintenance
- −$1,529
- − Management
- −$1,529
- − Depreciation
- −$4,276
- Taxable loss
- −$403
- Est. tax savings @ 24.0%
- +$97
- After-tax cash flow
- $1,998/yr
For passive investors: Depreciation is non-cash, so a rental often shows a tax loss while cash-flowing — sheltering income. Rental losses are passive: they offset passive income freely, and up to $25,000/yr can offset ordinary (W-2) income if you actively participate and your MAGI is under $100k (phasing out to $0 by $150k); unused losses carry forward. On sale, claimed depreciation is recaptured at up to 25%, and gains may owe capital-gains tax (a 1031 exchange can defer both). Figures are a year-1 estimate at your 24.0% rate — not tax advice; consult a CPA.
Schools (NCES district)
- District
- Victoria ISD
- NCES district ID
- 4844150
- Math proficiency
- 24% ▼ -12.00%
- Reading proficiency
- 33% ▼ -2.00%
- Median HH income
- $50,534
- Composite
- 24.98/100
- National rank
- #7562
- State rank
- #645 of 826 in TX
Livability — Quail Creek
- Score
- 68/100
- State rank
- #476
- US rank
- #9560
Category grades
Schools grade is shown separately in the Schools card above.
Census & demographics
- Census place
- Quail Creek, TX
- Population (ZIP)
- 16,346
Population outlook (Victoria County) Hauer SSP2
- Today (2025)
- 106,119 people
- By 2030
- 113,161 · +6.6%
- By 2040
- 127,402 · +20.1%
- By 2050
- 141,953 · +33.8%
- By 2075
- 179,410 · +69.1%
- By 2100
- 200,127 · +88.6%
Race, ethnicity, and origin ACS 2023
- Neighborhood character
- Majority White (63%)
- Race & ethnicity
- White 63% Hispanic / Latino 30% Two or more races 18% Black 4%
- Hispanic origin (detail)
- Mexican 27%
- Common ancestry
- Slovak 2% Serbian 2% Lithuanian 1%
- Foreign-born
- 3% · Canada
- Languages at home
- 87% English-only · Spanish 12%
Political lean MEDSL · Victoria
- 2024 margin
- Solid R (+42.6) · D 28.4% · R 71.0%
- 2008→2024 swing
- -9.0pp toward R · 2008: -33.6pp · 2024: -42.6pp
- All cycles
- 2024: R+42.6 2020: R+38.0 2016: R+40.0 2012: R+37.8 2008: R+33.6
Not yet ingested
- Civics
- —
Market trends
- HPI YoY
- ▼ -68.60%
- Current HPI
- 139.4036
- Rent YoY
- —
- Metro
- —
- State GDP YoY
- ▲ 3.95%
- F500 in state
- 110
Industry mix (Fortune 500 HQ in TX)
| Industry | F500 HQs | Revenue |
|---|---|---|
| Energy | 16 | $1,198B |
|
||
| Technology | 5 | $198B |
|
||
| Engineering / Construction | 4 | $72B |
|
||
| Energy Services | 3 | $60B |
|
||
| Utilities | 3 | $41B |
|
||
| Healthcare | 2 | $330B |
|
||
Price history
+104.2% since first listed15 events — show timeline
- 2026-03-24 Price Changed $147,000 CTXMLS
- 2026-02-10 Price Changed $162,500 CTXMLS
- 2026-01-16 Price Changed $174,000 CTXMLS
- 2025-12-12 Listed $187,500 CTXMLS
- 2025-06-05 Listing Removed — CTXMLS
- 2025-06-04 Price Changed $199,400 CTXMLS
- 2025-05-28 Listed $199,500 CTXMLS
- 2013-06-25 Sold (Public Records) — Public Records
- 2013-06-21 Sold (MLS) $139,900 CTXMLS
- 2013-01-28 Listed $139,900 CTXMLS
- 2008-08-08 Sold (Public Records) — Public Records
- 2008-08-07 Sold (MLS) $120,300 CTXMLS
- 2008-06-02 Listed $117,889 CTXMLS
- 2008-05-22 Sold (Public Records) — Public Records
- 2001-04-01 Listed $72,000 CTXMLS
Property tax history
+0.3%/yrLatest (2025): $3,216 · +1.4% YoY. Source: county tax records.
Cash-flow waterfall
monthlySold comps — $/sqft
last 12 mo · ≤1 miLoading sold comps…