 🏗️ New Construction
Clayton - Crazy Eight Plan · Fort Worth, TX
Flood risk No data
- FEMA flood zone
- —
- Chance of flooding over 30 yrs
- —
- Est. flood insurance / yr
- —
Fire risk No data
- Est. fire insurance / yr
- —
Heat risk No data
- Hot days now (above threshold)
- —
- Hot days in 30 yrs
- —
Wind risk No data
- Chance of severe wind over 30 yrs
- —
Air-quality risk No data
- Unhealthy air days now
- —
- Unhealthy air days in 30 yrs
- —
Risk factors via First Street. Map © Google.
Why this score? — see what drove the B grade
The composite is a weighted blend of 9 inputs, each scored 0–100. Each bar is that input's sub-score; the figure is the points it added to the 100-point composite (weight × sub-score).
- Cash flow +30.0/30.0
- 1% rule +10.0/10.0
- DSCR +10.0/10.0
- ARV discount +7.5/15.0
- Livability +4.0/5.0
- Condition / age +4.0/5.0
- Rent growth +3.1/5.0
- Schools +2.5/10.0
- Appreciation +0.0/10.0
$116,405
🖨 Deal sheet 📄 Offer letter ✓ Due diligence
Listing remarks MLS
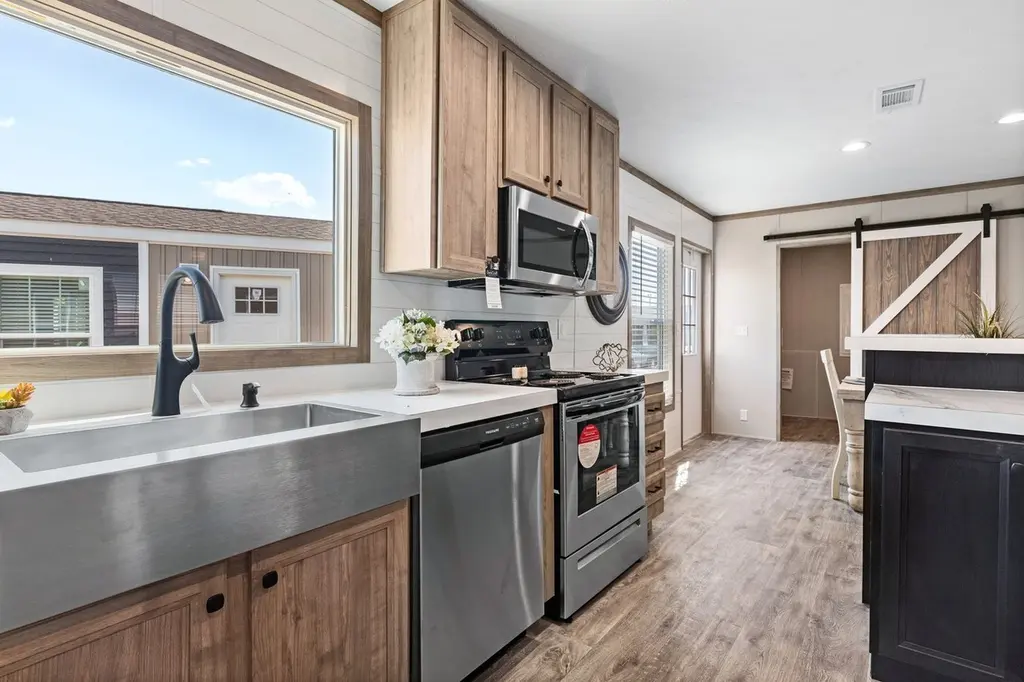
The Clayton Crazy Eights offers a thoughtfully designed living space with 4 bedrooms and 2 bathrooms, encompassing approximately 1,475 square feet. Its open-concept layout seamlessly connects the living, dining, and kitchen areas, creating an inviting atmosphere for family gatherings and entertaining. The split-bedroom design ensures privacy, with the primary suite featuring a spacious ensuite bathroom and a generous walk-in closet. Key Features: Open-concept floor plan Modern kitchen with island and ample cabinetry Split-bedroom layout for added privacy Primary suite with ensuite bathroom and walk-in closet Energy-efficient appliances Utility room with washer/dryer hookups Available in multiple interior color packages https://www. livecivitas.com/floor-plans/crazy-eights
Key facts
- Split-bedroom layout
- Walk-in closet
- Listed 384 days
Tags
Neighborhood map
What this means for you Summary
Snapshot
- This is a 4-bed/2.0-bath manufactured listed at $116k. Condition is rated good.
Deal economics
- At list price, monthly cash flow is $1k ($14k/yr) — positive.
- The deal already cash-flows at list — no discount required.
- Meets the 1% rule at list price ($3k rent vs $116k).
- Recommended offer: $102k (12.0% below list) — sets the bar for market timing.
- Cap rate 18.6% vs local median 3.9% in Fort Worth — top-decile yield for the area; either an underpriced asset or a hidden risk that comps aren't pricing in. Stress-test before assuming the spread holds.
Location & tenants
- Location reads 80/100 on livability (#49 in TX, #1,954 nationally) — a professional / high-income tenant draw. Strengths: amenities A+, cost of living A+, housing A+; Watch: schools D+, crime F.
- Crowley ISD (urban): math 23% / reading 32% proficiency, ranked #643 of 826 in TX (top 78%) — low school quality limits family demand, transient renter base, plan for 1-2y turnover.
- Market conditions: Rents rising (+2.3%/yr); 1018 active listings in the ZIP; 1 comparable units currently listed for rent nearby; solid renter incomes; 18,938 units permitted in Tarrant County in 2024 (8,336 in 5+ unit buildings).
- This rent runs 31% of the median local income ($98k/yr) — at the standard rent-burdened threshold; future hikes will face affordability resistance.
Forward outlook
- Local home prices are declining (-3.0%/yr); year-one equity from $805 of loan paydown is wiped out by about $3k of value loss. Plan a longer hold.
- Tarrant County population projected at +41% by 2050 — long-run rental-demand tailwind backs the buy-and-hold thesis.
- At projected returns (-3.0% appreciation + 2.3% rent growth), your $33k cash investment doubles in ~3 years — after that, you're playing with house money.
Negotiation context
- It's been on market 385 days — a 12% lower offer ($102k) is reasonable based on typical stale-listing flexibility.
- 2 sale attempts with the ask held roughly flat each time — persistent listings suggest the price (not the market) is what's stuck; bring a comps-based counter.
Questions for the listing agent
- It's been on market 385 days. Have you received any prior offers? Is the seller open to a 12% concession, seller financing, or rate buy-down credit?
- Why hasn't it sold? Are there any deal-killer items the seller is aware of (foundation, flood, title, zoning, code violations)?
- Is there a deadline driving the sale (1031 exchange, divorce, estate, relocation)? That informs how much negotiation room exists.
- Schools are D-rated, which usually means shorter tenancies and higher turnover. Who's the typical renter profile here, and what's been the actual vacancy rate?
- Crime grade is F in this area — have there been break-ins, vandalism, or insurance claims at this property in the last 3 years? What carrier currently insures it and at what premium?
- What's the average days-on-market for RENTAL listings here right now (not sales)? A rising rental-DOM trend means longer vacancies and softer asking-rent achievability than the comps imply.
- What's the recent tenant-quality profile in this submarket — average credit score on applications, eviction rate, late-payment / NSF rate, and stable-employment percentage? A property-management company in the area should have these aggregated.
- How much new for-sale + rental construction is in the pipeline within 1–3 miles? Heavy new supply typically softens prices + rents 12–24 months out; constrained supply supports both.
Investment metrics
- 1% rule
- 2.17% ✓
- Cap rate
- 18.55%
- Cash-on-cash
- 43.78%
- DSCR
- 2.95
- GRM
- 3.8
CMA / ARV
No comps found within radius.
Projected returns pro-forma
-3.0% appreciation · 2.28% rent growth · sell at horizon
- IRR
- 39.9%
- Equity multiple
- 2.69×
- Total profit
- $55,089
- Equity at exit
- $17,356
- IRR
- 45.9%
- Equity multiple
- 5.24×
- Total profit
- $138,297
- Equity at exit
- $10,065
Cash invested: $32,593 (down + closing). Projections, not guarantees.
Landlord ↔ Tenant lean methodology
- Overall (STATE)
- 87 Strongly Landlord-Friendly
- State Texas
- 87 Strongly Landlord-Friendly · R+5
- County
- — inherits STATE
- City
- — inherits STATE
ZIP-level market 76036
- Home prices YoY
- -25.2%
- Rents YoY
- 2.3%
- Active inventory
- 1018
- Price-to-rent
- 3.8×
Monthly cashflow live
- Estimated rent
- $2,523 medium interval (Pro) →
- Mortgage (P&I)
- −$610
- Tax est. 1.5%
- −$146 /mo · $1,746/yr
- Insurance
- −$49
- HOA
- −$0
- Vacancy / Maint / Mgmt
- −$530
- Net cashflow
- $1,189
Break-even live
UW: 25.0% down · 7.5% · 30yr · 1.5% tax · 5.0% vac · 8.0% maint · 8.0% mgmt
Financing live
Cash to close
- Down payment
- $29,101
- Closing costs
- $3,492
- Reserves months
- —
- Total cash needed
- —
Loan-product check · same deal, 3 products live
Conventional
25% down · 7.5% · 30yr
- Down + closing
- —
- Monthly P&I
- —
- Monthly cashflow
- —
- DSCR
- —
- Eligible?
- —
Personal DTI + credit; lowest rate.
DSCR
20% down · 8.5% · 30yr
- Down + closing
- —
- Monthly P&I
- —
- Monthly cashflow
- —
- DSCR
- —
- Eligible?
- —
No personal income docs; deal must DSCR.
Hard money
10% down · 12.0% · 12mo
- Down + closing
- —
- Monthly P&I
- —
- Monthly cashflow
- —
- DSCR
- —
- Eligible?
- —
Short-term bridge; refi at stabilization.
Rent comps 1 comps
| Address | Beds | Baths | Sqft | Rent | $/sqft | DOM | Units | Dist |
|---|---|---|---|---|---|---|---|---|
| 1804 Impala Dr Crowley, TX | 4.0 | 2.0 | 1960 | $2,500 | $1.28 | 4d | 1 | 1.33mi |
Listing history 17 events
-
2026-06-18days on market $116,405 Active 385 DOM
-
2026-06-17days on market $116,405 Active 384 DOM
-
2026-06-16days on market $116,405 Active 383 DOM
-
2026-06-15days on market $116,405 Active 382 DOM
-
2026-06-13days on market $116,405 Active 380 DOM
-
2026-06-13days on market $116,405 Active 379 DOM
-
2026-06-10days on market $116,405 Active 376 DOM
-
2026-06-09days on market $116,405 Active 371 DOM
-
2026-06-08days on market $116,405 Active 370 DOM
-
2026-06-07days on market $116,405 Active 369 DOM
-
2026-06-04days on market $116,405 Active 366 DOM
-
2026-06-03days on market $116,405 Active 365 DOM
-
2026-06-02days on market $116,405 Active 364 DOM
-
2026-06-01days on market $116,405 Active 363 DOM
-
2026-05-31days on market $116,405 Active 362 DOM
-
2025-06-04$116,405 Active 784-char remark
Show marketing remark (784 chars)
The Clayton Crazy Eights offers a thoughtfully designed living space with 4 bedrooms and 2 bathrooms, encompassing approximately 1,475 square feet. Its open-concept layout seamlessly connects the living, dining, and kitchen areas, creating an inviting atmosphere for family gatherings and entertaining. The split-bedroom design ensures privacy, with the primary suite featuring a spacious ensuite bathroom and a generous walk-in closet. Key Features: Open-concept floor plan Modern kitchen with island and ample cabinetry Split-bedroom layout for added privacy Primary suite with ensuite bathroom and walk-in closet Energy-efficient appliances Utility room with washer/dryer hookups Available in multiple interior color packages https://www. livecivitas.com/floor-plans/crazy-eights
-
2025-05-30$116,405 Active 729-char remark
Show marketing remark (729 chars)
The Clayton Crazy Eights offers a thoughtfully designed living space with 4 bedrooms and 2 bathrooms, encompassing approximately 1,475 square feet. Its open-concept layout seamlessly connects the living, dining, and kitchen areas, creating an inviting atmosphere for family gatherings and entertaining. The split-bedroom design ensures privacy, with the primary suite featuring a spacious ensuite bathroom and a generous walk-in closet. Key Features: Open-concept floor plan Modern kitchen with island and ample cabinetry Split-bedroom layout for added privacy Primary suite with ensuite bathroom and walk-in closet Energy-efficient appliances Utility room with washer/dryer hookups Available in multiple interior color packages
ⓘ Source: listings_history table (triggers on properties + properties_extension) + one-shot
backfill from property_details.listing_events for pre-trigger history.
Nearby sold comps map
Loading sold comps map…
Walkable amenities ~0.75 mi
Loading nearby amenities…
Taxation est. · year 1
- Rental income
- $30,280
- − Mortgage interest
- −$6,520
- − Property taxes
- −$1,746
- − Insurance
- −$582
- − Repairs & maintenance
- −$2,422
- − Management
- −$2,422
- − Depreciation
- −$3,386
- Taxable income
- $13,201
- Est. tax owed @ 24.0%
- −$3,168
- After-tax cash flow
- $11,100/yr
For passive investors: Depreciation is non-cash, so a rental often shows a tax loss while cash-flowing — sheltering income. Rental losses are passive: they offset passive income freely, and up to $25,000/yr can offset ordinary (W-2) income if you actively participate and your MAGI is under $100k (phasing out to $0 by $150k); unused losses carry forward. On sale, claimed depreciation is recaptured at up to 25%, and gains may owe capital-gains tax (a 1031 exchange can defer both). Figures are a year-1 estimate at your 24.0% rate — not tax advice; consult a CPA.
Condition & rehab AI · 3 photos
This manufactured home presents as move-in ready with a good condition score and a cosmetic rehab level, offering a modern kitchen and a well-maintained interior. Potential value can be further increased with exterior improvements and smart home upgrades.
Value-add opportunities
- Both Painting exterior and landscaping — Enhances curb appeal and resale value.
- Both Upgrading window treatments — Improves energy efficiency and aesthetics.
- Both Adding smart home features — Enhances convenience and marketability.
- Both Upgrading flooring in bathrooms — Improves functionality and resale value.
- Both Upgrading lighting fixtures — Enhances ambiance and energy efficiency.
Renovation cost estimate screening
Value-add ROI direction
- Both Painting exterior and landscaping — Enhances curb appeal and resale value. ↑
- Both Upgrading window treatments — Improves energy efficiency and aesthetics. ↑
- Both Adding smart home features — Enhances convenience and marketability. ↑
- Both Upgrading flooring in bathrooms — Improves functionality and resale value. ↑
- Both Upgrading lighting fixtures — Enhances ambiance and energy efficiency. ↑
ⓘ Cost ranges are severity-bucket heuristics (US national rule-of-thumb). Get contractor quotes + a written scope before underwriting a rehab budget.
Schools (NCES district)
- District
- Crowley ISD
- NCES district ID
- 4815910
- Math proficiency
- 23% ▼ -15.00%
- Reading proficiency
- 32% ▼ -6.00%
- Median HH income
- $59,810
- Composite
- 25.04/100
- National rank
- #7549
- State rank
- #643 of 826 in TX
Livability — Fort Worth
- Score
- 80/100
- State rank
- #49
- US rank
- #1954
Category grades
Schools grade is shown separately in the Schools card above.
Census & demographics
- County
- Tarrant County · 2,033,669 people
- City population
- 911,619
- Metro
- Dallas-Fort Worth-Arlington, TX
- Population (ZIP)
- 36,044
- Household income
- $97,973
- Rent vs Own
- Severe rent burden
- 584.0
Population outlook (Tarrant County) Hauer SSP2
- Today (2025)
- 2,380,417 people
- By 2030
- 2,578,900 · +8.3%
- By 2040
- 2,974,995 · +25.0%
- By 2050
- 3,350,489 · +40.8%
- By 2075
- 4,216,909 · +77.2%
- By 2100
- 4,741,527 · +99.2%
Race, ethnicity, and origin ACS 2023
- Neighborhood character
- Diverse neighborhood (Simpson 0.65)
- Race & ethnicity
- White 48% Hispanic / Latino 28% Black 20% Two or more races 14% Asian 2%
- Hispanic origin (detail)
- Mexican 23% Puerto Rican 2%
- Common ancestry
- Slovak 3% Italian 2% Serbian 1%
- Foreign-born
- 8% · Canada, Vietnam
- Languages at home
- 79% English-only · Spanish 18% Other Indo-European 1% Vietnamese 1%
Political lean MEDSL · Tarrant
- 2024 margin
- Lean R (+5.1) · D 46.7% · R 51.9% · Other 1.4%
- 2008→2024 swing
- +6.6pp toward D · 2008: -11.7pp · 2024: -5.1pp
- All cycles
- 2024: R+5.1 2020: D+0.2 2016: R+8.7 2012: R+15.7 2008: R+11.7
Not yet ingested
- Civics
- —
Market trends
- HPI YoY
- ▼ -80.45%
- Current HPI
- 238.6365
- Rent YoY
- ▲ 2.28%
- Metro
- Dallas-Fort Worth-Arlington, TX
- State GDP YoY
- ▲ 3.95%
- F500 in state
- 110
Industry mix (Fortune 500 HQ in TX)
| Industry | F500 HQs | Revenue |
|---|---|---|
| Energy | 16 | $1,198B |
|
||
| Technology | 5 | $198B |
|
||
| Engineering / Construction | 4 | $72B |
|
||
| Energy Services | 3 | $60B |
|
||
| Utilities | 3 | $41B |
|
||
| Healthcare | 2 | $330B |
|
||
Price history
+0.0% since first listed2 events — show timeline
- 2025-06-04 Listed $116,405 Zillow
- 2025-05-30 Listed $116,405 Zillow
Cash-flow waterfall
monthlySold comps — $/sqft
last 12 mo · ≤1 miLoading sold comps…