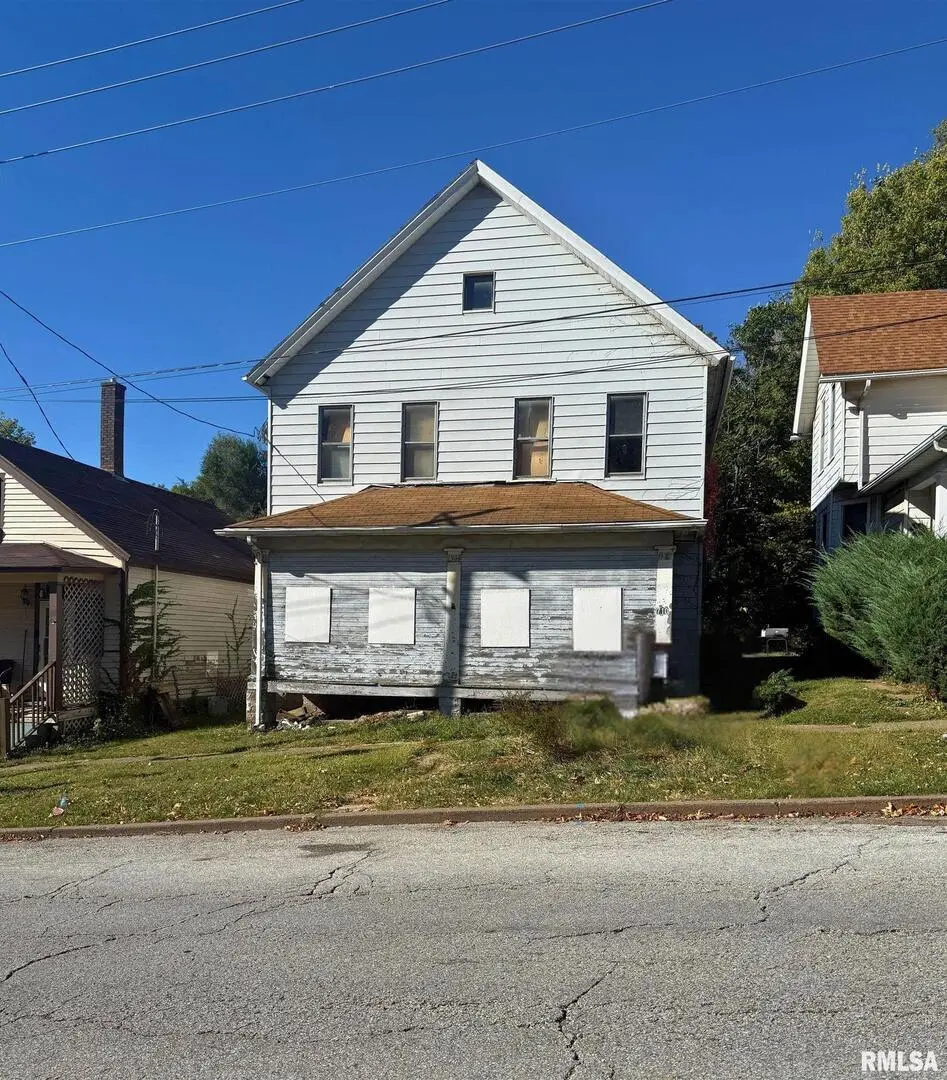
710 Gaines St · Davenport, IA
Flood risk 1/10 · Minimal
- FEMA flood zone
- X (unshaded)
- Chance of flooding over 30 yrs
- 0.0%
- Est. flood insurance / yr
- $473 – $860
Fire risk 1/10 · Minimal
- Est. fire insurance / yr
- $902 – $1,676
Heat risk 3/10 · Minor
- Hot days now (above 103°F)
- 7 days/yr
- Hot days in 30 yrs
- 16 days/yr
Wind risk 2/10 · Minimal
- Chance of severe wind over 30 yrs
- —
Air-quality risk 3/10 · Minor
- Unhealthy air days now
- 2 days/yr
- Unhealthy air days in 30 yrs
- 3 days/yr
Risk factors via First Street. Map © Google.
Why this score? — see what drove the C- grade
The composite is a weighted blend of 9 inputs, each scored 0–100. Each bar is that input's sub-score; the figure is the points it added to the 100-point composite (weight × sub-score).
- Cash flow +15.0/30.0
- ARV discount +15.0/15.0
- 1% rule +5.0/10.0
- DSCR +5.0/10.0
- Livability +4.0/5.0
- Schools +3.9/10.0
- Rent growth +2.5/5.0
- Condition / age +2.5/5.0
- Appreciation +0.0/10.0
$29,500
🖨 Deal sheet (PDF) 📄 Offer letter ✓ Due diligence
Listing remarks MLS
Large 2 story home located in Davenport Dream project area. Some rehab has been started on this 3 bedroom home, 1,680 SF, roughed in bathroom on main floor, lots of options with his home. No utilities are on.
Key facts
- Tons of potential
- 7,680 sq ft lot
- Built 1866
Tags
Property features AI
Finance
- Other: Property listed with RE/MAX Concepts Bettendorf
- HOA & community: No master association fee required
Exterior
- Utilities: Public water; Public sewer
- Home design: Detached single-family home; Two stories; Home age: 100+ years; Home built before 1978
- Construction: Frame construction with aluminum siding; Stone foundation; Asphalt roof
- Exterior features: Front porch; Level lot
Interior
- Kitchen: Kitchen on main level (11 x 11)
- Bedrooms: Master bedroom on second floor (13 x 12); Second bedroom on second floor (14 x 11); Third bedroom on second floor (10 x 8)
- Flooring: Other flooring throughout listed rooms
- Bathrooms: One full bathroom; One half bathroom
- Heating & cooling: Natural gas heating
- Interior features: Six total rooms; Separate dining room; Family room; Living room; Full basement with egress window
- Laundry & utility: Laundry room
Neighborhood map
What this means for you Summary
Snapshot
- This is a 3-bed/1.0-bath single-family listed at $30k.
Deal economics
- At list price, monthly cash flow is $877 ($11k/yr) — positive.
- The deal already cash-flows at list — no discount required.
- Meets the 1% rule at list price ($1k rent vs $30k).
- Cap rate 42.0% vs local median 4.4% in Davenport — top-decile yield for the area; either an underpriced asset or a hidden risk that comps aren't pricing in. Stress-test before assuming the spread holds.
Location & tenants
- Location reads 79/100 on livability (#126 in IA, #2,312 nationally) — a middle-class / working-renter tenant base. Strengths: cost of living A+, housing A+, health & safety A+; Watch: employment C-, crime F.
- Davenport Community School District (urban): math 43% / reading 50% proficiency, ranked #288 of 289 in IA (top 100%) — families likely to look elsewhere, expect single-tenant / working-renter base with shorter leases.
- Zoned schools: Jefferson Elementary School (math 21% / reading 24%, grade F, #615 of 616 statewide, top 100%, 460 students, 71% FRL); Central High School (math 45% / reading 64%, grade C-, #290 of 336 statewide, top 87%, 1,505 students, 47% FRL) — zoned schools at 59% FRL track the district average.
- Market conditions: 67 active listings in the ZIP; 33 comparable units currently listed for rent nearby; rentals lingering (median 46d on market — plan ~5-8 weeks vacancy on turnover, expect pricing pressure); 58% of comp listings sitting > 30 days — soft ceiling on asking rent; 805 units permitted in Scott County in 2024 (479 in 5+ unit buildings).
- This rent runs 31% of the median local income ($54k/yr) — at the standard rent-burdened threshold; future hikes will face affordability resistance.
Forward outlook
- Local home prices are declining (-3.0%/yr); year-one equity from $204 of loan paydown is wiped out by about $885 of value loss. Plan a longer hold.
- Scott County population projected at +19% by 2050 — long-run rental-demand tailwind backs the buy-and-hold thesis.
- At projected returns (-3.0% appreciation + 3.0% rent growth), your $8k cash investment doubles in ~1 year — after that, you're playing with house money.
Negotiation context
- Only 1 days on market — expect competitive offers; lowballing is unlikely to land.
- 8 sale attempts since 9y ago with the ask held roughly flat each time — persistent listings suggest the price (not the market) is what's stuck; bring a comps-based counter.
- Current owner paid $16k; list at $30k implies a 84% gain — meaningful room to come down on a strong offer.
Risks & watch-outs
- Watch-outs: property tax is 3.2% of price; built in 1866 — expect roof / HVAC / electrical / plumbing capex.
Questions for the listing agent
- Built in 1866 — when were the roof, HVAC, electrical panel, plumbing, and water heater last replaced?
- Property tax is high relative to price — has the assessment been appealed recently, and will the sale trigger a re-assessment?
- Is there a deadline driving the sale (1031 exchange, divorce, estate, relocation)? That informs how much negotiation room exists.
- Crime grade is F in this area — have there been break-ins, vandalism, or insurance claims at this property in the last 3 years? What carrier currently insures it and at what premium?
- What's the average days-on-market for RENTAL listings here right now (not sales)? A rising rental-DOM trend means longer vacancies and softer asking-rent achievability than the comps imply.
- What's the recent tenant-quality profile in this submarket — average credit score on applications, eviction rate, late-payment / NSF rate, and stable-employment percentage? A property-management company in the area should have these aggregated.
- How much new for-sale + rental construction is in the pipeline within 1–3 miles? Heavy new supply typically softens prices + rents 12–24 months out; constrained supply supports both.
Investment metrics
- 1% rule
- 4.82% ✓
- Cap rate
- 41.98%
- Cash-on-cash
- 127.45%
- DSCR
- 6.67
- GRM
- 1.7
CMA / ARV
- ARV (median comp)
- $53,345
- List price
- $29,500
- Delta
- -71.88%
- Verdict
- UNDERPRICED
- Comps
- 20 within 1.0 mi
Show comp detail 12 sales within ~0.75 mi
| Address | Dist | Beds/Ba | Sqft | Sold | Price | $/sf | Match |
|---|---|---|---|---|---|---|---|
| 617 Warren St | 0.13mi | 3/1.0 | 1,565 (-7%) | 1mo | $85,000 | $54 | 81 |
| 1127 N Ripley St St | 0.41mi | 4/1.0 (+1) | 1,660 (-1%) | 3mo | $93,000 | $56 | 71 |
| 903 Vine St | 0.24mi | 3/— | 1,880 (+12%) | 3mo | $21,600 | $11 | 66 |
| 1121 W 15th St | 0.63mi | 3/1.5 | 1,699 (+1%) | 1mo | $129,000 | $76 | 66 |
| 727 W 11th St | 0.26mi | 3/1.0 | 1,428 (-15%) | 1mo | $65,000 | $46 | 62 |
| 715 Iowa St | 0.72mi | 3/2.0 | 1,710 (+2%) | 1mo | $94,000 | $55 | 59 |
| 1321 W 13th St St | 0.60mi | 4/1.0 (+1) | 1,808 (+8%) | 4mo | $86,500 | $48 | 51 |
| 1034 W 14th St | 0.56mi | 4/1.5 (+1) | 1,544 (-8%) | 6mo | $140,000 | $91 | 48 |
| 1527 N Marquette St | 0.73mi | 4/1.5 (+1) | 1,558 (-7%) | 1mo | $80,444 | $52 | 46 |
| 1222 Pershing Ave | 0.73mi | 4/1.5 (+1) | 1,800 (+7%) | 3mo | $90,000 | $50 | 45 |
| 1307 Gaines St | 0.43mi | 2/2.0 (-1) | 1,510 (-10%) | 20mo | $140,000 | $93 | 38 |
| 1012 W 16th St | 0.68mi | 4/1.0 (+1) | 1,917 (+14%) | 4mo | $165,000 | $86 | 37 |
Match score weights: distance 35% · size 25% · config 20% · recency 20%. Top-matched comps best support the ARV.
Projected returns pro-forma
-3.0% appreciation · 3.0% rent growth · sell at horizon
- IRR
- —
- Equity multiple
- 7.19×
- Total profit
- $51,140
- Equity at exit
- $4,399
- IRR
- —
- Equity multiple
- 15.12×
- Total profit
- $116,669
- Equity at exit
- $2,551
Cash invested: $8,260 (down + closing). Projections, not guarantees.
Landlord ↔ Tenant lean methodology
- Overall (STATE)
- 83 Strongly Landlord-Friendly
- State Iowa
- 83 Strongly Landlord-Friendly · R+6
- County
- — inherits STATE
- City
- — inherits STATE
ZIP-level market 52802
- Home prices YoY
- -28.3%
- Active inventory
- 67
- Price-to-rent
- 1.7×
Monthly cashflow live
- Estimated rent
- $1,422 high interval (Pro) →
- Mortgage (P&I)
- −$155
- Tax from tax record
- −$79 /mo · $946/yr
- Insurance
- −$12
- HOA
- −$0
- Vacancy / Maint / Mgmt
- −$299
- Net cashflow
- $877
Break-even live
Sensitivity live
| Price | -10% $894 | -5% $886 | +0% $877 | +5% $869 | +10% $861 |
|---|---|---|---|---|---|
| Rent | -10% $765 | -5% $821 | +0% $877 | +5% $933 | +10% $990 |
| Rate | -1.0pp $892 | -0.5pp $885 | base $877 | +0.5pp $870 | +1.0pp $862 |
UW: 25.0% down · 7.5% · 30yr · 1.5% tax · 5.0% vac · 8.0% maint · 8.0% mgmt
Financing live
Cash to close
- Down payment
- $7,375
- Closing costs
- $885
- Reserves months
- —
- Total cash needed
- —
Loan-product check · same deal, 3 products live
Conventional
25% down · 7.5% · 30yr
- Down + closing
- —
- Monthly P&I
- —
- Monthly cashflow
- —
- DSCR
- —
- Eligible?
- —
Personal DTI + credit; lowest rate.
DSCR
20% down · 8.5% · 30yr
- Down + closing
- —
- Monthly P&I
- —
- Monthly cashflow
- —
- DSCR
- —
- Eligible?
- —
No personal income docs; deal must DSCR.
Hard money
10% down · 12.0% · 12mo
- Down + closing
- —
- Monthly P&I
- —
- Monthly cashflow
- —
- DSCR
- —
- Eligible?
- —
Short-term bridge; refi at stabilization.
Rent comps 33 comps
| Address | Beds | Baths | Sqft | Rent | $/sqft | DOM | Units | Dist |
|---|---|---|---|---|---|---|---|---|
| 1315 Brown St Unit 2 Davenport, IA | 3.0 | 1.0 | 1300 | $1,250 | $0.96 | 22d | 1 | 0.46mi |
| 1323 N Gaines St Davenport, IA | 4.0 | 2.0 | 1733 | $1,350 | $0.78 | 22d | 1 | 0.46mi |
| 915 W 14th St Davenport, IA | 3.0 | 1.0 | 1390 | $900 | $0.65 | 45d | 1 | 0.51mi |
| 427 N Brady St Unit 1 Davenport, IA | 3.0 | 1.5 | 1126 | $1,359 | $1.21 | 45d | 1 | 0.52mi |
| 401 Brady St Davenport, IA | 1.0–3.0 | 1.0–2.0 | 870 | $2,100 | $2.41 | 15d | 2 | 0.52mi |
| 621 W 15th St Davenport, IA | 4.0 | 2.0 | 1833 | $1,500 | $0.82 | 15d | 1 | 0.55mi |
| 212 N Brady St Davenport, IA | 2.0–3.0 | 2.0–3.0 | 1428 | $2,600 | $1.82 | 15d | 4 | 0.58mi |
| 537 W 16th St Davenport, IA | 3.0 | 1.0 | 1311 | $1,400 | $1.07 | 45d | 1 | 0.62mi |
| 200 E 3rd St Davenport, IA | 1.0–2.0 | 1.0–2.0 | 900 | $1,700 | $1.89 | 15d | 2 | 0.63mi |
| 1511 N Ripley St Davenport, IA | 4.0 | 2.0 | 1872 | $1,450 | $0.77 | 22d | 1 | 0.64mi |
| 511 Pershing Ave Unit 407W Davenport, IA | 2.0 | 2.0 | 1175 | $1,568 | $1.33 | 45d | 1 | 0.64mi |
| 511 Pershing Ave Unit 402W Davenport, IA | 2.0 | 2.0 | 1106 | $1,478 | $1.34 | 45d | 1 | 0.64mi |
| 511 Pershing Ave Unit 106E Davenport, IA | 3.0 | 2.0 | 1349 | $1,996 | $1.48 | 45d | 1 | 0.64mi |
| 511 Pershing Ave Unit 202W Davenport, IA | 2.0 | 1.0 | 1201 | $1,601 | $1.33 | 45d | 1 | 0.64mi |
| 511 Pershing Ave Unit 102W Davenport, IA | 2.0 | 1.0 | 1173 | $1,506 | $1.28 | 45d | 1 | 0.64mi |
| 511 Pershing Ave Unit 301E Davenport, IA | 3.0 | 2.0 | 1429 | $2,126 | $1.49 | 45d | 1 | 0.64mi |
| 511 Pershing Ave Unit 101W Davenport, IA | 2.0 | 1.0 | 1280 | $1,704 | $1.33 | 45d | 1 | 0.64mi |
| 511 Pershing Ave Unit 105E Davenport, IA | 2.0 | 2.0 | 1100 | $1,635 | $1.49 | 45d | 1 | 0.64mi |
| 119 E 13th St Davenport, IA | 3.0 | 1.0 | 1728 | $1,495 | $0.87 | 45d | 1 | 0.65mi |
| 1421 N Main St #2 Davenport, IA | 3.0 | 1.0 | 1350 | $1,095 | $0.81 | 45d | 1 | 0.65mi |
| 1519 N Ripley St Davenport, IA | 2.0 | 1.0 | 1144 | $1,100 | $0.96 | 15d | 1 | 0.65mi |
| 427 Pershing Ave Davenport, IA | 3.0 | 2.0 | 1438 | $2,288 | $1.59 | 15d | 3 | 0.66mi |
| 324 S Brady St Davenport, IA | 1.0–2.0 | 1.0–2.0 | 965 | $1,700 | $1.76 | 22d | 2 | 0.71mi |
| 616 E 6th St Davenport, IA | 4.0 | 1.0 | 1578 | $1,712 | $1.08 | 45d | 1 | 0.89mi |
| 317 Kirkwood Blvd Davenport, IA | 2.0 | 1.0 | 1300 | $950 | $0.73 | 45d | 1 | 0.90mi |
| 1716 W 7th St Davenport, IA | 4.0 | 1.0 | 1278 | $1,712 | $1.34 | 15d | 1 | 0.91mi |
| 736 Federal St Davenport, IA | 1.0–3.0 | 1.0–2.0 | 1186 | $1,868 | $1.57 | 22d | 1 | 1.02mi |
| 2224 Iowa St Unit 2224 Davenport, IA | 2.0 | 1.0 | 1214 | $925 | $0.76 | 45d | 1 | 1.24mi |
| 2224 Iowa St Davenport, IA | 2.0 | 1.0 | 1214 | $895 | $0.74 | 45d | 1 | 1.24mi |
| 1017 E 13th St Unit 1017 Davenport, IA | 2.0 | 1.0 | 1335 | $950 | $0.71 | 22d | 1 | 1.25mi |
| 1723 W Locust St Davenport, IA | 3.0 | 1.0 | 1690 | $1,395 | $0.83 | 45d | 1 | 1.26mi |
| 1912 Dixwell St Davenport, IA | 4.0 | 2.0 | 1116 | $1,300 | $1.16 | 45d | 1 | 1.29mi |
| 2209 Farnam St Unit 2211 Davenport, IA | 3.0 | 1.0 | 1138 | $1,050 | $0.92 | 22d | 1 | 1.35mi |
Listing history 24 events
-
2026-06-07pricedays on market $29,500 Pending 1 DOM
-
2026-05-18price $15,000
-
2026-04-21price $18,900
-
2026-03-17price $19,900
-
2026-01-19status Active
-
2026-01-14historical
-
2026-01-08status Active
-
2026-01-06historical
-
2026-01-05historical
-
2025-11-18price
-
2025-11-07price
-
2025-10-20Active
-
2024-08-05soldstatus $17,500 208-char remark
Show marketing remark (208 chars)
Large 2 story home located in Davenport Dream project area. Some rehab has been started on this 3 bedroom home, 1,680 SF, roughed in bathroom on main floor, lots of options with his home. No utilities are on.
-
2024-08-05soldstatus $17,500 Closed 208-char remark
Show marketing remark (208 chars)
Large 2 story home located in Davenport Dream project area. Some rehab has been started on this 3 bedroom home, 1,680 SF, roughed in bathroom on main floor, lots of options with his home. No utilities are on.
-
2024-06-20status Pending 208-char remark
Show marketing remark (208 chars)
Large 2 story home located in Davenport Dream project area. Some rehab has been started on this 3 bedroom home, 1,680 SF, roughed in bathroom on main floor, lots of options with his home. No utilities are on.
-
2024-05-22price $22,500 208-char remark
Show marketing remark (208 chars)
Large 2 story home located in Davenport Dream project area. Some rehab has been started on this 3 bedroom home, 1,680 SF, roughed in bathroom on main floor, lots of options with his home. No utilities are on.
-
2024-05-04price $27,500 208-char remark
Show marketing remark (208 chars)
Large 2 story home located in Davenport Dream project area. Some rehab has been started on this 3 bedroom home, 1,680 SF, roughed in bathroom on main floor, lots of options with his home. No utilities are on.
-
2024-04-10$22,500 208-char remark
Show marketing remark (208 chars)
Large 2 story home located in Davenport Dream project area. Some rehab has been started on this 3 bedroom home, 1,680 SF, roughed in bathroom on main floor, lots of options with his home. No utilities are on.
-
2024-04-10$39,500 Active 208-char remark
Show marketing remark (208 chars)
Large 2 story home located in Davenport Dream project area. Some rehab has been started on this 3 bedroom home, 1,680 SF, roughed in bathroom on main floor, lots of options with his home. No utilities are on.
-
2021-08-06historical
-
2017-04-24soldstatus $8,500
-
2017-04-24soldstatus $8,500
-
2017-03-14$10,000
-
2017-03-14$10,000
ⓘ Source: listings_history table (triggers on properties + properties_extension) + one-shot
backfill from property_details.listing_events for pre-trigger history.
Tax reassessment forecast IA · Partial reset (capped growth)
- Current annual tax
- $946 · $79/mo
- Projected year-2 tax
- $946 · $79/mo
- Expected delta
- $0/yr ($0/mo · 0.0%)
ⓘ Screening estimate from a state-policy table — verify with the county assessor before closing.
Climate risk First Street
- Flood 1/10 Low FEMA zone X (unshaded) · 0% chance over 30 yrs
- Wildfire 1/10 Low
- Heat 3/10 Moderate 7 d/yr ≥103°F today · 16 d/yr by 30 yrs out
- Wind 2/10 Low
- Air quality 3/10 Moderate 2 unhealthy d/yr today · 3 by 30 yrs out
Nearby sold comps map
Loading sold comps map…
Walkable amenities ~0.75 mi
Loading nearby amenities…
Taxation est. · year 1
- Rental income
- $17,059
- − Mortgage interest
- −$1,652
- − Property taxes
- −$946
- − Insurance
- −$148
- − Repairs & maintenance
- −$1,365
- − Management
- −$1,365
- − Depreciation
- −$858
- Taxable income
- $10,726
- Est. tax owed @ 24.0%
- −$2,574
- After-tax cash flow
- $7,953/yr
For passive investors: Depreciation is non-cash, so a rental often shows a tax loss while cash-flowing — sheltering income. Rental losses are passive: they offset passive income freely, and up to $25,000/yr can offset ordinary (W-2) income if you actively participate and your MAGI is under $100k (phasing out to $0 by $150k); unused losses carry forward. On sale, claimed depreciation is recaptured at up to 25%, and gains may owe capital-gains tax (a 1031 exchange can defer both). Figures are a year-1 estimate at your 24.0% rate — not tax advice; consult a CPA.
Schools (NCES district)
- District
- Davenport Community School District
- NCES district ID
- 1908580
- Math proficiency
- 43% ▼ -11.00%
- Reading proficiency
- 50% ▼ -3.00%
- Median HH income
- $46,157
- Composite
- 39.49/100
- National rank
- #3951
- State rank
- #288 of 289 in IA
Livability — Davenport
- Score
- 79/100
- State rank
- #126
- US rank
- #2312
Category grades
Schools grade is shown separately in the Schools card above.
Census & demographics
- Census place
- Davenport, IA
- County
- Scott County · 144,583 people
- City population
- 103,319
- Metro
- Davenport-Moline-Rock Island, IA-IL
- Population (ZIP)
- 9,466
- Household income
- $54,380
- Rent vs Own
- Severe rent burden
- 244.0
Population outlook (Scott County) Hauer SSP2
- Today (2025)
- 188,878 people
- By 2030
- 196,648 · +4.1%
- By 2040
- 210,860 · +11.6%
- By 2050
- 224,359 · +18.8%
- By 2075
- 258,884 · +37.1%
- By 2100
- 286,447 · +51.7%
Race, ethnicity, and origin ACS 2023
- Neighborhood character
- Predominantly White (71%)
- Race & ethnicity
- White 71% Hispanic / Latino 14% Two or more races 10% Black 5% Asian 1%
- Hispanic origin (detail)
- Mexican 13%
- Common ancestry
- Romanian 2% Lithuanian 1% Italian 1%
- Foreign-born
- 4% · Canada, Vietnam
- Languages at home
- 92% English-only · Spanish 7%
Political lean MEDSL · Scott
- 2024 margin
- Toss-up / Even · D 47.3% · R 51.2% · Other 1.4%
- 2008→2024 swing
- -18.4pp toward R · 2008: 14.6pp · 2024: -3.9pp
- All cycles
- 2024: R+3.9 2020: D+3.5 2016: D+1.4 2012: D+13.8 2008: D+14.6
Not yet ingested
- Civics
- —
Market trends
- HPI YoY
- ▼ -59.59%
- Current HPI
- 151.2076
- Rent YoY
- —
- Metro
- Davenport-Moline-Rock Island, IA-IL
- State GDP YoY
- ▲ 2.48%
- F500 in state
- 4
Industry mix (Fortune 500 HQ in IA)
| Industry | F500 HQs | Revenue |
|---|---|---|
| Financial Services | 1 | $16B |
|
||
| Retail / Convenience | 1 | $15B |
|
||
Price history
+60.0% since first listed28 events — show timeline
- 2026-06-17 Sold (MLS) $16,000 MRED as Distributed by MLS Grid
- 2026-06-05 Pending — MRED as Distributed by MLS Grid
- 2026-06-05 Listed $29,500 MRED as Distributed by MLS Grid
- 2026-05-22 Pending — MRED as Distributed by MLS Grid
- 2026-05-21 Listing Removed — MRED as Distributed by MLS Grid
- 2026-05-18 Price Changed — MRED as Distributed by MLS Grid
- 2026-04-21 Price Changed — MRED as Distributed by MLS Grid
- 2026-03-17 Price Changed — MRED as Distributed by MLS Grid
- 2026-01-19 Relisted — MRED as Distributed by MLS Grid
- 2026-01-14 Listing Removed — MRED as Distributed by MLS Grid
- 2026-01-08 Relisted — MRED as Distributed by MLS Grid
- 2026-01-06 Listing Removed — RMLSA as Distributed by MLS Grid
- 2026-01-05 Listing Removed — MRED as Distributed by MLS Grid
- 2025-11-18 Price Changed — RMLSA as Distributed by MLS Grid
- 2025-11-07 Price Changed — RMLSA as Distributed by MLS Grid
- 2025-10-20 Listed — RMLSA as Distributed by MLS Grid
- 2024-08-05 Sold (MLS) $17,500 RMLSA as Distributed by MLS Grid
- 2024-08-05 Sold (MLS) $17,500 MRED as Distributed by MLS Grid
- 2024-06-20 Pending — RMLSA as Distributed by MLS Grid
- 2024-05-22 Price Changed $22,500 RMLSA as Distributed by MLS Grid
- 2024-05-04 Price Changed $27,500 RMLSA as Distributed by MLS Grid
- 2024-04-10 Listed $39,500 RMLSA as Distributed by MLS Grid
- 2024-04-10 Listed $22,500 MRED as Distributed by MLS Grid
- 2021-08-06 Listing Removed — RMLSA as Distributed by MLS Grid
- 2017-04-24 Sold (MLS) $8,500 RMLSA as Distributed by MLS Grid
- 2017-04-24 Sold (MLS) $8,500 MRED as Distributed by MLS Grid
- 2017-03-14 Listed $10,000 RMLSA as Distributed by MLS Grid
- 2017-03-14 Listed $10,000 MRED as Distributed by MLS Grid
Property tax history
+1.0%/yrLatest (2025): $946 · -2.2% YoY. Source: county tax records.
Cash-flow waterfall
monthlySold comps — $/sqft
last 12 mo · ≤1 miLoading sold comps…