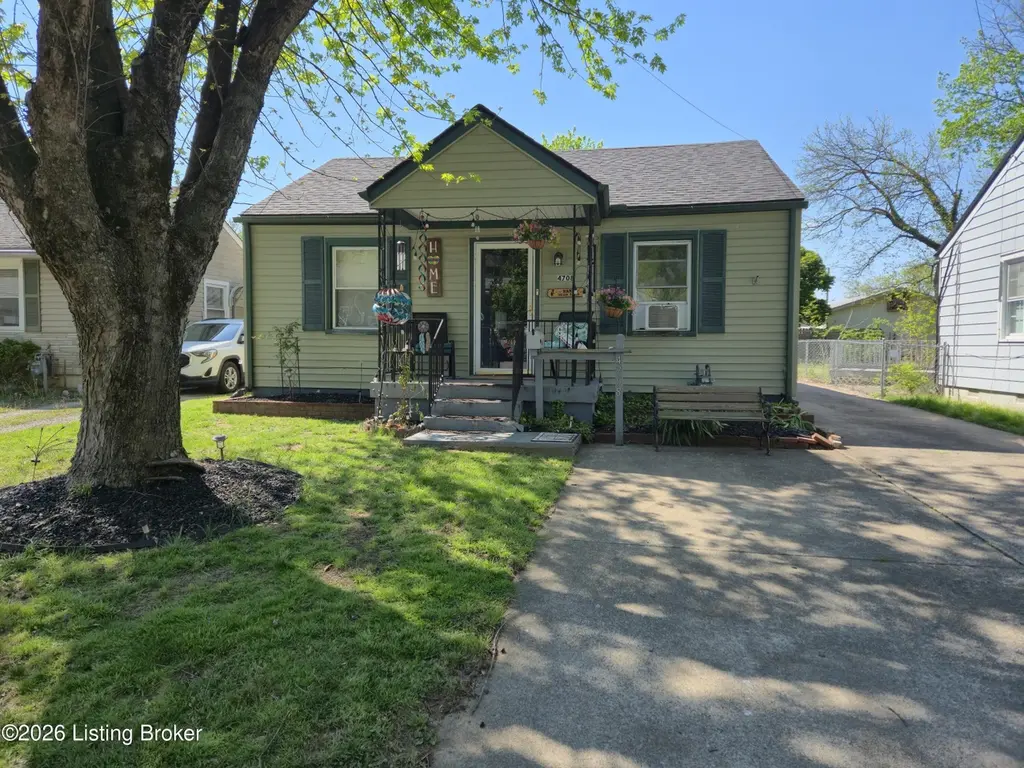
4708 S Rutland Ave · Louisville, KY
Flood risk 4/10 · Minor
- FEMA flood zone
- X (unshaded)
- Chance of flooding over 30 yrs
- 0.22%
- Est. flood insurance / yr
- $507 – $1,088
Fire risk 1/10 · Minimal
- Est. fire insurance / yr
- $839 – $1,559
Heat risk 5/10 · Moderate
- Hot days now (above 105°F)
- 6 days/yr
- Hot days in 30 yrs
- 18 days/yr
Wind risk 2/10 · Minimal
- Chance of severe wind over 30 yrs
- 1.0%
Air-quality risk 2/10 · Minimal
- Unhealthy air days now
- 1 days/yr
- Unhealthy air days in 30 yrs
- 3 days/yr
Risk factors via First Street. Map © Google.
Why this score? — see what drove the D+ grade
The composite is a weighted blend of 9 inputs, each scored 0–100. Each bar is that input's sub-score; the figure is the points it added to the 100-point composite (weight × sub-score).
- ARV discount +13.9/15.0
- Cash flow +13.7/30.0
- DSCR +4.1/10.0
- Rent growth +3.8/5.0
- 1% rule +3.5/10.0
- Livability +3.2/5.0
- Condition / age +2.5/5.0
- Schools +2.3/10.0
- Appreciation +0.0/10.0
$150,000
🖨 Deal sheet 📄 Offer letter ✓ Due diligence
Listing remarks MLS
With plenty of potential to make it truly your own, this home features 3 bedrooms and 1.5 baths. Fantastic location in a quiet cul-de-sac while also enjoying the convenience of close proximity to Watterson Express and Iroquois Park. The inviting living room opens into the kitchen for the perfect hospitality space for friends and family. Take advantage of the warmer weather and enjoy the spacious deck and fenced-in backyard. Large 2-car garage is perfect for your storage needs and parking. All appliances, washer/dryer, and window units will remain with the home.
Key facts
- Spacious living area
- Flexible floor plan
- Single-level living
Tags
Property features AI
Finance
- Other: Subdivision: SOUTHERN HEIGHTS
- HOA & community: No association fee
Exterior
- Parking: Detached 2-car garage
- Utilities: Electricity connected
- Home design: Single-family ranch-style home; One story; Built in 1950
- Construction: Vinyl siding with wood frame construction; Shingle roof; Crawl space foundation
- Exterior features: Wood and chain-link fencing; Located on a cul-de-sac
Interior
- Kitchen: Kitchen on the first floor
- Bedrooms: Three bedrooms, all on the first floor
- Bathrooms: One full bathroom on the first floor; One half bathroom on the first floor
- Heating & cooling: Natural gas heating; Wall/window air conditioning units
- Interior features: Five total rooms; Six closets; No basement; First-floor laundry
- Laundry & utility: Laundry located on the first floor
Neighborhood map
What this means for you Summary
Snapshot
- This is a 3-bed/1.5-bath single-family listed at $150k.
Deal economics
- At list price, monthly cash flow is $10 ($122/yr) — positive.
- The deal already cash-flows at list — no discount required.
- To meet the 1% rule (rent ≥ 1% of price), the offer needs to be $128k (14.7% below list).
- Recommended offer: $128k (14.7% below list) — sets the bar for 1% rule.
- Cap rate 6.4% vs local median 5.0% in Louisville — meaningfully above typical; check what's discounted (condition, days-on-market, listing class) to confirm the premium yield is real.
Location & tenants
- Location reads 63/100 on livability (#333 in KY) — a middle-class / working-renter tenant base. Strengths: cost of living A+, housing A+; Watch: employment C-, health & safety D+, schools D-.
- Jefferson County (urban): math 19% / reading 35% proficiency, ranked #121 of 165 in KY (top 73%) — low school quality limits family demand, transient renter base, plan for 1-2y turnover.
- Market conditions: Rents rising fast (+5.2%/yr); 121 active listings in the ZIP; 40 comparable units currently listed for rent nearby; rentals at typical pace (median 17d on market — plan ~3-4 weeks tenant-placement turnaround); lower-income renter base — watch delinquency; 2,836 units permitted in Jefferson County in 2024 (1,558 in 5+ unit buildings).
- This rent runs 35% of the median local income ($44k/yr) — at the standard rent-burdened threshold; future hikes will face affordability resistance.
Forward outlook
- Local home prices are declining (-3.0%/yr); year-one equity from $1k of loan paydown is wiped out by about $4k of value loss. Plan a longer hold.
- Jefferson County population projected at +13% by 2050 — modest demand growth; plan on rents tracking national, not racing it.
Negotiation context
- Only 13 days on market — expect competitive offers; lowballing is unlikely to land.
- 3 sale attempts since 5y ago with the ask held roughly flat each time — persistent listings suggest the price (not the market) is what's stuck; bring a comps-based counter.
- Current owner paid $120k; 25% above their basis — modest negotiation headroom, anchor on the comps not their cost.
Risks & watch-outs
- Watch-outs: built in 1950 — expect roof / HVAC / electrical / plumbing capex.
- Climate carrying-cost: extreme-heat days projected 6→18/yr by 2055 (HVAC capex compounding) — expect insurance premiums to compound above CPI over the hold.
Questions for the listing agent
- Built in 1950 — when were the roof, HVAC, electrical panel, plumbing, and water heater last replaced?
- Is there a deadline driving the sale (1031 exchange, divorce, estate, relocation)? That informs how much negotiation room exists.
- Schools are D-rated, which usually means shorter tenancies and higher turnover. Who's the typical renter profile here, and what's been the actual vacancy rate?
- Crime grade is F in this area — have there been break-ins, vandalism, or insurance claims at this property in the last 3 years? What carrier currently insures it and at what premium?
- The area grade is low — what's the realistic commute time and amenity access for the typical tenant pool here? Any planned neighborhood developments (good or bad) we should know about?
- What's the average days-on-market for RENTAL listings here right now (not sales)? A rising rental-DOM trend means longer vacancies and softer asking-rent achievability than the comps imply.
- What's the recent tenant-quality profile in this submarket — average credit score on applications, eviction rate, late-payment / NSF rate, and stable-employment percentage? A property-management company in the area should have these aggregated.
- How much new for-sale + rental construction is in the pipeline within 1–3 miles? Heavy new supply typically softens prices + rents 12–24 months out; constrained supply supports both.
Investment metrics
- 1% rule
- 0.85% ✗
- Cap rate
- 6.37%
- Cash-on-cash
- 0.29%
- DSCR
- 1.01
- GRM
- 9.8
CMA / ARV
- ARV (on-the-fly)
- $174,682
- Comps found
- 12
Show comp detail 12 sales within ~0.75 mi
| Address | Dist | Beds/Ba | Sqft | Sold | Price | $/sf | Match |
|---|---|---|---|---|---|---|---|
| 4618 N Rutland Ave | 0.14mi | 3/1.5 | 988 (-6%) | 1mo | $165,000 | $167 | 84 |
| 1215 W Woodlawn Ave | 0.20mi | 3/1.0 | 1,119 (+7%) | 5mo | $175,000 | $156 | 73 |
| 1317 Oakwood Ave | 0.52mi | 3/1.0 | 1,018 (-3%) | 4mo | $137,500 | $135 | 66 |
| 618 W Southern Heights Ave | 0.54mi | 2/1.0 (-1) | 1,036 (-1%) | 5mo | $152,500 | $147 | 62 |
| 4823 S 4th St | 0.62mi | 2/1.0 (-1) | 1,013 (-3%) | 2mo | $225,000 | $222 | 57 |
| 3670 Woodruff Ave | 0.71mi | 3/1.0 | 1,102 (+5%) | 4mo | $159,500 | $145 | 53 |
| 3723 Warren Ave | 0.50mi | 2/1.0 (-1) | 930 (-11%) | 0mo | $90,000 | $97 | 51 |
| 3801 Craig Ave | 0.74mi | 3/2.0 | 958 (-8%) | 1mo | $198,900 | $208 | 48 |
| 527 Forum Ave | 0.69mi | 3/1.0 | 1,176 (+12%) | 1mo | $215,000 | $183 | 44 |
| 210 W Woodlawn Ave | 0.70mi | 2/2.0 (-1) | 1,170 (+12%) | 3mo | $227,250 | $194 | 38 |
| 3668 Woodruff Ave | 0.72mi | 3/3.0 | 1,158 (+11%) | 6mo | $212,500 | $184 | 38 |
| 1409 Arling Ave | 0.74mi | 3/2.0 | 1,200 (+15%) | 4mo | $136,250 | $114 | 36 |
Match score weights: distance 35% · size 25% · config 20% · recency 20%. Top-matched comps best support the ARV.
Projected returns pro-forma
-3.0% appreciation · 5.16% rent growth · sell at horizon
- IRR
- -13.5%
- Equity multiple
- 0.50×
- Total profit
- $-20,823
- Equity at exit
- $22,365
- IRR
- -1.6%
- Equity multiple
- 0.88×
- Total profit
- $-5,131
- Equity at exit
- $12,969
Cash invested: $42,000 (down + closing). Projections, not guarantees.
Landlord ↔ Tenant lean methodology
- Overall (STATE)
- 83 Strongly Landlord-Friendly
- State Kentucky
- 83 Strongly Landlord-Friendly · R+16
- County
- — inherits STATE
- City
- — inherits STATE
ZIP-level market 40215
- Home prices YoY
- -34.4%
- Rents YoY
- 5.2%
- Active inventory
- 121
- Price-to-rent
- 9.8×
Monthly cashflow live
- Estimated rent
- $1,279 high interval (Pro) →
- Mortgage (P&I)
- −$787
- Tax from tax record
- −$151 /mo · $1,817/yr
- Insurance
- −$62
- HOA
- −$0
- Vacancy / Maint / Mgmt
- −$269
- Net cashflow
- $10
Break-even live
UW: 25.0% down · 7.5% · 30yr · 1.5% tax · 5.0% vac · 8.0% maint · 8.0% mgmt
Financing live
Cash to close
- Down payment
- $37,500
- Closing costs
- $4,500
- Reserves months
- —
- Total cash needed
- —
Loan-product check · same deal, 3 products live
Conventional
25% down · 7.5% · 30yr
- Down + closing
- —
- Monthly P&I
- —
- Monthly cashflow
- —
- DSCR
- —
- Eligible?
- —
Personal DTI + credit; lowest rate.
DSCR
20% down · 8.5% · 30yr
- Down + closing
- —
- Monthly P&I
- —
- Monthly cashflow
- —
- DSCR
- —
- Eligible?
- —
No personal income docs; deal must DSCR.
Hard money
10% down · 12.0% · 12mo
- Down + closing
- —
- Monthly P&I
- —
- Monthly cashflow
- —
- DSCR
- —
- Eligible?
- —
Short-term bridge; refi at stabilization.
Rent comps 40 comps
| Address | Beds | Baths | Sqft | Rent | $/sqft | DOM | Units | Dist |
|---|---|---|---|---|---|---|---|---|
| 4046 Taylor Blvd Unit 2 Louisville, KY | 2.0 | 1.0 | 800 | $900 | $1.12 | 24d | 1 | 0.34mi |
| 1022 Stanley Ave Louisville, KY | 2.0 | 1.0 | 700 | $1,200 | $1.71 | 21d | 1 | 0.40mi |
| 4725 Southern Pkwy Unit 1 Louisville, KY | 2.0 | 1.0 | 1296 | $925 | $0.71 | 3d | 1 | 0.48mi |
| 4626 Southern Pkwy Louisville, KY | 1.0–2.0 | 1.0 | 809 | $895 | $1.11 | 15d | 3 | 0.51mi |
| 1105 Beecher St Louisville, KY | 2.0 | 1.0 | 708 | $1,150 | $1.62 | 16d | 1 | 0.62mi |
| 4608 S 3rd St Unit 1st Floor Louisville, KY | 2.0 | 1.5 | 1100 | $1,500 | $1.36 | 24d | 1 | 0.64mi |
| 3746 Kahlert Ave Louisville, KY | 3.0 | 1.0 | 955 | $1,350 | $1.41 | 16d | 1 | 0.67mi |
| 4122 Craig Ave Louisville, KY | 2.0 | 1.0 | 705 | $1,051 | $1.49 | 12d | 1 | 0.67mi |
| 4113 La Salle Ave Louisville, KY | 2.0 | 1.0 | 875 | $1,249 | $1.43 | 16d | 1 | 0.71mi |
| 1118 W Whitney Ave Louisville, KY | 2.0 | 1.0 | 771 | $1,199 | $1.56 | 24d | 1 | 0.71mi |
| 1517 Shingo Ave Louisville, KY | 3.0 | 2.0 | 1100 | $1,349 | $1.23 | 24d | 1 | 0.75mi |
| 910 W Whitney Ave Louisville, KY | 3.0 | 1.0 | 1186 | $1,450 | $1.22 | 2d | 1 | 0.75mi |
| 910 W Whitney Ave Louisville, KY | 3.0 | 1.0 | 1186 | $1,450 | $1.22 | 12d | 1 | 0.75mi |
| 3717 Wheeler Ave Louisville, KY | 3.0 | 2.0 | 1124 | $1,450 | $1.29 | 24d | 1 | 0.77mi |
| 1507 Arling Ave Louisville, KY | 3.0 | 2.0 | 1148 | $1,275 | $1.11 | 16d | 1 | 0.79mi |
| 4000 Churchman Ave Louisville, KY | 3.0 | 1.0 | 1000 | $1,200 | $1.20 | 16d | 1 | 0.80mi |
| 3655 Kahlert Ave Louisville, KY | 2.0 | 1.0 | 915 | $1,300 | $1.42 | 12d | 1 | 0.81mi |
| 4133 S 5th St Louisville, KY | 4.0 | 1.0 | 1200 | $1,435 | $1.20 | 16d | 1 | 0.83mi |
| 104 Kenwood Ct Louisville, KY | 2.0 | 1.0 | 875 | $985 | $1.13 | 24d | 1 | 0.87mi |
| 118 E Ashland Ave Louisville, KY | 2.0 | 1.5 | 910 | $1,200 | $1.32 | 24d | 1 | 0.89mi |
| 551 Denmark St Louisville, KY | 3.0 | 1.5 | 1160 | $1,700 | $1.47 | 24d | 1 | 0.97mi |
| 5011 Southside Dr Louisville, KY | 1.0–2.0 | 1.0 | 800 | $1,067 | $1.33 | 24d | 1 | 0.98mi |
| 5011 Southside Dr Louisville, KY | 1.0–2.0 | 1.0 | 800 | $975 | $1.22 | 2d | 9 | 0.98mi |
| 418 Marshall Walk Louisville, KY | 2.0 | 1.0 | 850 | $1,095 | $1.29 | 24d | 1 | 0.99mi |
| 3627 Parthenia Ave Louisville, KY | 3.0 | 1.0 | 900 | $1,245 | $1.38 | 24d | 1 | 1.05mi |
| 3700 Georgetown Pl Louisville, KY | 2.0 | 1.0 | 800 | $901 | $1.13 | 24d | 1 | 1.05mi |
| 3700 Georgetown Pl Unit 2302-201 Louisville, KY | 2.0 | 1.0 | 800 | $901 | $1.13 | 12d | 1 | 1.05mi |
| 119 E Southern Heights Ave Louisville, KY | 3.0 | 1.0 | 1000 | $1,250 | $1.25 | 24d | 1 | 1.06mi |
| 623 Dresden Ave Louisville, KY | 2.0 | 1.0 | 750 | $975 | $1.30 | 16d | 1 | 1.08mi |
| 615 Dresden Ave Louisville, KY | 3.0 | 1.0 | 884 | $1,450 | $1.64 | 24d | 1 | 1.09mi |
| 327 Inverness Ave Louisville, KY | 2.0 | 1.0 | 820 | $1,150 | $1.40 | 16d | 1 | 1.11mi |
| 4007 Southern Pkwy Unit 1 Louisville, KY | 4.0 | 1.0 | 1500 | $1,395 | $0.93 | 3d | 1 | 1.11mi |
| 4406 S Brook St Apt 27 Louisville, KY | 2.0 | 2.0 | 1080 | $1,295 | $1.20 | 12d | 1 | 1.12mi |
| 114 E Florence Ave Apt 21 Louisville, KY | 2.0 | 1.0 | 936 | $1,275 | $1.36 | 24d | 1 | 1.13mi |
| 114 E Florence Ave Unit 19 Louisville, KY | 2.0 | 2.0 | 1080 | $1,295 | $1.20 | 16d | 1 | 1.13mi |
| 1411 Sale Ave Louisville, KY | 2.0 | 1.0 | 936 | $1,000 | $1.07 | 16d | 1 | 1.14mi |
| 5013 Wabash Pl Louisville, KY | 3.0 | 2.0 | 1080 | $1,400 | $1.30 | 24d | 1 | 1.17mi |
| 3523 Georgetown Pl #3 Louisville, KY | 2.0 | 1.0 | 850 | $850 | $1.00 | 17d | 1 | 1.17mi |
| 3909 Southern Pkwy Unit 2 Louisville, KY | 3.0 | 1.0 | 1000 | $1,100 | $1.10 | 3d | 1 | 1.19mi |
| 3449 Powell Ave Louisville, KY | 2.0 | 1.0 | 800 | $1,000 | $1.25 | 24d | 1 | 1.19mi |
Listing history 9 events
-
2026-05-18status Pending
-
2026-05-04$150,000 Active
-
2021-07-20soldstatus $120,000
-
2021-07-19soldstatus $120,000 Closed 568-char remark
Show marketing remark (568 chars)
With plenty of potential to make it truly your own, this home features 3 bedrooms and 1.5 baths. Fantastic location in a quiet cul-de-sac while also enjoying the convenience of close proximity to Watterson Express and Iroquois Park. The inviting living room opens into the kitchen for the perfect hospitality space for friends and family. Take advantage of the warmer weather and enjoy the spacious deck and fenced-in backyard. Large 2-car garage is perfect for your storage needs and parking. All appliances, washer/dryer, and window units will remain with the home.
-
2021-06-27status Pending 568-char remark
Show marketing remark (568 chars)
With plenty of potential to make it truly your own, this home features 3 bedrooms and 1.5 baths. Fantastic location in a quiet cul-de-sac while also enjoying the convenience of close proximity to Watterson Express and Iroquois Park. The inviting living room opens into the kitchen for the perfect hospitality space for friends and family. Take advantage of the warmer weather and enjoy the spacious deck and fenced-in backyard. Large 2-car garage is perfect for your storage needs and parking. All appliances, washer/dryer, and window units will remain with the home.
-
2021-06-05historical Active Under Contract 568-char remark
Show marketing remark (568 chars)
With plenty of potential to make it truly your own, this home features 3 bedrooms and 1.5 baths. Fantastic location in a quiet cul-de-sac while also enjoying the convenience of close proximity to Watterson Express and Iroquois Park. The inviting living room opens into the kitchen for the perfect hospitality space for friends and family. Take advantage of the warmer weather and enjoy the spacious deck and fenced-in backyard. Large 2-car garage is perfect for your storage needs and parking. All appliances, washer/dryer, and window units will remain with the home.
-
2021-06-04status Active 568-char remark
Show marketing remark (568 chars)
With plenty of potential to make it truly your own, this home features 3 bedrooms and 1.5 baths. Fantastic location in a quiet cul-de-sac while also enjoying the convenience of close proximity to Watterson Express and Iroquois Park. The inviting living room opens into the kitchen for the perfect hospitality space for friends and family. Take advantage of the warmer weather and enjoy the spacious deck and fenced-in backyard. Large 2-car garage is perfect for your storage needs and parking. All appliances, washer/dryer, and window units will remain with the home.
-
2021-05-30historical Active Under Contract 568-char remark
Show marketing remark (568 chars)
With plenty of potential to make it truly your own, this home features 3 bedrooms and 1.5 baths. Fantastic location in a quiet cul-de-sac while also enjoying the convenience of close proximity to Watterson Express and Iroquois Park. The inviting living room opens into the kitchen for the perfect hospitality space for friends and family. Take advantage of the warmer weather and enjoy the spacious deck and fenced-in backyard. Large 2-car garage is perfect for your storage needs and parking. All appliances, washer/dryer, and window units will remain with the home.
-
2021-05-27$120,000 Active 568-char remark
Show marketing remark (568 chars)
With plenty of potential to make it truly your own, this home features 3 bedrooms and 1.5 baths. Fantastic location in a quiet cul-de-sac while also enjoying the convenience of close proximity to Watterson Express and Iroquois Park. The inviting living room opens into the kitchen for the perfect hospitality space for friends and family. Take advantage of the warmer weather and enjoy the spacious deck and fenced-in backyard. Large 2-car garage is perfect for your storage needs and parking. All appliances, washer/dryer, and window units will remain with the home.
ⓘ Source: listings_history table (triggers on properties + properties_extension) + one-shot
backfill from property_details.listing_events for pre-trigger history.
Tax reassessment forecast KY · Resets to sale price
- Current annual tax
- $1,817 · $151/mo
- Projected year-2 tax
- $1,817 · $151/mo
- Expected delta
- $0/yr ($0/mo · 0.0%)
ⓘ Screening estimate from a state-policy table — verify with the county assessor before closing.
Climate risk First Street
- Flood 4/10 Moderate FEMA zone X (unshaded) · 22% chance over 30 yrs
- Wildfire 1/10 Low
- Heat 5/10 Major 6 d/yr ≥105°F today · 18 d/yr by 30 yrs out
- Wind 2/10 Low 100% chance of damaging wind over 30 yrs
- Air quality 2/10 Low 1 unhealthy d/yr today · 3 by 30 yrs out
Nearby sold comps map
Loading sold comps map…
Walkable amenities ~0.75 mi
Loading nearby amenities…
Taxation est. · year 1
- Rental income
- $15,352
- − Mortgage interest
- −$8,402
- − Property taxes
- −$1,817
- − Insurance
- −$750
- − Repairs & maintenance
- −$1,228
- − Management
- −$1,228
- − Depreciation
- −$4,364
- Taxable loss
- −$2,437
- Est. tax savings @ 24.0%
- +$585
- After-tax cash flow
- $707/yr
For passive investors: Depreciation is non-cash, so a rental often shows a tax loss while cash-flowing — sheltering income. Rental losses are passive: they offset passive income freely, and up to $25,000/yr can offset ordinary (W-2) income if you actively participate and your MAGI is under $100k (phasing out to $0 by $150k); unused losses carry forward. On sale, claimed depreciation is recaptured at up to 25%, and gains may owe capital-gains tax (a 1031 exchange can defer both). Figures are a year-1 estimate at your 24.0% rate — not tax advice; consult a CPA.
Schools (NCES district)
- District
- Jefferson County
- NCES district ID
- 2102990
- Math proficiency
- 19% ▼ -17.00%
- Reading proficiency
- 35% ▼ -11.00%
- Median HH income
- $47,885
- Composite
- 23.45/100
- National rank
- #7884
- State rank
- #121 of 165 in KY
Livability — Louisville
- Score
- 63/100
- State rank
- #333
- US rank
- #15887
Category grades
Schools grade is shown separately in the Schools card above.
Census & demographics
- Census place
- Louisville, KY
- County
- Jefferson County · 790,184 people
- City population
- 769,292
- Metro
- Louisville/Jefferson County, KY-IN
- Population (ZIP)
- 20,532
- Household income
- $43,725
- Rent vs Own
- Severe rent burden
- 997.0
Population outlook (Jefferson County) Hauer SSP2
- Today (2025)
- 823,112 people
- By 2030
- 849,343 · +3.2%
- By 2040
- 895,696 · +8.8%
- By 2050
- 933,630 · +13.4%
- By 2075
- 1,028,262 · +24.9%
- By 2100
- 1,072,675 · +30.3%
Race, ethnicity, and origin ACS 2023
- Neighborhood character
- Diverse neighborhood (Simpson 0.63)
- Race & ethnicity
- White 51% Black 33% Two or more races 11% Hispanic / Latino 6% Asian 2%
- Hispanic origin (detail)
- Mexican 2% Cuban 3%
- Common ancestry
- Slovak 1% Romanian 1% Serbian 1%
- Foreign-born
- 9% · Canada, Vietnam
- Languages at home
- 88% English-only · Spanish 5% Other Indo-European 2% Arabic 1%
Political lean MEDSL · Jefferson
- 2024 margin
- D (+16.6) · D 57.4% · R 40.9% · Other 1.7%
- 2008→2024 swing
- +4.5pp toward D · 2008: 12.0pp · 2024: 16.6pp
- All cycles
- 2024: D+16.6 2020: D+20.1 2016: D+13.3 2012: D+11.1 2008: D+12.0
Not yet ingested
- Civics
- —
Market trends
- HPI YoY
- ▼ -119.35%
- Current HPI
- 227.8248
- Rent YoY
- ▲ 5.16%
- Metro
- Louisville/Jefferson County, KY-IN
- State GDP YoY
- ▲ 1.81%
- F500 in state
- 4
Industry mix (Fortune 500 HQ in KY)
| Industry | F500 HQs | Revenue |
|---|---|---|
| Healthcare | 1 | $118B |
|
||
| Food / Beverage | 1 | $7B |
|
||
Price history
+25.0% since first listed9 events — show timeline
- 2026-05-18 Pending — Metro Search MLS
- 2026-05-04 Listed $150,000 Metro Search MLS
- 2021-07-20 Sold (Public Records) $120,000 Public Records
- 2021-07-19 Sold (MLS) $120,000 Metro Search MLS
- 2021-06-27 Pending — Metro Search MLS
- 2021-06-05 Contingent — Metro Search MLS
- 2021-06-04 Relisted — Metro Search MLS
- 2021-05-30 Contingent — Metro Search MLS
- 2021-05-27 Listed $120,000 Metro Search MLS
Property tax history
+10.9%/yrLatest (2025): $1,817 · +17.9% YoY. Source: county tax records.
Cash-flow waterfall
monthlySold comps — $/sqft
last 12 mo · ≤1 miLoading sold comps…