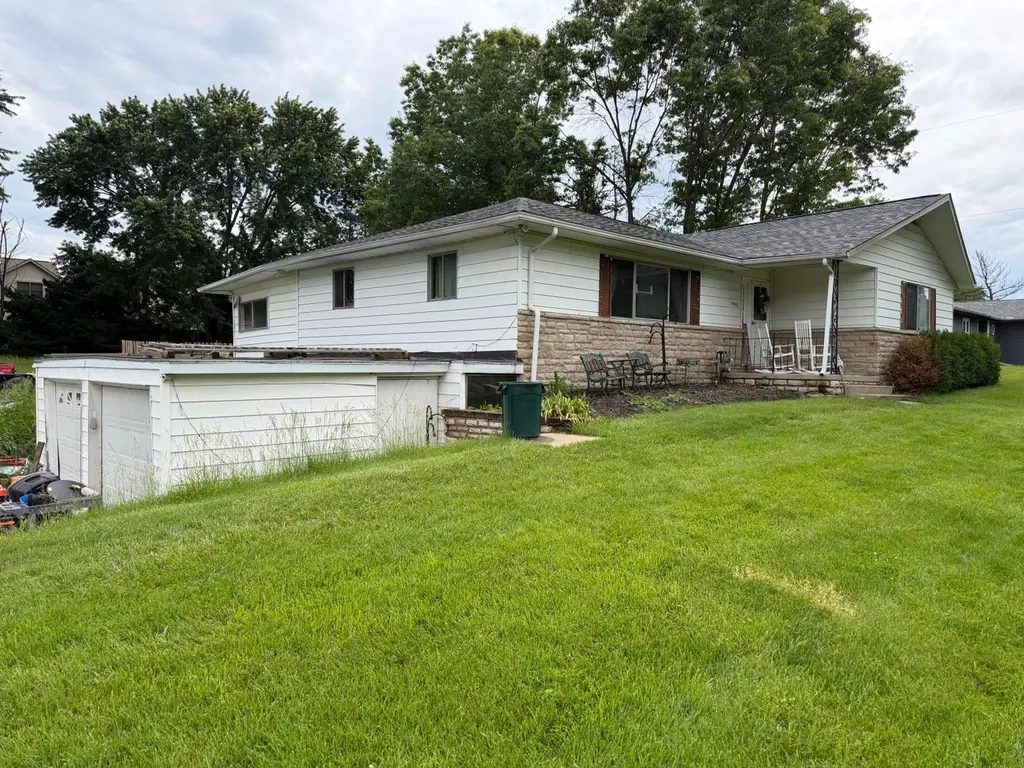
7956 Big Walnut Rd · Westerville, OH
Flood risk 1/10 · Minimal
- FEMA flood zone
- X (unshaded)
- Chance of flooding over 30 yrs
- 0.0%
- Est. flood insurance / yr
- $473 – $860
Fire risk 1/10 · Minimal
- Est. fire insurance / yr
- $713 – $1,323
Heat risk 3/10 · Minor
- Hot days now (above 101°F)
- 7 days/yr
- Hot days in 30 yrs
- 18 days/yr
Wind risk 2/10 · Minimal
- Chance of severe wind over 30 yrs
- 0.0%
Air-quality risk 3/10 · Minor
- Unhealthy air days now
- 3 days/yr
- Unhealthy air days in 30 yrs
- 4 days/yr
Risk factors via First Street. Map © Google.
Why this score? — see what drove the D+ grade
The composite is a weighted blend of 9 inputs, each scored 0–100. Each bar is that input's sub-score; the figure is the points it added to the 100-point composite (weight × sub-score).
- Cash flow +15.0/30.0
- ARV discount +7.5/15.0
- Schools +6.3/10.0
- 1% rule +5.0/10.0
- DSCR +5.0/10.0
- Livability +4.1/5.0
- Rent growth +2.9/5.0
- Condition / age +2.5/5.0
- Appreciation +0.0/10.0
$1
🖨 Deal sheet 📄 Offer letter ✓ Due diligence
Listing remarks
Don't miss this opportunity to purchase a hillside ranch home ideally located between Westerville and Sunbury, just minutes from Hoover Reservoir and situated in the desirable Big Walnut School District. This home offers approximately 1,520 square feet on the main level plus an additional 1,468 square feet in the full walk-out lower level, providing ample room for renovation, investment, or personal customization. Property Features: 3 Bedrooms, 2 Bathrooms, Kitchen and Living Room, Enclosed Rear Porch, Stone Fireplace on Main Level, Brick Fireplace in Lower Level, Full Basement, Attached 2-Car Garage, Additional Attached Garage, Platted 1± Acre Lot, Private Well and On-Site Septic Sy
Key facts
- Hillside ranch home
- Full basement
- Enclosed rear porch
Tags
Property features AI
Finance
- Other: Property listed for auction
Exterior
- Parking: Attached garage with garage door opener; 2 garage spaces
- Utilities: Well water; Private sewer
- Home design: Single-family residence; One level; Built in 1970; No common walls
- Construction: Built 1970; Block foundation
- Exterior features: Block foundation; 1.03-acre lot
Interior
- Bedrooms: 3 main-level bedrooms
- Flooring: Wood flooring; Carpet; Vinyl
- Bathrooms: 2 bathrooms
- Heating & cooling: Central air conditioning; Baseboard heating; Forced air heating
- Interior features: Insulated partial windows; Basement
Neighborhood map
What this means for you Summary
Snapshot
- This is a 3-bed/2.0-bath single-family listed at $1.
Deal economics
- At list price, monthly cash flow is $2k ($22k/yr) — positive.
- The deal already cash-flows at list — no discount required.
- Meets the 1% rule at list price ($2k rent vs $1).
- Cap rate 2165097.3% vs local median 2.4% in Westerville — top-decile yield for the area; either an underpriced asset or a hidden risk that comps aren't pricing in. Stress-test before assuming the spread holds.
Location & tenants
- Location reads 82/100 on livability (#82 in OH, #1,215 nationally) — a professional / high-income tenant draw. Strengths: schools A+, employment A+, housing A+; Watch: amenities F, commute F.
- Big Walnut Local (rural): math 68% / reading 75% proficiency, ranked #103 of 656 in OH (top 16%) — strong family-tenant draw, lease renewals of 3-5y typical; only 15% free/reduced lunch — higher-income household profile.
- Market conditions: Rents rising (+1.7%/yr); 125 active listings in the ZIP; high-income renter base; 2,233 units permitted in Delaware County in 2024 (304 in 5+ unit buildings).
Forward outlook
- Local home prices are declining (-3.0%/yr); year-one equity from $0 of loan paydown is wiped out by about $0 of value loss. Plan a longer hold.
- Delaware County population projected at +37% by 2050 — long-run rental-demand tailwind backs the buy-and-hold thesis.
- At projected returns (-3.0% appreciation + 1.7% rent growth), your $0 cash investment doubles in ~1 year — after that, you're playing with house money.
Negotiation context
- Only 10 days on market — expect competitive offers; lowballing is unlikely to land.
Questions for the listing agent
- Built in 1970 — when were the roof, HVAC, electrical panel, plumbing, and water heater last replaced?
- Is there a deadline driving the sale (1031 exchange, divorce, estate, relocation)? That informs how much negotiation room exists.
- Schools are A-rated — typically a magnet for longer-tenancy family renters. What's the average tenant stay here, and is there a school-zone premium baked into asking?
- The area grade is low — what's the realistic commute time and amenity access for the typical tenant pool here? Any planned neighborhood developments (good or bad) we should know about?
- What's the average days-on-market for RENTAL listings here right now (not sales)? A rising rental-DOM trend means longer vacancies and softer asking-rent achievability than the comps imply.
- What's the recent tenant-quality profile in this submarket — average credit score on applications, eviction rate, late-payment / NSF rate, and stable-employment percentage? A property-management company in the area should have these aggregated.
- How much new for-sale + rental construction is in the pipeline within 1–3 miles? Heavy new supply typically softens prices + rents 12–24 months out; constrained supply supports both.
Investment metrics
- 1% rule
- 228386.00% ✓
- Cap rate
- 2165097.28%
- Cash-on-cash
- 7732467.81%
- DSCR
- 344052.31
- GRM
- 0.0
CMA / ARV
- ARV (on-the-fly)
- $396,720
- Comps found
- 9
Show comp detail 9 sales within ~0.75 mi
| Address | Dist | Beds/Ba | Sqft | Sold | Price | $/sf | Match |
|---|---|---|---|---|---|---|---|
| 7421 Big Walnut Rd | 0.49mi | 4/1.5 (+1) | 1,534 (+1%) | 12mo | $399,700 | $261 | 59 |
| 5615 Covington Meadows Dr | 0.66mi | 3/2.5 | 1,480 (-3%) | 18mo | $375,000 | $253 | 48 |
| 5406 Genoa Farms Blvd | 0.75mi | 3/2.5 | 1,582 (+4%) | 16mo | $419,000 | $265 | 43 |
| 4800 S Old 3c Hwy | 0.40mi | 2/1.0 (-1) | 1,654 (+9%) | 18mo | $590,000 | $357 | 43 |
| 7386 Burson Springs Ct | 0.62mi | 3/2.0 | 1,308 (-14%) | 10mo | $375,000 | $287 | 40 |
| 7168 Laver Ln | 0.69mi | 3/2.5 | 1,598 (+5%) | 22mo | $422,000 | $264 | 39 |
| 7195 Laver Ln | 0.65mi | 3/2.5 | 1,740 (+14%) | 15mo | $424,500 | $244 | 31 |
| 7130 Big Walnut Rd | 0.75mi | 2/1.5 (-1) | 1,415 (-7%) | 19mo | $350,000 | $247 | 31 |
| 7438 Burson Springs Ct | 0.61mi | 4/2.5 (+1) | 1,702 (+12%) | 23mo | $420,000 | $247 | 25 |
Match score weights: distance 35% · size 25% · config 20% · recency 20%. Top-matched comps best support the ARV.
Projected returns pro-forma
-3.0% appreciation · 1.68% rent growth · sell at horizon
- IRR
- —
- Equity multiple
- 399834.40×
- Total profit
- $111,953
- Equity at exit
- $0
- IRR
- —
- Equity multiple
- 834402.00×
- Total profit
- $233,632
- Equity at exit
- $0
Cash invested: $0 (down + closing). Projections, not guarantees.
Landlord ↔ Tenant lean methodology
- Overall (STATE)
- 73 Landlord-Friendly
- State Ohio
- 73 Landlord-Friendly · R+6
- County
- — inherits STATE
- City
- — inherits STATE
ZIP-level market 43082
- Home prices YoY
- -32.8%
- Rents YoY
- 1.7%
- Active inventory
- 125
Monthly cashflow live
- Estimated rent
- $2,284 medium interval (Pro) →
- Mortgage (P&I)
- −$0
- Tax est. 1.5%
- −$0 /mo · $0/yr
- Insurance
- −$0
- HOA
- −$0
- Vacancy / Maint / Mgmt
- −$480
- Net cashflow
- $1,804
Break-even live
UW: 25.0% down · 7.5% · 30yr · 1.5% tax · 5.0% vac · 8.0% maint · 8.0% mgmt
Financing live
Cash to close
- Down payment
- $0
- Closing costs
- $0
- Reserves months
- —
- Total cash needed
- —
Loan-product check · same deal, 3 products live
Conventional
25% down · 7.5% · 30yr
- Down + closing
- —
- Monthly P&I
- —
- Monthly cashflow
- —
- DSCR
- —
- Eligible?
- —
Personal DTI + credit; lowest rate.
DSCR
20% down · 8.5% · 30yr
- Down + closing
- —
- Monthly P&I
- —
- Monthly cashflow
- —
- DSCR
- —
- Eligible?
- —
No personal income docs; deal must DSCR.
Hard money
10% down · 12.0% · 12mo
- Down + closing
- —
- Monthly P&I
- —
- Monthly cashflow
- —
- DSCR
- —
- Eligible?
- —
Short-term bridge; refi at stabilization.
Listing history 8 events
-
2026-06-18days on market $1 Active 10 DOM
-
2026-06-17days on market $1 Active 9 DOM
-
2026-06-16days on market $1 Active 8 DOM
-
2026-06-15days on market $1 Active 7 DOM
-
2026-06-13days on market $1 Active 5 DOM
-
2026-06-13days on market $1 Active 4 DOM
-
2026-06-08remarks 692-char remark
-
2026-06-08$1 Active 1 DOM
ⓘ Source: listings_history table (triggers on properties + properties_extension) + one-shot
backfill from property_details.listing_events for pre-trigger history.
Climate risk First Street
- Flood 1/10 Low FEMA zone X (unshaded) · 0% chance over 30 yrs
- Wildfire 1/10 Low
- Heat 3/10 Moderate 7 d/yr ≥101°F today · 18 d/yr by 30 yrs out
- Wind 2/10 Low 0% chance of damaging wind over 30 yrs
- Air quality 3/10 Moderate 3 unhealthy d/yr today · 4 by 30 yrs out
Nearby sold comps map
Loading sold comps map…
Walkable amenities ~0.75 mi
Loading nearby amenities…
Taxation est. · year 1
- Rental income
- $27,406
- − Mortgage interest
- −$0
- − Property taxes
- −$0
- − Insurance
- −$0
- − Repairs & maintenance
- −$2,193
- − Management
- −$2,193
- − Depreciation
- −$0
- Taxable income
- $23,021
- Est. tax owed @ 24.0%
- −$5,525
- After-tax cash flow
- $16,126/yr
For passive investors: Depreciation is non-cash, so a rental often shows a tax loss while cash-flowing — sheltering income. Rental losses are passive: they offset passive income freely, and up to $25,000/yr can offset ordinary (W-2) income if you actively participate and your MAGI is under $100k (phasing out to $0 by $150k); unused losses carry forward. On sale, claimed depreciation is recaptured at up to 25%, and gains may owe capital-gains tax (a 1031 exchange can defer both). Figures are a year-1 estimate at your 24.0% rate — not tax advice; consult a CPA.
Schools (NCES district)
- District
- Big Walnut Local
- NCES district ID
- 3904674
- Math proficiency
- 68% ▼ -9.00%
- Reading proficiency
- 75% ▼ -6.00%
- Median HH income
- $79,890
- Composite
- 63.45/100
- National rank
- #617
- State rank
- #103 of 656 in OH
Livability — Westerville
- Score
- 82/100
- State rank
- #82
- US rank
- #1215
Category grades
Schools grade is shown separately in the Schools card above.
Census & demographics
- County
- Delaware County · 203,207 people
- City population
- 99,583
- Metro
- Columbus, OH
- Population (ZIP)
- 34,563
- Household income
- $147,972
- Rent vs Own
- Severe rent burden
- 520.0
Population outlook (Delaware County) Hauer SSP2
- Today (2025)
- 230,854 people
- By 2030
- 249,294 · +8.0%
- By 2040
- 284,223 · +23.1%
- By 2050
- 315,314 · +36.6%
- By 2075
- 379,462 · +64.4%
- By 2100
- 403,158 · +74.6%
Race, ethnicity, and origin ACS 2023
- Neighborhood character
- Predominantly White (85%)
- Race & ethnicity
- White 85% Two or more races 5% Black 5% Asian 4% Hispanic / Latino 3%
- Common ancestry
- Lithuanian 4% Romanian 2% Slovak 2%
- Foreign-born
- 5% · Canada, Vietnam, China
- Languages at home
- 93% English-only · Spanish 2% Other Indo-European 1% Other Asian/Pacific 1%
Political lean MEDSL · Delaware
- 2024 margin
- Lean R (+6.6) · D 46.2% · R 52.8%
- 2008→2024 swing
- +13.0pp toward D · 2008: -19.6pp · 2024: -6.6pp
- All cycles
- 2024: R+6.6 2020: R+6.8 2016: R+16.1 2012: R+23.7 2008: R+19.6
Not yet ingested
- Civics
- —
Market trends
- HPI YoY
- ▼ -102.55%
- Current HPI
- 210.4816
- Rent YoY
- ▲ 1.68%
- Metro
- Columbus, OH
- State GDP YoY
- ▲ 1.98%
- F500 in state
- 48
Industry mix (Fortune 500 HQ in OH)
| Industry | F500 HQs | Revenue |
|---|---|---|
| Insurance | 3 | $145B |
|
||
| Industrial Machinery | 3 | $49B |
|
||
| Financial Services | 3 | $24B |
|
||
| Consumer Goods | 2 | $93B |
|
||
| Aerospace / Defense | 2 | $47B |
|
||
| Utilities | 2 | $33B |
|
||
Price history
2 events — show timeline
- 2026-06-08 Listed $1 CBRMLS
- 2000-06-16 Sold (Public Records) $140,000 Public Records
Property tax history
+3.1%/yrLatest (2025): $3,795 · +7.2% YoY. Source: county tax records.
Cash-flow waterfall
monthlySold comps — $/sqft
last 12 mo · ≤1 miLoading sold comps…