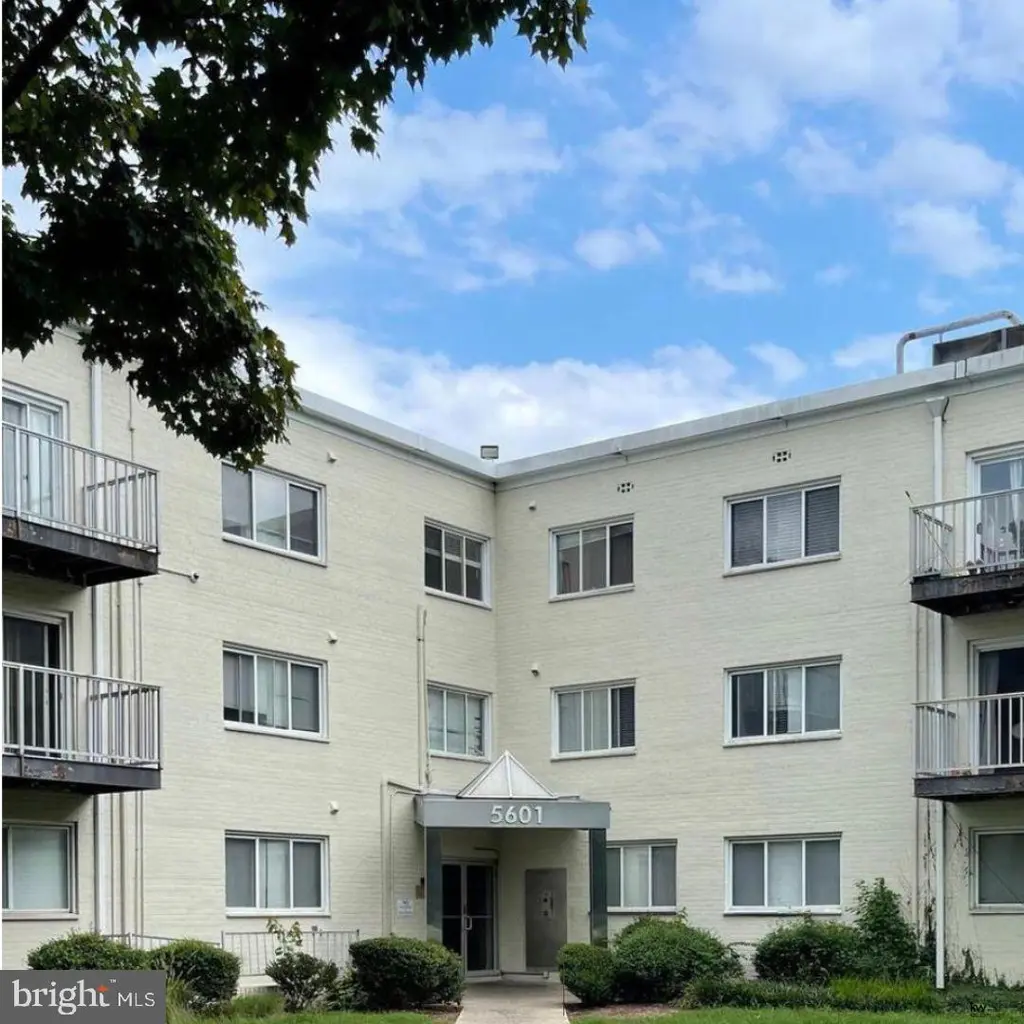
5601 Parker House Ter #217 · Chillum, MD
Flood risk 1/10 · Minimal
- FEMA flood zone
- X (unshaded)
- Chance of flooding over 30 yrs
- 0.0%
- Est. flood insurance / yr
- $507 – $1,088
Fire risk 1/10 · Minimal
- Est. fire insurance / yr
- $755 – $1,403
Heat risk 7/10 · Major
- Hot days now (above 104°F)
- 7 days/yr
- Hot days in 30 yrs
- 15 days/yr
Wind risk 4/10 · Minor
- Chance of severe wind over 30 yrs
- 15.0%
Air-quality risk 4/10 · Minor
- Unhealthy air days now
- 5 days/yr
- Unhealthy air days in 30 yrs
- 6 days/yr
Risk factors via First Street. Map © Google.
Why this score? — see what drove the D grade
The composite is a weighted blend of 9 inputs, each scored 0–100. Each bar is that input's sub-score; the figure is the points it added to the 100-point composite (weight × sub-score).
- Cash flow +11.6/30.0
- 1% rule +10.0/10.0
- ARV discount +7.5/15.0
- Livability +3.8/5.0
- DSCR +3.4/10.0
- Condition / age +2.5/5.0
- Rent growth +2.3/5.0
- Schools +1.7/10.0
- Appreciation +0.0/10.0
$80,000
🖨 Deal sheet (PDF) 📄 Offer letter ✓ Due diligence
Listing remarks MLS
Short Sale: Professionally negotiated. Well kept condo located in the Fairmont condominium. Close to the DC line, Home Depot, short drive to metro with tons of shopping in the area. Nice size room and also good a size living room. Perfect starter home. NOT FHA approved. Call for more info. Will not last.
Key facts
- $709 HOA
- Parking
- Community pool
Property features AI
Finance
- HOA & community: Monthly condo fee of $709; HOA covers A/C unit(s), common area maintenance, exterior building maintenance, laundry, management, parking fee, pool(s), snow removal, trash, and water; Community amenities include an elevator and outdoor pool
Exterior
- Parking: Permit parking included; Assigned parking (space #472); Parking lot; Three total parking spaces (three in lot)
- Utilities: Public water; Public sewer; Electric service
- Home design: Condominium; Garden-style building (1–4 floors); Unit/flat; Entry on level 1; Very good condition; Brick construction
- Construction: Brick construction
- Exterior features: Community outdoor pool; Above-grade and below-grade structures
Interior
- Bedrooms: One bedroom on the main level
- Flooring: Hardwood flooring
- Bathrooms: One full bathroom on the main level
- Heating & cooling: Central heating (electric); Central air conditioning (electric); Electric hot water
- Interior features: Open floor plan; Upgraded countertops; Wood floors
- Laundry & utility: Washer in unit; Washer/dryer hookup in unit
Neighborhood map
What this means for you Summary
Snapshot
- This is a 1-bed/1.0-bath condo listed at $80k.
Deal economics
- At list price, monthly cash flow is $-25 ($-294/yr) — negative.
- To cash-flow at today's rent, offer at most $76k (5.4% below list).
- Meets the 1% rule at list price ($2k rent vs $80k).
- Recommended offer: $76k (5.4% below list) — sets the bar for cash-flow.
- Cap rate 5.9% vs local median 4.3% in Chillum — top-decile yield for the area; either an underpriced asset or a hidden risk that comps aren't pricing in. Stress-test before assuming the spread holds.
Location & tenants
- Location reads 75/100 on livability (#105 in MD, #4,157 nationally) — a middle-class / working-renter tenant base. Strengths: commute A+, housing A+, health & safety A; Watch: schools C-, amenities C-, crime F.
- Prince George'S County Public Schools (suburban): math 8% / reading 24% proficiency, ranked #21 of 24 in MD (top 88%) — low school quality limits family demand, transient renter base, plan for 1-2y turnover.
- Market conditions: Rents soft (-0.9%/yr); 156 active listings in the ZIP; 40 comparable units currently listed for rent nearby; rentals leasing fast (median 13d on market — plan ~1-2 weeks tenant-placement turnaround); solid renter incomes; 1,481 units permitted in Prince George's County in 2024 (0 in 5+ unit buildings).
Forward outlook
- Local home prices are declining (-3.0%/yr); year-one equity from $553 of loan paydown is wiped out by about $2k of value loss. Plan a longer hold.
- Prince George's County population projected at +18% by 2050 — long-run rental-demand tailwind backs the buy-and-hold thesis.
Negotiation context
- Only 3 days on market — expect competitive offers; lowballing is unlikely to land.
- 3 sale attempts since 20y ago; this cycle's ask is 78% above the opening price — seller raised mid-cycle; expect resistance to lowballs.
- Current owner paid $45k; list at $80k implies a 78% gain — meaningful room to come down on a strong offer.
Risks & watch-outs
- Watch-outs: HOA is 46% of rent; built in 1955 — expect roof / HVAC / electrical / plumbing capex.
- Climate carrying-cost: extreme-heat days projected 7→15/yr by 2055 (HVAC capex compounding) — expect insurance premiums to compound above CPI over the hold.
Questions for the listing agent
- What do current leases actually rent for vs. the listed asking? Can we see a recent rent roll and the last 12 months of T-12 income?
- Built in 1955 — when were the roof, HVAC, electrical panel, plumbing, and water heater last replaced?
- What does the HOA fee cover, when was the last increase, and are there any pending special assessments or reserve-fund shortfalls?
- Any open or pending special assessments — roof, HVAC, plumbing, elevator, façade? What's the per-unit balance and payoff schedule, and is the seller paying it off at close or rolling it to the buyer?
- Is there a deadline driving the sale (1031 exchange, divorce, estate, relocation)? That informs how much negotiation room exists.
- Crime grade is F in this area — have there been break-ins, vandalism, or insurance claims at this property in the last 3 years? What carrier currently insures it and at what premium?
- The area grade is low — what's the realistic commute time and amenity access for the typical tenant pool here? Any planned neighborhood developments (good or bad) we should know about?
- What's the average days-on-market for RENTAL listings here right now (not sales)? A rising rental-DOM trend means longer vacancies and softer asking-rent achievability than the comps imply.
- What's the recent tenant-quality profile in this submarket — average credit score on applications, eviction rate, late-payment / NSF rate, and stable-employment percentage? A property-management company in the area should have these aggregated.
- How much new apartment / multifamily construction is in the pipeline within 1–3 miles? Heavy new supply (>2% of stock underway) typically softens rents 12–24 months out; light construction supports rent growth.
Investment metrics
- 1% rule
- 1.94% ✓
- Cap rate
- 5.93%
- Cash-on-cash
- -1.31%
- DSCR
- 0.94
- GRM
- 4.3
CMA / ARV
No comps found within radius.
Projected returns pro-forma
-3.0% appreciation · 0.0% rent growth · sell at horizon
- IRR
- -26.1%
- Equity multiple
- 0.17×
- Total profit
- $-18,616
- Equity at exit
- $11,928
- IRR
- -79.8%
- Equity multiple
- -0.52×
- Total profit
- $-33,942
- Equity at exit
- $6,917
Cash invested: $22,400 (down + closing). Projections, not guarantees.
Landlord ↔ Tenant lean methodology
- Overall (STATE)
- 27 Tenant-Leaning
- State Maryland
- 27 Tenant-Leaning · D+14
- County
- — inherits STATE
- City
- — inherits STATE
ZIP-level market 20782
- Rents YoY
- -0.9%
- Active inventory
- 156
- Price-to-rent
- 4.3×
Monthly cashflow live
- Estimated rent
- $1,550 high interval (Pro) →
- Mortgage (P&I)
- −$420
- Tax from tax record
- −$87 /mo · $1,046/yr
- Insurance
- −$33
- HOA
- −$709
- Vacancy / Maint / Mgmt
- −$326
- Net cashflow
- $-25
Break-even live
Sensitivity live
| Price | -10% $21 | -5% $-2 | +0% $-25 | +5% $-47 | +10% $-70 |
|---|---|---|---|---|---|
| Rent | -10% $-147 | -5% $-86 | +0% $-25 | +5% $37 | +10% $98 |
| Rate | -1.0pp $16 | -0.5pp $-4 | base $-25 | +0.5pp $-45 | +1.0pp $-66 |
UW: 25.0% down · 7.5% · 30yr · 1.5% tax · 5.0% vac · 8.0% maint · 8.0% mgmt
Financing live
Cash to close
- Down payment
- $20,000
- Closing costs
- $2,400
- Reserves months
- —
- Total cash needed
- —
Loan-product check · same deal, 3 products live
Conventional
25% down · 7.5% · 30yr
- Down + closing
- —
- Monthly P&I
- —
- Monthly cashflow
- —
- DSCR
- —
- Eligible?
- —
Personal DTI + credit; lowest rate.
DSCR
20% down · 8.5% · 30yr
- Down + closing
- —
- Monthly P&I
- —
- Monthly cashflow
- —
- DSCR
- —
- Eligible?
- —
No personal income docs; deal must DSCR.
Hard money
10% down · 12.0% · 12mo
- Down + closing
- —
- Monthly P&I
- —
- Monthly cashflow
- —
- DSCR
- —
- Eligible?
- —
Short-term bridge; refi at stabilization.
Rent comps 40 comps
| Address | Beds | Baths | Sqft | Rent | $/sqft | DOM | Units | Dist |
|---|---|---|---|---|---|---|---|---|
| 5601 Parker House Ter #106 Hyattsville, MD | 1.0 | 1.0 | 703 | $1,250 | $1.78 | 6d | 1 | 0.02mi |
| 1009 Chillum Rd #217 Hyattsville, MD | 1.0 | 1.0 | 740 | $1,500 | $2.03 | 45d | 1 | 0.07mi |
| 1005 Chillum Rd Hyattsville, MD | 1.0 | 1.0 | 552 | $1,600 | $2.90 | 11d | 2 | 0.11mi |
| 846 Oglethorpe St NE Washington, DC | 1.0 | 1.0 | 500 | $1,600 | $3.20 | 16d | 1 | 0.13mi |
| 908 Chillum Rd Hyattsville, MD | 2.0 | 1.0 | 650 | $1,850 | $2.85 | 45d | 1 | 0.22mi |
| 5178 Eastern Ave NE Washington, DC | 1.0–3.0 | 1.0 | 792 | $1,499 | $1.89 | 4d | 1 | 0.35mi |
| 6060 Sargent Rd Hyattsville, MD | 1.0–2.0 | 1.0–2.0 | 700 | $1,785 | $2.55 | 45d | 1 | 0.41mi |
| 5603 Cypress Creek Dr Chillum, MD | 1.0–2.0 | 1.0–2.0 | 765 | $1,423 | $1.86 | 2d | 8 | 0.56mi |
| 721 Chillum Rd Hyattsville, MD | 1.0–2.0 | 1.0 | 650 | $1,343 | $2.07 | 12d | 1 | 0.58mi |
| 400 Galloway St NE Washington, DC | 2.0 | 1.0–2.0 | 716 | $2,218 | $3.10 | 0d | 24 | 0.58mi |
| 5661 3rd St NE Washington, DC | 2.0 | 1.0–2.0 | 764 | $2,154 | $2.82 | 0d | 29 | 0.64mi |
| 508 Greenlawn Dr Hyattsville, MD | 1.0–2.0 | 1.0 | 651 | $1,365 | $2.10 | 2d | 6 | 0.67mi |
| 1507 Ray Rd Chillum, MD | 1.0–2.0 | 1.0 | 820 | $1,515 | $1.85 | 25d | 1 | 0.68mi |
| 5210 3rd St NE Washington, DC | 2.0 | 1.0–2.0 | 829 | $1,980 | $2.39 | 0d | 26 | 0.71mi |
| 620 Sheridan St Hyattsville, MD | 1.0 | 1.0 | 708 | $1,585 | $2.24 | 0d | 6 | 0.72mi |
| 21 Riggs Rd NE Washington, DC | 1.0 | 1.0 | 595 | $1,625 | $2.73 | 4d | 6 | 0.94mi |
| 6733 New Hampshire Ave Takoma Park, MD | 1.0–3.0 | 1.0–1.5 | 785 | $1,525 | $1.94 | 0d | 23 | 0.98mi |
| 790 Fairview Ave Takoma Park, MD | 1.0–2.0 | 1.0–1.5 | 894 | $1,399 | $1.56 | 45d | 3 | 1.01mi |
| 5110 Fort Totten Dr NE #4 Washington, DC | 2.0 | 2.0 | 715 | $2,195 | $3.07 | 25d | 1 | 1.01mi |
| 6808 Red Top Rd Unit 6812-003 Takoma Park, MD | 1.0 | 1.0 | 600 | $1,450 | $2.42 | 25d | 1 | 1.03mi |
| 6808 Red Top Rd Unit 6814-006 Takoma Park, MD | 1.0 | 1.0 | 600 | $1,250 | $2.08 | 25d | 1 | 1.03mi |
| 6808 Red Top Rd Takoma Park, MD | 1.0 | 1.0 | 600 | $1,350 | $2.25 | 45d | 3 | 1.03mi |
| 6808 Red Top Rd Unit 6814-005 Takoma Park, MD | 1.0 | 1.0 | 600 | $1,325 | $2.21 | 25d | 1 | 1.03mi |
| 21 Kennedy St NW Washington, DC | 1.0 | 1.0 | 640 | $1,395 | $2.18 | 25d | 1 | 1.06mi |
| 4900 Fort Totten Dr NE Washington, DC | 1.0–2.0 | 1.0 | 706 | $1,427 | $2.02 | 13d | 7 | 1.06mi |
| 5408 1st Pl NW Unit 202 Washington, DC | 2.0 | 1.0 | 515 | $2,050 | $3.98 | 16d | 1 | 1.07mi |
| 5408 1st Pl NW Unit 204 Washington, DC | 1.0 | 1.0 | 445 | $1,549 | $3.48 | 16d | 1 | 1.07mi |
| 4818 Fort Totten Dr NE Washington, DC | 1.0–2.0 | 1.0 | 725 | $1,595 | $2.20 | 4d | 4 | 1.09mi |
| 951 East-West Hwy Takoma Park, MD | 1.0–2.0 | 1.0 | 775 | $1,295 | $1.67 | 11d | 2 | 1.12mi |
| 103 Kennedy St NW Washington, DC | 1.0 | 1.0 | 500 | $1,415 | $2.83 | 25d | 1 | 1.14mi |
| 2731 Nicholson St Hyattsville, MD | 2.0 | 1.0 | 515 | $1,280 | $2.49 | 0d | 21 | 1.16mi |
| 5685 Little Branch Run Hyattsville, MD | 3.0 | 1.0–2.0 | 939 | $2,570 | $2.74 | 3d | 24 | 1.19mi |
| 4520 Fort Totten Dr NE Washington, DC | 1.0–2.0 | 1.0 | 662 | $1,599 | $2.41 | 0d | 7 | 1.20mi |
| 5041 1st St NW Washington, DC | 1.0 | 1.0 | 600 | $1,545 | $2.58 | 5d | 1 | 1.21mi |
| 4510 2nd St NE Washington, DC | 1.0–2.0 | 1.0 | 750 | $1,350 | $1.80 | 4d | 8 | 1.23mi |
| 2400 Queens Chapel Rd Hyattsville, MD | 2.0 | 1.0–2.0 | 752 | $1,554 | $2.06 | 0d | 10 | 1.26mi |
| 800 Taylor St NE Unit 2 Washington, DC | 1.0 | 1.0 | 475 | $1,249 | $2.63 | 25d | 1 | 1.26mi |
| 5735 29th Ave Hyattsville, MD | 1.0–3.0 | 1.0 | 763 | $1,200 | $1.57 | 0d | 50 | 1.27mi |
| 4407 2nd St NE Washington, DC | 1.0 | 1.0 | 703 | $1,425 | $2.03 | 25d | 1 | 1.29mi |
| 4407 2nd St NE Washington, DC | 1.0 | 1.0 | 703 | $1,425 | $2.03 | 23d | 1 | 1.29mi |
HOA detail condo
- Monthly dues
- $709 · $8,508/yr
- Assessments
- None detected in remarks — confirm with the listing agent.
Listing history 3 events
-
2026-06-21days on market $80,000 Coming Soon 3 DOM
-
2026-06-18remarks 699-char remark
-
2026-06-18$80,000 Coming Soon 1 DOM
ⓘ Source: listings_history table (triggers on properties + properties_extension) + one-shot
backfill from property_details.listing_events for pre-trigger history.
Tax reassessment forecast MD · Partial reset (capped growth)
- Current annual tax
- $1,046 · $87/mo
- Projected year-2 tax
- $1,046 · $87/mo
- Expected delta
- $0/yr ($0/mo · 0.0%)
ⓘ Screening estimate from a state-policy table — verify with the county assessor before closing.
Climate risk First Street
- Flood 1/10 Low FEMA zone X (unshaded) · 0% chance over 30 yrs
- Wildfire 1/10 Low
- Heat 7/10 Severe 7 d/yr ≥104°F today · 15 d/yr by 30 yrs out
- Wind 4/10 Moderate 15% chance of damaging wind over 30 yrs
- Air quality 4/10 Moderate 5 unhealthy d/yr today · 6 by 30 yrs out
Nearby sold comps map
Loading sold comps map…
Walkable amenities ~0.75 mi
Loading nearby amenities…
Taxation est. · year 1
- Rental income
- $18,600
- − Mortgage interest
- −$4,481
- − Property taxes
- −$1,046
- − Insurance
- −$400
- − Repairs & maintenance
- −$1,488
- − Management
- −$1,488
- − HOA
- −$8,508
- − Depreciation
- −$2,327
- Taxable loss
- −$1,138
- Est. tax savings @ 24.0%
- +$273
- After-tax cash flow
- $-21/yr
For passive investors: Depreciation is non-cash, so a rental often shows a tax loss while cash-flowing — sheltering income. Rental losses are passive: they offset passive income freely, and up to $25,000/yr can offset ordinary (W-2) income if you actively participate and your MAGI is under $100k (phasing out to $0 by $150k); unused losses carry forward. On sale, claimed depreciation is recaptured at up to 25%, and gains may owe capital-gains tax (a 1031 exchange can defer both). Figures are a year-1 estimate at your 24.0% rate — not tax advice; consult a CPA.
Schools (NCES district)
- District
- Prince George'S County Public Schools
- NCES district ID
- 2400510
- Math proficiency
- 8% ▼ -11.00%
- Reading proficiency
- 24% ▼ -9.00%
- Median HH income
- $73,967
- Composite
- 16.82/100
- National rank
- #9151
- State rank
- #21 of 24 in MD
Livability — Chillum
- Score
- 75/100
- State rank
- #105
- US rank
- #4157
Category grades
Schools grade is shown separately in the Schools card above.
Census & demographics
- Census place
- Chillum, MD
- County
- Prince Georges County · 919,866 people
- Metro
- Washington-Arlington-Alexandria, DC-VA-MD-WV
- Population (ZIP)
- 34,293
- Household income
- $90,205
- Rent vs Own
- Severe rent burden
- 1219.0
Population outlook (Prince George's County) Hauer SSP2
- Today (2025)
- 1,005,426 people
- By 2030
- 1,048,416 · +4.3%
- By 2040
- 1,123,425 · +11.7%
- By 2050
- 1,183,220 · +17.7%
- By 2075
- 1,306,202 · +29.9%
- By 2100
- 1,408,179 · +40.1%
Race, ethnicity, and origin ACS 2023
- Neighborhood character
- Diverse neighborhood (Simpson 0.67)
- Race & ethnicity
- Hispanic / Latino 41% Black 37% White 14% Two or more races 11% Asian 4%
- Hispanic origin (detail)
- Mexican 5% Puerto Rican 1% Dominican 2%
- Common ancestry
- Romanian 1% Hispanic 1%
- Foreign-born
- 42% · Canada
- Languages at home
- 47% English-only · Spanish 37% Other Indo-European 3% French/Haitian/Cajun 2%
Political lean MEDSL · Prince George's
- 2024 margin
- Solid D (+75.2) · D 86.3% · R 11.2% · Other 2.5%
- 2008→2024 swing
- -3.3pp toward R · 2008: 78.5pp · 2024: 75.2pp
- All cycles
- 2024: D+75.2 2020: D+80.5 2016: D+81.0 2012: D+80.9 2008: D+78.5
Not yet ingested
- Civics
- —
Market trends
- HPI YoY
- ▼ -303.99%
- Current HPI
- 306.7503
- Rent YoY
- ▼ -0.92%
- Metro
- Washington-Arlington-Alexandria, DC-VA-MD-WV
- State GDP YoY
- ▲ 2.97%
- F500 in state
- 12
Industry mix (Fortune 500 HQ in MD)
| Industry | F500 HQs | Revenue |
|---|---|---|
| Aerospace / Defense | 1 | $71B |
|
||
| Utilities | 1 | $25B |
|
||
| Hotels | 1 | $24B |
|
||
| Consumer Goods | 1 | $7B |
|
||
| Real Estate | 1 | $6B |
|
||
| Chemicals | 1 | $2B |
|
||
Price history
+77.8% since first listed10 events — show timeline
- 2026-06-18 Coming Soon $80,000 BRIGHT MLS
- 2013-01-08 Sold (Public Records) $45,000 Public Records
- 2012-12-27 Sold (MLS) $45,000 MRIS
- 2012-12-27 Sold (MLS) $45,000 BRIGHT MLS
- 2012-08-20 Pending — MRIS
- 2012-08-20 Listing Removed — BRIGHT MLS
- 2012-08-10 Listed $45,000 BRIGHT MLS
- 2012-08-10 Listed $45,000 MRIS
- 2007-01-28 Delisted — MRIS
- 2006-10-11 Listed — MRIS
Property tax history
-3.2%/yrLatest (2025): $1,046 · +4.8% YoY. Source: county tax records.
Cash-flow waterfall
monthlySold comps — $/sqft
last 12 mo · ≤1 miLoading sold comps…