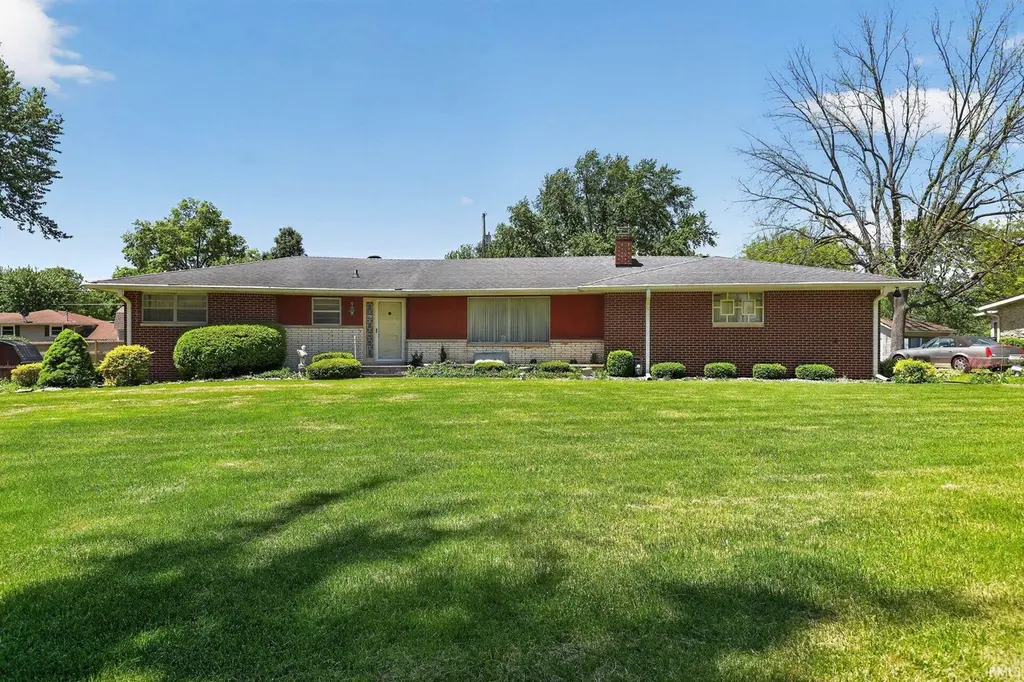
2429 Melody Ln · Anderson, IN
Flood risk 1/10 · Minimal
- FEMA flood zone
- X (unshaded)
- Chance of flooding over 30 yrs
- 0.0%
- Est. flood insurance / yr
- $473 – $860
Fire risk 1/10 · Minimal
- Est. fire insurance / yr
- $717 – $1,331
Heat risk 3/10 · Minor
- Hot days now (above 100°F)
- 7 days/yr
- Hot days in 30 yrs
- 18 days/yr
Wind risk 2/10 · Minimal
- Chance of severe wind over 30 yrs
- 1.0%
Air-quality risk 3/10 · Minor
- Unhealthy air days now
- 2 days/yr
- Unhealthy air days in 30 yrs
- 3 days/yr
Risk factors via First Street. Map © Google.
Why this score? — see what drove the B- grade
The composite is a weighted blend of 9 inputs, each scored 0–100. Each bar is that input's sub-score; the figure is the points it added to the 100-point composite (weight × sub-score).
- Cash flow +30.0/30.0
- 1% rule +10.0/10.0
- DSCR +10.0/10.0
- ARV discount +7.5/15.0
- Rent growth +3.0/5.0
- Livability +3.0/5.0
- Condition / age +2.5/5.0
- Schools +1.6/10.0
- Appreciation +0.0/10.0
$84,900
🖨 Deal sheet 📄 Offer letter ✓ Due diligence
Listing remarks
Unlock instant equity and transform this spacious Anderson home into your next success story. With over 1,600 square feet, an attached garage, and a generous lot, this solid brick property is ready for a full renovation. Bring your vision to this one-story, 2-bedroom, 1.5-bath layout featuring a fireplace and unfinished basement. Located in a quiet neighborhood near top schools, this property is priced well below market, offering huge upside for investors or buyers ready to add value and make it shine. Property is being sold as-is.
Key facts
- Attached garage
- Top schools
- Unfinished basement
Tags
Property features AI
Exterior
- Parking: Attached 2-car garage
- Utilities: Well water; Septic tank
- Home design: Single-family site-built home; One-story
- Construction: Built with asphalt and brick materials
- Exterior features: Level lot; Lot dimensions approximately 125 x 150
Interior
- Bedrooms: Total of 7 rooms (includes bedrooms and living spaces)
- Bathrooms: One full bathroom; One half bathroom; Two main-level bathrooms
- Heating & cooling: Central air conditioning
- Interior features: Gas-started fireplace in the living room; Full unfinished basement
- Laundry & utility: Laundry located in the basement
Neighborhood map
What this means for you Summary
Snapshot
- This is a 3-bed/1.5-bath single-family listed at $85k.
Deal economics
- At list price, monthly cash flow is $387 ($5k/yr) — positive.
- The deal already cash-flows at list — no discount required.
- Meets the 1% rule at list price ($1k rent vs $85k).
- Cap rate 11.8% vs local median 6.5% in Anderson — top-decile yield for the area; either an underpriced asset or a hidden risk that comps aren't pricing in. Stress-test before assuming the spread holds.
Location & tenants
- Location reads 60/100 on livability (#521 in IN) — a middle-class / working-renter tenant base. Strengths: cost of living A+, housing A+; Watch: crime D-, amenities F, commute F.
- Anderson Community School Corporation (urban): math 15% / reading 23% proficiency, ranked #280 of 301 in IN (top 93%) — low school quality limits family demand, transient renter base, plan for 1-2y turnover; 70% free/reduced lunch — lower-income household profile, screen leases tightly.
- Zoned schools: Eastside Elementary School (math 34% / reading 36%, grade F, #590 of 994 statewide, top 60%, 511 students, 77% FRL); Highland Middle School (math 9% / reading 22%, grade F, #293 of 330 statewide, top 90%, 914 students, 81% FRL); Anderson High School (math 21% / reading 51%, grade F, #261 of 369 statewide, top 71%, 1,790 students, 76% FRL).
- Market conditions: Rents rising (+1.8%/yr); 159 active listings in the ZIP; 184 units permitted in Madison County in 2024 (0 in 5+ unit buildings).
- This rent runs 30% of the median local income ($58k/yr) — at the standard rent-burdened threshold; future hikes will face affordability resistance.
Forward outlook
- Local home prices are declining (-3.0%/yr); year-one equity from $587 of loan paydown is wiped out by about $3k of value loss. Plan a longer hold.
- Madison County population projected at -14% by 2050 — secular population decline; favor cash flow + early exit over multi-decade hold.
- At projected returns (-3.0% appreciation + 1.8% rent growth), your $24k cash investment doubles in ~7 years — after that, you're playing with house money.
Negotiation context
- Only 5 days on market — expect competitive offers; lowballing is unlikely to land.
Risks & watch-outs
- Watch-outs: property tax is 4.2% of price.
Questions for the listing agent
- Built in 1967 — when were the roof, HVAC, electrical panel, plumbing, and water heater last replaced?
- Property tax is high relative to price — has the assessment been appealed recently, and will the sale trigger a re-assessment?
- Is there a deadline driving the sale (1031 exchange, divorce, estate, relocation)? That informs how much negotiation room exists.
- Schools are F-rated, which usually means shorter tenancies and higher turnover. Who's the typical renter profile here, and what's been the actual vacancy rate?
- Crime grade is D in this area — have there been break-ins, vandalism, or insurance claims at this property in the last 3 years? What carrier currently insures it and at what premium?
- What's the average days-on-market for RENTAL listings here right now (not sales)? A rising rental-DOM trend means longer vacancies and softer asking-rent achievability than the comps imply.
- What's the recent tenant-quality profile in this submarket — average credit score on applications, eviction rate, late-payment / NSF rate, and stable-employment percentage? A property-management company in the area should have these aggregated.
- How much new for-sale + rental construction is in the pipeline within 1–3 miles? Heavy new supply typically softens prices + rents 12–24 months out; constrained supply supports both.
Investment metrics
- 1% rule
- 1.74% ✓
- Cap rate
- 11.76%
- Cash-on-cash
- 19.51%
- DSCR
- 1.87
- GRM
- 4.8
CMA / ARV
- ARV (median comp)
- $223,851
- List price
- $84,900
- Delta
- -62.07%
- Verdict
- UNDERPRICED
- Comps
- 20 within 1.0 mi
Show comp detail 12 sales within ~0.75 mi
| Address | Dist | Beds/Ba | Sqft | Sold | Price | $/sf | Match |
|---|---|---|---|---|---|---|---|
| 2429 Melody Ln | 0.00mi | 2/1.5 (-1) | 1,633 (0%) | 0mo | $84,900 | $52 | 95 |
| 2208 E Cross St | 0.36mi | 3/2.0 | 1,679 (+3%) | 4mo | $232,900 | $139 | 73 |
| 2428 Lake Dr | 0.03mi | 3/2.0 | 1,515 (-7%) | 22mo | $215,000 | $142 | 66 |
| 1495 E 240 N | 0.49mi | 3/1.5 | 1,686 (+3%) | 11mo | $250,000 | $148 | 62 |
| 2605 Catalina Dr | 0.33mi | 3/2.0 | 1,851 (+13%) | 1mo | $230,000 | $124 | 59 |
| 2702 Tamra Ln | 0.63mi | 3/2.0 | 1,728 (+6%) | 1mo | $195,000 | $113 | 58 |
| 2334 Impala Dr | 0.55mi | 3/2.5 | 1,812 (+11%) | 2mo | $290,000 | $160 | 51 |
| 2338 Malibu Ct | 0.38mi | 3/2.0 | 1,846 (+13%) | 13mo | $245,000 | $133 | 48 |
| 1623 Sherwood Dr | 0.58mi | 3/1.0 | 1,499 (-8%) | 14mo | $160,500 | $107 | 45 |
| 2728 Catalina Dr | 0.50mi | 3/2.0 | 1,494 (-8%) | 22mo | $235,000 | $157 | 42 |
| 1618 Northcrest Dr | 0.68mi | 3/2.0 | 1,742 (+7%) | 20mo | $199,900 | $115 | 38 |
| 2138 Kayhill Dr | 0.67mi | 3/2.0 | 1,870 (+14%) | 14mo | $260,000 | $139 | 31 |
Match score weights: distance 35% · size 25% · config 20% · recency 20%. Top-matched comps best support the ARV.
Projected returns pro-forma
-3.0% appreciation · 1.82% rent growth · sell at horizon
- IRR
- 10.0%
- Equity multiple
- 1.39×
- Total profit
- $9,271
- Equity at exit
- $12,659
- IRR
- 18.0%
- Equity multiple
- 2.41×
- Total profit
- $33,407
- Equity at exit
- $7,341
Cash invested: $23,772 (down + closing). Projections, not guarantees.
Landlord ↔ Tenant lean methodology
- Overall (STATE)
- 90 Strongly Landlord-Friendly
- State Indiana
- 90 Strongly Landlord-Friendly · R+11
- County
- — inherits STATE
- City
- — inherits STATE
ZIP-level market 46012
- Home prices YoY
- -18.6%
- Rents YoY
- 1.8%
- Active inventory
- 159
- Price-to-rent
- 4.8×
Monthly cashflow live
- Estimated rent
- $1,475 medium interval (Pro) →
- Mortgage (P&I)
- −$445
- Tax from tax record
- −$298 /mo · $3,576/yr
- Insurance
- −$35
- HOA
- −$0
- Vacancy / Maint / Mgmt
- −$310
- Net cashflow
- $387
Break-even live
UW: 25.0% down · 7.5% · 30yr · 1.5% tax · 5.0% vac · 8.0% maint · 8.0% mgmt
Financing live
Cash to close
- Down payment
- $21,225
- Closing costs
- $2,547
- Reserves months
- —
- Total cash needed
- —
Loan-product check · same deal, 3 products live
Conventional
25% down · 7.5% · 30yr
- Down + closing
- —
- Monthly P&I
- —
- Monthly cashflow
- —
- DSCR
- —
- Eligible?
- —
Personal DTI + credit; lowest rate.
DSCR
20% down · 8.5% · 30yr
- Down + closing
- —
- Monthly P&I
- —
- Monthly cashflow
- —
- DSCR
- —
- Eligible?
- —
No personal income docs; deal must DSCR.
Hard money
10% down · 12.0% · 12mo
- Down + closing
- —
- Monthly P&I
- —
- Monthly cashflow
- —
- DSCR
- —
- Eligible?
- —
Short-term bridge; refi at stabilization.
Listing history 3 events
-
2026-05-18status Pending 537-char remark
-
2026-05-16price $84,900 537-char remark
-
2026-05-13$89,900 Active 537-char remark
ⓘ Source: listings_history table (triggers on properties + properties_extension) + one-shot
backfill from property_details.listing_events for pre-trigger history.
Tax reassessment forecast IN · Partial reset (capped growth)
- Current annual tax
- $3,576 · $298/mo
- Projected year-2 tax
- $3,576 · $298/mo
- Expected delta
- $0/yr ($0/mo · 0.0%)
ⓘ Screening estimate from a state-policy table — verify with the county assessor before closing.
Climate risk First Street
- Flood 1/10 Low FEMA zone X (unshaded) · 0% chance over 30 yrs
- Wildfire 1/10 Low
- Heat 3/10 Moderate 7 d/yr ≥100°F today · 18 d/yr by 30 yrs out
- Wind 2/10 Low 100% chance of damaging wind over 30 yrs
- Air quality 3/10 Moderate 2 unhealthy d/yr today · 3 by 30 yrs out
Nearby sold comps map
Loading sold comps map…
Walkable amenities ~0.75 mi
Loading nearby amenities…
Taxation est. · year 1
- Rental income
- $17,698
- − Mortgage interest
- −$4,756
- − Property taxes
- −$3,576
- − Insurance
- −$424
- − Repairs & maintenance
- −$1,416
- − Management
- −$1,416
- − Depreciation
- −$2,470
- Taxable income
- $3,640
- Est. tax owed @ 24.0%
- −$874
- After-tax cash flow
- $3,765/yr
For passive investors: Depreciation is non-cash, so a rental often shows a tax loss while cash-flowing — sheltering income. Rental losses are passive: they offset passive income freely, and up to $25,000/yr can offset ordinary (W-2) income if you actively participate and your MAGI is under $100k (phasing out to $0 by $150k); unused losses carry forward. On sale, claimed depreciation is recaptured at up to 25%, and gains may owe capital-gains tax (a 1031 exchange can defer both). Figures are a year-1 estimate at your 24.0% rate — not tax advice; consult a CPA.
Schools (NCES district)
- District
- Anderson Community School Corporation
- NCES district ID
- 1800150
- Math proficiency
- 15% ▼ -14.00%
- Reading proficiency
- 23% ▼ -7.00%
- Median HH income
- $38,208
- Composite
- 15.93/100
- National rank
- #9250
- State rank
- #280 of 301 in IN
Livability — Anderson
- Score
- 60/100
- State rank
- #521
- US rank
- #18709
Category grades
Schools grade is shown separately in the Schools card above.
Census & demographics
- County
- Madison County · 69,445 people
- City population
- 57,762
- Metro
- Indianapolis-Carmel-Anderson, IN
- Population (ZIP)
- 20,855
- Household income
- $58,041
- Rent vs Own
- Severe rent burden
- 987.0
Population outlook (Madison County) Hauer SSP2
- Today (2025)
- 125,800 people
- By 2030
- 122,640 · -2.5%
- By 2040
- 115,420 · -8.3%
- By 2050
- 108,148 · -14.0%
- By 2075
- 91,838 · -27.0%
- By 2100
- 75,670 · -39.8%
Race, ethnicity, and origin ACS 2023
- Neighborhood character
- Predominantly White (85%)
- Race & ethnicity
- White 85% Hispanic / Latino 5% Two or more races 4% Black 4%
- Hispanic origin (detail)
- Mexican 4%
- Common ancestry
- Slovak 3% Serbian 2% Italian 1%
- Foreign-born
- 2% · Canada, Vietnam
- Languages at home
- 96% English-only · Spanish 3%
Political lean MEDSL · Madison
- 2024 margin
- Strong R (+26.9) · D 35.6% · R 62.5% · Other 1.9%
- 2008→2024 swing
- -33.5pp toward R · 2008: 6.5pp · 2024: -26.9pp
- All cycles
- 2024: R+26.9 2020: R+22.6 2016: R+25.7 2012: R+4.5 2008: D+6.5
Not yet ingested
- Civics
- —
Market trends
- HPI YoY
- ▼ -61.16%
- Current HPI
- 266.9819
- Rent YoY
- ▲ 1.82%
- Metro
- Indianapolis-Carmel-Anderson, IN
- State GDP YoY
- ▲ 2.90%
- F500 in state
- 18
Industry mix (Fortune 500 HQ in IN)
| Industry | F500 HQs | Revenue |
|---|---|---|
| Industrial Machinery | 2 | $37B |
|
||
| Healthcare | 1 | $177B |
|
||
| Pharmaceuticals | 1 | $45B |
|
||
| Metals / Steel | 1 | $18B |
|
||
| Agriculture | 1 | $17B |
|
||
| Packaging | 1 | $12B |
|
||
Price history
-5.6% since first listed4 events — show timeline
- 2026-06-05 Sold (MLS) $84,900 IRMLS
- 2026-05-18 Pending — IRMLS
- 2026-05-16 Price Changed $84,900 IRMLS
- 2026-05-13 Listed $89,900 IRMLS
Property tax history
+12.0%/yrLatest (2024): $3,576 · +121.4% YoY. Source: county tax records.
Cash-flow waterfall
monthlySold comps — $/sqft
last 12 mo · ≤1 miLoading sold comps…