 Multi-family
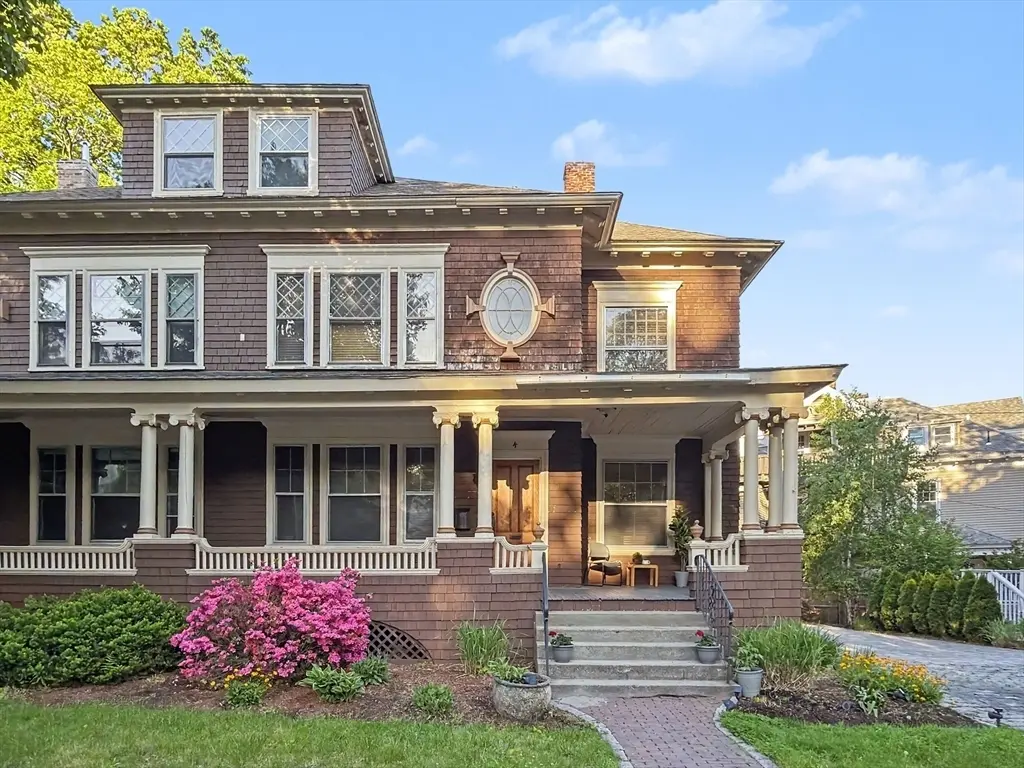
4 Westland St · Worcester, MA
Flood risk 1/10 · Minimal
- FEMA flood zone
- X (unshaded)
- Chance of flooding over 30 yrs
- 0.0%
- Est. flood insurance / yr
- $473 – $860
Fire risk 1/10 · Minimal
- Est. fire insurance / yr
- $915 – $1,699
Heat risk 4/10 · Minor
- Hot days now (above 93°F)
- 7 days/yr
- Hot days in 30 yrs
- 16 days/yr
Wind risk 6/10 · Moderate
- Chance of severe wind over 30 yrs
- 27.0%
Air-quality risk 2/10 · Minimal
- Unhealthy air days now
- 1 days/yr
- Unhealthy air days in 30 yrs
- 2 days/yr
Risk factors via First Street. Map © Google.
Why this score? — see what drove the B- grade
The composite is a weighted blend of 9 inputs, each scored 0–100. Each bar is that input's sub-score; the figure is the points it added to the 100-point composite (weight × sub-score).
- Cash flow +30.0/30.0
- DSCR +10.0/10.0
- 1% rule +8.5/10.0
- ARV discount +6.7/15.0
- Livability +4.4/5.0
- Rent growth +4.1/5.0
- Condition / age +2.5/5.0
- Schools +2.0/10.0
- Appreciation +0.0/10.0
$679,900
🖨 Deal sheet 📄 Offer letter ✓ Due diligence
Multi-family units
County records classify this as Multi-Family (2-4 Unit). Listing-text estimate: 1 unit. estimate disagrees with records
Listing remarks MLS
Stunning 4 bedroom, 3 full & 2 half bath Worcester home featuring the perfect blend of historic charm & modern upgrades! Beautiful craftmanship shines in all of the woodwork, the stairways, the high ceilings & exposed brick. This home offers hardwood flooring throughout. The family room has original fireplace & mantle as well as built ins & original windows. The large dining room boasts kitchen views through the breakfast bar/ kitchen island opening. The amazing kitchen offers all stainless steel appliances, updated cabinetry, exterior access & a gas range. Upstairs you will find 3 spacious bedrooms (1 with a fireplace) 2 full baths, 2nd floor laundry & a walk in closet. Primary suite created on the 3rd floor for ultimate privacy including a full bath with soaking tub, a home gym & a coffee wet bar. Finished basement with full bar, game room & 1/2 bath. Spacious front porch perfect for relaxing. Large outdoor patio & parking for 4 down the paver set driveway; soon to be fenced in.
Key facts
- Exposed brick
- Grand staircases
- Original woodwork
Tags
Property features AI
Finance
- HOA & community: Not a senior community
Exterior
- Parking: 3 parking spaces (open)
- Utilities: Public water; Public sewer
- Home design: Single family residence; Entry level rooms primarily on first level; Built as recorded in public records
- Construction: Stone foundation; Lead paint present
- Exterior features: Cleared, level lot; City views
Interior
- Kitchen: Kitchen on first level
- Bedrooms: Master bedroom on third level; Additional bedrooms on second level
- Bathrooms: 3 full bathrooms; 2 half bathrooms; Master bathroom present
- Heating & cooling: Central heating (forced air, natural gas); Central air conditioning
- Interior features: 19 total rooms; Bathroom; Game room; Bonus room; Home office; Den; Full finished basement; Two fireplaces
- Laundry & utility: Laundry on second floor
Neighborhood map
What this means for you Summary
Snapshot
- This is a 4-bed/2.0-bath multifamily listed at $680k.
Deal economics
- At list price, monthly cash flow is $3k ($35k/yr) — positive.
- The deal already cash-flows at list — no discount required.
- Meets the 1% rule at list price ($9k rent vs $680k).
- Recommended offer: $670k (1.5% below list) — sets the bar for market timing.
- Cap rate 11.4% vs local median 4.1% in Worcester — top-decile yield for the area; either an underpriced asset or a hidden risk that comps aren't pricing in. Stress-test before assuming the spread holds.
Location & tenants
- Location reads 87/100 on livability (#9 in MA, #312 nationally) — a professional / high-income tenant draw. Strengths: crime A+, amenities A+, commute A+; Watch: schools C-, cost of living D.
- Worcester (urban): math 17% / reading 30% proficiency, ranked #280 of 302 in MA (top 93%) — low school quality limits family demand, transient renter base, plan for 1-2y turnover; 66% free/reduced lunch — lower-income household profile, screen leases tightly.
- Market conditions: Rents rising fast (+6.4%/yr); 29 active listings in the ZIP; 2 comparable units currently listed for rent nearby; solid renter incomes; 2,293 units permitted in Worcester County in 2024 (1,205 in 5+ unit buildings).
- At $9,200/mo this rent would consume 120% of the median local household income ($92k/yr) (locally 1037% of renters already pay >50% of income on rent) — very limited rent-growth headroom before tenants either downsize or default.
Forward outlook
- Local home prices are declining (-3.0%/yr); year-one equity from $5k of loan paydown is wiped out by about $20k of value loss. Plan a longer hold.
- At projected returns (-3.0% appreciation + 6.4% rent growth), your $190k cash investment doubles in ~6 years — after that, you're playing with house money.
Negotiation context
- It's been on market 18 days — a 2% lower offer ($670k) is reasonable based on typical stale-listing flexibility.
- 3 sale attempts since 11y ago with the ask held roughly flat each time — persistent listings suggest the price (not the market) is what's stuck; bring a comps-based counter.
Risks & watch-outs
- Watch-outs: built in 1893 — expect roof / HVAC / electrical / plumbing capex.
- Climate carrying-cost: major wind risk, 27% chance of damaging wind over 30y — expect insurance premiums to compound above CPI over the hold.
Questions for the listing agent
- Built in 1893 — when were the roof, HVAC, electrical panel, plumbing, and water heater last replaced?
- Is there a deadline driving the sale (1031 exchange, divorce, estate, relocation)? That informs how much negotiation room exists.
- What's the average days-on-market for RENTAL listings here right now (not sales)? A rising rental-DOM trend means longer vacancies and softer asking-rent achievability than the comps imply.
- What's the recent tenant-quality profile in this submarket — average credit score on applications, eviction rate, late-payment / NSF rate, and stable-employment percentage? A property-management company in the area should have these aggregated.
- How much new apartment / multifamily construction is in the pipeline within 1–3 miles? Heavy new supply (>2% of stock underway) typically softens rents 12–24 months out; light construction supports rent growth.
Investment metrics
- 1% rule
- 1.35% ✓
- Cap rate
- 11.38%
- Cash-on-cash
- 18.18%
- DSCR
- 1.81
- GRM
- 6.2
CMA / ARV
- ARV (on-the-fly)
- $668,418
- Comps found
- 3
Show comp detail 3 sales within ~0.75 mi
| Address | Dist | Beds/Ba | Sqft | Sold | Price | $/sf | Match |
|---|---|---|---|---|---|---|---|
| 6 Newton Ave | 0.40mi | 4/2.0 | 3,050 (-8%) | 10mo | $615,000 | $202 | 60 |
| 40 June St | 0.60mi | 3/3.0 (-1) | 3,160 (-4%) | 11mo | $700,000 | $222 | 46 |
| 7 Nevada St | 0.67mi | 5/2.5 (+1) | 3,359 (+2%) | 21mo | $665,000 | $198 | 41 |
Match score weights: distance 35% · size 25% · config 20% · recency 20%. Top-matched comps best support the ARV.
Projected returns pro-forma
-3.0% appreciation · 6.44% rent growth · sell at horizon
- IRR
- 13.5%
- Equity multiple
- 1.56×
- Total profit
- $106,443
- Equity at exit
- $101,375
- IRR
- 24.7%
- Equity multiple
- 3.49×
- Total profit
- $474,139
- Equity at exit
- $58,785
Cash invested: $190,372 (down + closing). Projections, not guarantees.
Landlord ↔ Tenant lean methodology
- Overall (STATE)
- 20 Strongly Tenant-Friendly
- State Massachusetts
- 20 Strongly Tenant-Friendly · D+15
- County
- — inherits STATE
- City
- — inherits STATE
ZIP-level market 01602
- Rents YoY
- 6.4%
- Active inventory
- 29
- Price-to-rent
- 20.7×
Monthly cashflow live
- Estimated rent
- $9,200 high interval (Pro) →
- Mortgage (P&I)
- −$3,565
- Tax from tax record
- −$534 /mo · $6,414/yr
- Insurance
- −$283
- HOA
- −$0
- Vacancy / Maint / Mgmt
- −$1,932
- Net cashflow
- $2,885
Break-even live
4-unit breakdown (identical units grouped — click to expand)
| Units | Beds | Baths | Est. rent |
|---|---|---|---|
| 1× unit | 4 | 3 | $2,737 |
| 3× units | 1 | 1 | $6,462 |
| #2 | 1 | 1 | $2,154 |
| #3 | 1 | 1 | $2,154 |
| #4 | 1 | 1 | $2,154 |
| Total (4 units) | $9,200 | ||
UW: 25.0% down · 7.5% · 30yr · 1.5% tax · 5.0% vac · 8.0% maint · 8.0% mgmt
Financing live
Cash to close
- Down payment
- $169,975
- Closing costs
- $20,397
- Reserves months
- —
- Total cash needed
- —
Loan-product check · same deal, 3 products live
Conventional
25% down · 7.5% · 30yr
- Down + closing
- —
- Monthly P&I
- —
- Monthly cashflow
- —
- DSCR
- —
- Eligible?
- —
Personal DTI + credit; lowest rate.
DSCR
20% down · 8.5% · 30yr
- Down + closing
- —
- Monthly P&I
- —
- Monthly cashflow
- —
- DSCR
- —
- Eligible?
- —
No personal income docs; deal must DSCR.
Hard money
10% down · 12.0% · 12mo
- Down + closing
- —
- Monthly P&I
- —
- Monthly cashflow
- —
- DSCR
- —
- Eligible?
- —
Short-term bridge; refi at stabilization.
Rent comps 2 comps
| Address | Beds | Baths | Sqft | Rent | $/sqft | DOM | Units | Dist |
|---|---|---|---|---|---|---|---|---|
| 2 Main St Worcester, MA | 3.0 | 1.0–2.5 | 2046 | $4,149 | $2.03 | 23d | 6 | 0.84mi |
| 8 Minthorne St Worcester, MA | 3.0 | 2.0 | 2663 | $3,000 | $1.13 | 43d | 1 | 1.30mi |
Listing history 14 events
-
2026-06-18days on market $679,900 Active 18 DOM
-
2026-06-17days on market $679,900 Active 17 DOM
-
2026-06-16days on market $679,900 Active 16 DOM
-
2026-06-15days on market $679,900 Active 15 DOM
-
2026-06-14days on market $679,900 Active 13 DOM
-
2026-06-10days on market $679,900 Active 10 DOM
-
2026-06-09days on market $679,900 Active 9 DOM
-
2026-06-08days on market $679,900 Active 8 DOM
-
2026-06-07statusdays on market $679,900 Active 7 DOM
-
2026-06-05days on market $679,900 New 4 DOM
-
2026-06-03days on market $679,900 New 3 DOM
-
2026-06-02days on market $679,900 New 2 DOM
-
2026-06-01remarks 699-char remark
-
2026-06-01$679,900 New 1 DOM
ⓘ Source: listings_history table (triggers on properties + properties_extension) + one-shot
backfill from property_details.listing_events for pre-trigger history.
Tax reassessment forecast MA · Partial reset (capped growth)
- Current annual tax
- $6,414 · $534/mo
- Projected year-2 tax
- $7,388 · $616/mo
- Expected delta
- +$974/yr (+$81/mo · 15.2%)
ⓘ Screening estimate from a state-policy table — verify with the county assessor before closing.
Climate risk First Street
- Flood 1/10 Low FEMA zone X (unshaded) · 0% chance over 30 yrs
- Wildfire 1/10 Low
- Heat 4/10 Moderate 7 d/yr ≥93°F today · 16 d/yr by 30 yrs out
- Wind 6/10 Major 27% chance of damaging wind over 30 yrs
- Air quality 2/10 Low 1 unhealthy d/yr today · 2 by 30 yrs out
Nearby sold comps map
Loading sold comps map…
Walkable amenities ~0.75 mi
Loading nearby amenities…
Taxation est. · year 1
- Rental income
- $110,400
- − Mortgage interest
- −$38,085
- − Property taxes
- −$6,414
- − Insurance
- −$3,400
- − Repairs & maintenance
- −$8,832
- − Management
- −$8,832
- − Depreciation
- −$19,779
- Taxable income
- $25,059
- Est. tax owed @ 24.0%
- −$6,014
- After-tax cash flow
- $28,603/yr
For passive investors: Depreciation is non-cash, so a rental often shows a tax loss while cash-flowing — sheltering income. Rental losses are passive: they offset passive income freely, and up to $25,000/yr can offset ordinary (W-2) income if you actively participate and your MAGI is under $100k (phasing out to $0 by $150k); unused losses carry forward. On sale, claimed depreciation is recaptured at up to 25%, and gains may owe capital-gains tax (a 1031 exchange can defer both). Figures are a year-1 estimate at your 24.0% rate — not tax advice; consult a CPA.
Schools (NCES district)
- District
- Worcester
- NCES district ID
- 2513230
- Math proficiency
- 17% ▼ -15.00%
- Reading proficiency
- 30% ▼ -8.00%
- Median HH income
- $45,063
- Composite
- 20.3/100
- National rank
- #8615
- State rank
- #280 of 302 in MA
Livability — Worcester
- Score
- 87/100
- State rank
- #9
- US rank
- #312
Category grades
Schools grade is shown separately in the Schools card above.
Census & demographics
- Census place
- Worcester, MA
- County
- Worcester County · 487,911 people
- City population
- 207,324
- Metro
- Worcester, MA-CT
- Population (ZIP)
- 27,092
- Household income
- $91,764
- Rent vs Own
- Severe rent burden
- 1037.0
Population outlook (Worcester County) Hauer SSP2
- Today (2025)
- 850,858 people
- By 2030
- 860,403 · +1.1%
- By 2040
- 869,902 · +2.2%
- By 2050
- 869,110 · +2.1%
- By 2075
- 870,120 · +2.3%
- By 2100
- 829,703 · -2.5%
Race, ethnicity, and origin ACS 2023
- Neighborhood character
- Predominantly White (66%)
- Race & ethnicity
- White 66% Hispanic / Latino 15% Two or more races 11% Black 9% Asian 6%
- Hispanic origin (detail)
- Puerto Rican 8% Dominican 2%
- Common ancestry
- Lithuanian 4% Romanian 4% Scotch-Irish 2%
- Foreign-born
- 19% · Canada, Vietnam, Jamaica
- Languages at home
- 70% English-only · Spanish 11% Other Indo-European 9% Vietnamese 2%
Political lean MEDSL · Worcester
- 2024 margin
- D (+10.0) · D 53.9% · R 43.9% · Other 2.2%
- 2008→2024 swing
- -3.8pp toward R · 2008: 13.8pp · 2024: 10.0pp
- All cycles
- 2024: D+10.0 2020: D+17.8 2016: D+10.5 2012: D+9.2 2008: D+13.8
Not yet ingested
- Civics
- —
Market trends
- HPI YoY
- ▼ -330.19%
- Current HPI
- 294.2528
- Rent YoY
- ▲ 6.44%
- Metro
- Worcester, MA-CT
- State GDP YoY
- ▲ 2.28%
- F500 in state
- 38
Industry mix (Fortune 500 HQ in MA)
| Industry | F500 HQs | Revenue |
|---|---|---|
| Technology | 3 | $17B |
|
||
| Insurance | 2 | $84B |
|
||
| Retail | 2 | $76B |
|
||
| Life Sciences | 1 | $43B |
|
||
| Energy Technology | 1 | $31B |
|
||
| Aerospace / Defense | 1 | $18B |
|
||
Price history
+223.8% since first listed7 events — show timeline
- 2026-06-01 Listed $679,900 MLS PIN
- 2024-06-24 Sold (MLS) $599,900 MLS PIN
- 2024-05-02 Pending — MLS PIN
- 2024-04-25 Listed $599,900 MLS PIN
- 2015-06-24 Sold (MLS) $210,000 MLS PIN
- 2015-05-07 Pending — MLS PIN
- 2015-04-15 Listed $210,000 MLS PIN
Property tax history
-1.0%/yrLatest (2023): $6,414 · +10.4% YoY. Source: county tax records.
Cash-flow waterfall
monthlySold comps — $/sqft
last 12 mo · ≤1 miLoading sold comps…