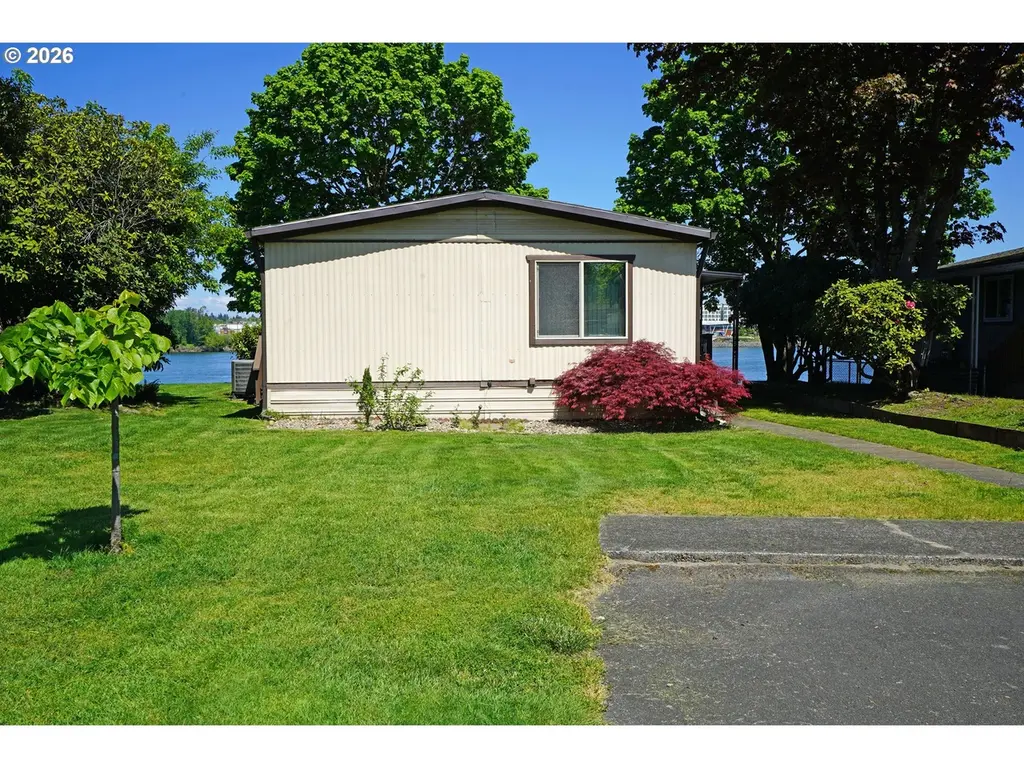
2241 N Menzies Dr · Portland, OR
Flood risk 7/10 · Major
- FEMA flood zone
- X (unshaded)
- Chance of flooding over 30 yrs
- 0.77%
- Est. flood insurance / yr
- $507 – $1,088
Fire risk 1/10 · Minimal
- Est. fire insurance / yr
- $498 – $926
Heat risk 3/10 · Minor
- Hot days now (above 92°F)
- 7 days/yr
- Hot days in 30 yrs
- 14 days/yr
Wind risk 1/10 · Minimal
- Chance of severe wind over 30 yrs
- —
Air-quality risk 10/10 · Severe
- Unhealthy air days now
- 19 days/yr
- Unhealthy air days in 30 yrs
- 20 days/yr
Risk factors via First Street. Map © Google.
Why this score? — see what drove the B+ grade
The composite is a weighted blend of 9 inputs, each scored 0–100. Each bar is that input's sub-score; the figure is the points it added to the 100-point composite (weight × sub-score).
- Cash flow +30.0/30.0
- ARV discount +15.0/15.0
- 1% rule +10.0/10.0
- DSCR +10.0/10.0
- Schools +4.7/10.0
- Livability +3.9/5.0
- Rent growth +2.7/5.0
- Condition / age +2.5/5.0
- Appreciation +0.0/10.0
$99,850
🖨 Deal sheet (PDF) 📄 Offer letter ✓ Due diligence
Listing remarks MLS
78 BARRINGTON MANUFHS ON OVERSIZED RIVER FRONT LOT. WRAP AROUND DECK EXTENSIVE REMODEL W/OAK CABINETS,TILE,SLATE ENTRY,MAHOGANT TRIM,MSTR W/ BATH & TUB. CALL DAVE BAKER @ (503)283-4854
Key facts
- Covered deck
- 180 degree view
- Completely remodeled
Tags
Property features AI
Finance
- Financial info: Land lease in effect (land lease expiration: September 16, 2026); lot rent $1,455 monthly
- HOA & community: Community amenities include pool, gym/weight room, basketball court, commons, meeting/party rooms, recreation facilities; association handles water, sewer, and trash; on-site management
Exterior
- Parking: Carport; Driveway; One parking space
- Utilities: Public water; Public sewer; Electric hot water; Electric fuel
- Home design: Manufactured home in park; Residential property; Updated/remodeled condition; Main level living; River view
- Construction: Built in 1978; Metal siding; Composition roof; Crawl space foundation
- Exterior features: Covered deck; Sprinkler system; Tool shed; Yard; Riverfront view (Columbia River)
Interior
- Kitchen: Dishwasher; Disposal; Microwave; Free-standing range; Free-standing refrigerator; Pantry; Updated/remodeled kitchen; Laminate flooring in kitchen
- Bedrooms: Primary bedroom on main (updated/remodeled, includes bathroom); Second bedroom on main with closet organizer
- Flooring: Wall-to-wall carpet in living and bedrooms; Vinyl flooring; Laminate flooring in kitchen
- Bathrooms: Two full bathrooms, both on the main level
- Heating & cooling: Heat pump (heating and cooling)
- Interior features: High ceilings; Vaulted ceilings; Laundry area (washer/dryer included); Accessible approach with ramp; Ground-level and one-level living; Main floor bedroom with bath; Utility room on main; Double-pane windows with vinyl frames; Wall-to-wall carpet; Vinyl flooring; Crawl space basement
- Laundry & utility: Utility room on main (8' x 8') with built-in washer/dryer; Washer/Dryer included
Neighborhood map
What this means for you Summary
Snapshot
- This is a 2-bed/2.0-bath manufactured listed at $100k.
Deal economics
- At list price, monthly cash flow is $1k ($13k/yr) — positive.
- The deal already cash-flows at list — no discount required.
- Meets the 1% rule at list price ($2k rent vs $100k).
- Recommended offer: $98k (1.5% below list) — sets the bar for market timing.
- Cap rate 20.5% vs local median 2.2% in Portland — top-decile yield for the area; either an underpriced asset or a hidden risk that comps aren't pricing in. Stress-test before assuming the spread holds.
Location & tenants
- Location reads 77/100 on livability (#72 in OR, #3,256 nationally) — a middle-class / working-renter tenant base. Strengths: amenities A+, commute A+, health & safety A+; Watch: crime F, cost of living F.
- Portland SD 1J (urban): math 46% / reading 58% proficiency, ranked #23 of 183 in OR (top 13%) — acceptable for families but not a draw, mixed tenant base, ~2y average lease.
- Zoned schools: Faubion Elementary School (610 students, 73% FRL); Da Vinci Middle School (434 students, 34% FRL); Jefferson High School (606 students, 64% FRL) — zoned schools average 57% FRL vs 37% district-wide (20 pts higher); higher-poverty schools than district average — tighter screening recommended.
- Market conditions: Rents flat; 306 active listings in the ZIP; 33 comparable units currently listed for rent nearby; rentals leasing fast (median 0d on market — plan ~1-2 weeks tenant-placement turnaround); solid renter incomes; 2,041 units permitted in Multnomah County in 2024 (905 in 5+ unit buildings).
Forward outlook
- Local home prices are declining (-3.0%/yr); year-one equity from $690 of loan paydown is wiped out by about $3k of value loss. Plan a longer hold.
- Multnomah County population projected at +33% by 2050 — long-run rental-demand tailwind backs the buy-and-hold thesis.
- At projected returns (-3.0% appreciation + 0.9% rent growth), your $28k cash investment doubles in ~3 years — after that, you're playing with house money.
Negotiation context
- It's been on market 22 days — a 2% lower offer ($98k) is reasonable based on typical stale-listing flexibility.
- 2 sale attempts since 28y ago with the ask held roughly flat each time — persistent listings suggest the price (not the market) is what's stuck; bring a comps-based counter.
- Current owner paid $48k; list at $100k implies a 108% gain — meaningful room to come down on a strong offer.
Risks & watch-outs
- Watch-outs: flood insurance adds $66/mo.
- Climate carrying-cost: major flood risk — expect insurance premiums to compound above CPI over the hold.
Questions for the listing agent
- Built in 1978 — when were the roof, HVAC, electrical panel, plumbing, and water heater last replaced?
- What's the actual annual flood-insurance premium (NFIP or private), and is the property in a SFHA with mandatory coverage?
- Is there a deadline driving the sale (1031 exchange, divorce, estate, relocation)? That informs how much negotiation room exists.
- Crime grade is F in this area — have there been break-ins, vandalism, or insurance claims at this property in the last 3 years? What carrier currently insures it and at what premium?
- What's the average days-on-market for RENTAL listings here right now (not sales)? A rising rental-DOM trend means longer vacancies and softer asking-rent achievability than the comps imply.
- What's the recent tenant-quality profile in this submarket — average credit score on applications, eviction rate, late-payment / NSF rate, and stable-employment percentage? A property-management company in the area should have these aggregated.
- How much new for-sale + rental construction is in the pipeline within 1–3 miles? Heavy new supply typically softens prices + rents 12–24 months out; constrained supply supports both.
Investment metrics
- 1% rule
- 2.27% ✓
- Cap rate
- 20.53%
- Cash-on-cash
- 50.85%
- DSCR
- 3.26
- GRM
- 3.7
CMA / ARV
- ARV (median comp)
- $145,314
- List price
- $99,850
- Delta
- -31.29%
- Verdict
- UNDERPRICED
- Comps
- 9 within 1.0 mi
Show comp detail 8 sales within ~0.75 mi
| Address | Dist | Beds/Ba | Sqft | Sold | Price | $/sf | Match |
|---|---|---|---|---|---|---|---|
| 1503 N Hayden Island Dr #232 | 0.25mi | 3/2.0 (+1) | 1,120 (-3%) | 1mo | $165,000 | $147 | 78 |
| 2371 N Menzies Ct | 0.09mi | 3/2.0 (+1) | 1,200 (+4%) | 8mo | $185,000 | $154 | 77 |
| 1503 N Hayden Island Dr #15 | 0.25mi | 3/2.0 (+1) | 1,152 (0%) | 21mo | $137,400 | $119 | 66 |
| 1503 N Hayden Island Dr #242 | 0.25mi | 2/2.0 | 1,200 (+4%) | 22mo | $85,000 | $71 | 63 |
| 1501 N Hayden Island Dr Unit 26a | 0.43mi | 3/2.0 (+1) | 1,109 (-4%) | 12mo | $95,000 | $86 | 59 |
| 1501 N Hayden Island Dr Unit 42B | 0.40mi | 2/2.0 | 1,080 (-6%) | 18mo | $138,500 | $128 | 56 |
| 12335 N South Shore Ave | 0.47mi | 2/2.0 | 1,248 (+8%) | 13mo | $28,500 | $23 | 54 |
| 12452 N Westshore Dr | 0.39mi | 2/2.0 | 1,248 (+8%) | 24mo | $73,000 | $58 | 48 |
Match score weights: distance 35% · size 25% · config 20% · recency 20%. Top-matched comps best support the ARV.
Projected returns pro-forma
-3.0% appreciation · 0.89% rent growth · sell at horizon
- IRR
- 43.1%
- Equity multiple
- 2.80×
- Total profit
- $50,362
- Equity at exit
- $14,888
- IRR
- 48.2%
- Equity multiple
- 5.19×
- Total profit
- $117,145
- Equity at exit
- $8,633
Cash invested: $27,958 (down + closing). Projections, not guarantees.
Landlord ↔ Tenant lean methodology
- Overall (CITY)
- 0 Strongly Tenant-Friendly
- State Oregon
- 28 Tenant-Leaning · D+6
- County
- — inherits STATE
- City Portland
- 0 Strongly Tenant-Friendly · D+39
ZIP-level market 97217
- Rents YoY
- 0.9%
- Active inventory
- 306
- Price-to-rent
- 3.7×
Monthly cashflow live
- Estimated rent
- $2,264 high interval (Pro) →
- Mortgage (P&I)
- −$524
- Tax from tax record
- −$38 /mo · $461/yr
- Insurance
- −$42
- Flood insurance flood zone
- −$66 /mo · $798/yr
- HOA
- −$0
- Vacancy / Maint / Mgmt
- −$475
- Net cashflow
- $1,118
Break-even live
Sensitivity live
| Price | -10% $1,175 | -5% $1,147 | +0% $1,118 | +5% $1,090 | +10% $1,062 |
|---|---|---|---|---|---|
| Rent | -10% $939 | -5% $1,029 | +0% $1,118 | +5% $1,208 | +10% $1,297 |
| Rate | -1.0pp $1,169 | -0.5pp $1,144 | base $1,118 | +0.5pp $1,092 | +1.0pp $1,066 |
UW: 25.0% down · 7.5% · 30yr · 1.5% tax · 5.0% vac · 8.0% maint · 8.0% mgmt
Financing live
Cash to close
- Down payment
- $24,962
- Closing costs
- $2,996
- Reserves months
- —
- Total cash needed
- —
Loan-product check · same deal, 3 products live
Conventional
25% down · 7.5% · 30yr
- Down + closing
- —
- Monthly P&I
- —
- Monthly cashflow
- —
- DSCR
- —
- Eligible?
- —
Personal DTI + credit; lowest rate.
DSCR
20% down · 8.5% · 30yr
- Down + closing
- —
- Monthly P&I
- —
- Monthly cashflow
- —
- DSCR
- —
- Eligible?
- —
No personal income docs; deal must DSCR.
Hard money
10% down · 12.0% · 12mo
- Down + closing
- —
- Monthly P&I
- —
- Monthly cashflow
- —
- DSCR
- —
- Eligible?
- —
Short-term bridge; refi at stabilization.
Rent comps 33 comps
| Address | Beds | Baths | Sqft | Rent | $/sqft | DOM | Units | Dist |
|---|---|---|---|---|---|---|---|---|
| 1111 W Columbia Way Vancouver, WA | 2.0 | 1.0–2.5 | 857 | $4,800 | $5.60 | 0d | 25 | 0.43mi |
| 1110 W Columbia Way Vancouver, WA | 2.0 | 1.0–2.0 | 783 | $3,849 | $4.91 | 0d | 10 | 0.46mi |
| 1000 W Columbia Way Vancouver, WA | 1.0–2.0 | 1.0–2.0 | 835 | $3,282 | $3.93 | 0d | 13 | 0.50mi |
| 111 Parkway Pl Vancouver, WA | 1.0–2.0 | 1.0–2.0 | 983 | $4,995 | $5.08 | 0d | 3 | 0.51mi |
| 500 W Columbia Way Vancouver, WA | 2.0 | 1.0–2.0 | 849 | $3,995 | $4.71 | 0d | 7 | 0.58mi |
| 440 W Columbia Way Vancouver, WA | 2.0 | 1.0–2.0 | 863 | $4,682 | $5.43 | 0d | 149 | 0.60mi |
| 636 W 6th St Vancouver, WA | 1.0 | 1.0 | 707 | $1,961 | $2.77 | 0d | 8 | 0.65mi |
| 555 W 8th St Vancouver, WA | 1.0–2.0 | 1.0 | 695 | $1,630 | $2.35 | 3d | 11 | 0.72mi |
| 411 Columbia St Vancouver, WA | 2.0 | 1.0–2.0 | 836 | $3,377 | $4.04 | 0d | 15 | 0.76mi |
| 300 W 8th St Vancouver, WA | 1.0–2.0 | 1.0–2.0 | 915 | $2,932 | $3.20 | 0d | 1 | 0.83mi |
| 608 Washington St Vancouver, WA | 2.0 | 1.0–2.0 | 903 | $3,236 | $3.58 | 0d | 8 | 0.84mi |
| 701 Columbia St #107 Vancouver, WA | 2.0 | 2.0 | 871 | $1,995 | $2.29 | 25d | 1 | 0.85mi |
| 1614 Kauffman Ave Vancouver, WA | 3.0 | 1.0 | 1200 | $2,150 | $1.79 | 25d | 1 | 1.01mi |
| 410 W Mill Plain Blvd Vancouver, WA | 2.0 | 1.0–2.0 | 713 | $1,646 | $2.31 | 0d | 6 | 1.07mi |
| 183 N Hayden Bay Dr Portland, OR | 1.0 | 1.0 | 858 | $1,800 | $2.10 | 45d | 1 | 1.08mi |
| 1245 N Anchor Way Portland, OR | 2.0 | 1.0–2.0 | 868 | $2,250 | $2.59 | 0d | 15 | 1.11mi |
| 1601 Esther St Unit 1601 Vancouver, WA | 3.0 | 2.0 | 1248 | $2,499 | $2.00 | 25d | 1 | 1.11mi |
| 1601 Esther St Vancouver, WA | 3.0 | 2.0 | 1248 | $2,499 | $2.00 | 0d | 1 | 1.11mi |
| 123 N Hayden Bay Dr Portland, OR | 2.0 | 1.0 | 889 | $2,249 | $2.53 | 45d | 1 | 1.12mi |
| 609 W McLoughlin Blvd Vancouver, WA | 2.0 | 1.0 | 752 | $1,795 | $2.39 | 4d | 1 | 1.12mi |
| 1055 N Anchor Way Portland, OR | 1.0–2.0 | 1.0–2.0 | 1056 | $3,150 | $2.98 | 0d | 35 | 1.19mi |
| 300 E 13th St Vancouver, WA | 2.0 | 1.0–2.0 | 733 | $2,100 | $2.86 | 0d | 8 | 1.21mi |
| 1818 W 22nd St Vancouver, WA | 2.0 | 1.0 | 957 | $2,195 | $2.29 | 0d | 1 | 1.24mi |
| 1818 W 22nd St Vancouver, WA | 2.0 | 1.0 | 957 | $2,195 | $2.29 | 23d | 1 | 1.24mi |
| 904 W 21st St Vancouver, WA | 2.0 | 1.0 | 782 | $1,495 | $1.91 | 25d | 1 | 1.26mi |
| 1700 Main St Vancouver, WA | 2.0 | 1.0–2.0 | 834 | $2,290 | $2.74 | 0d | 11 | 1.26mi |
| 910 N Harbour Dr Portland, OR | 1.0–2.0 | 1.0–2.0 | 1002 | $1,949 | $1.94 | 0d | 3 | 1.29mi |
| 995 N Marine Dr Portland, OR | 2.0 | 1.0–2.0 | 924 | $2,036 | $2.20 | 0d | 11 | 1.31mi |
| 1655 C St Vancouver, WA | 1.0 | 1.0 | 736 | $1,549 | $2.10 | 0d | 2 | 1.32mi |
| 1660 D St Vancouver, WA | 2.0–3.0 | 1.0–2.0 | 820 | $1,525 | $1.86 | 9d | 3 | 1.33mi |
| 1600 E St Vancouver, WA | 1.0–2.0 | 1.5–2.0 | 946 | $2,275 | $2.40 | 16d | 5 | 1.37mi |
| 110 N Tomahawk Island Dr Portland, OR | 1.0–2.0 | 1.0–2.0 | 994 | $2,674 | $2.69 | 0d | 25 | 1.43mi |
| 2515 Harney St Vancouver, WA | 2.0 | 1.0 | 900 | $1,745 | $1.94 | 19d | 1 | 1.45mi |
Listing history 6 events
-
2026-06-02statusdays on market $99,850 Pending 22 DOM
-
2026-06-01days on market $99,850 Active 21 DOM
-
2026-05-31days on market $99,850 Active 20 DOM
-
2026-05-11$99,850 Active 1345-char remark
-
1998-11-12soldstatus $47,900 188-char remark
Show marketing remark (188 chars)
78 BARRINGTON MANUFHS ON OVERSIZED RIVER FRONT LOT. WRAP AROUND DECK EXTENSIVE REMODEL W/OAK CABINETS,TILE,SLATE ENTRY,MAHOGANT TRIM,MSTR W/ BATH & TUB. CALL DAVE BAKER @ (503)283-4854
-
1998-06-03$52,900 188-char remark
Show marketing remark (188 chars)
78 BARRINGTON MANUFHS ON OVERSIZED RIVER FRONT LOT. WRAP AROUND DECK EXTENSIVE REMODEL W/OAK CABINETS,TILE,SLATE ENTRY,MAHOGANT TRIM,MSTR W/ BATH & TUB. CALL DAVE BAKER @ (503)283-4854
ⓘ Source: listings_history table (triggers on properties + properties_extension) + one-shot
backfill from property_details.listing_events for pre-trigger history.
Tax reassessment forecast OR · Resets to sale price
- Current annual tax
- $461 · $38/mo
- Projected year-2 tax
- $969 · $81/mo
- Expected delta
- +$508/yr (+$42/mo · 110.1%)
ⓘ Screening estimate from a state-policy table — verify with the county assessor before closing.
Climate risk First Street
- Flood 7/10 Severe FEMA zone X (unshaded) · 77% chance over 30 yrs
- Wildfire 1/10 Low
- Heat 3/10 Moderate 7 d/yr ≥92°F today · 14 d/yr by 30 yrs out
- Wind 1/10 Low
- Air quality 10/10 Extreme 19 unhealthy d/yr today · 20 by 30 yrs out
Nearby sold comps map
Loading sold comps map…
Walkable amenities ~0.75 mi
Loading nearby amenities…
Taxation est. · year 1
- Rental income
- $27,166
- − Mortgage interest
- −$5,593
- − Property taxes
- −$461
- − Insurance
- −$1,297
- − Repairs & maintenance
- −$2,173
- − Management
- −$2,173
- − Depreciation
- −$2,905
- Taxable income
- $12,564
- Est. tax owed @ 24.0%
- −$3,015
- After-tax cash flow
- $10,405/yr
For passive investors: Depreciation is non-cash, so a rental often shows a tax loss while cash-flowing — sheltering income. Rental losses are passive: they offset passive income freely, and up to $25,000/yr can offset ordinary (W-2) income if you actively participate and your MAGI is under $100k (phasing out to $0 by $150k); unused losses carry forward. On sale, claimed depreciation is recaptured at up to 25%, and gains may owe capital-gains tax (a 1031 exchange can defer both). Figures are a year-1 estimate at your 24.0% rate — not tax advice; consult a CPA.
Schools (NCES district)
- District
- Portland SD 1J
- NCES district ID
- 4110040
- Math proficiency
- 46% ▼ -2.00%
- Reading proficiency
- 58% ▼ -3.00%
- Median HH income
- $57,851
- Composite
- 47.1/100
- National rank
- #5112
- State rank
- #23 of 183 in OR
Livability — Portland
- Score
- 77/100
- State rank
- #72
- US rank
- #3256
Category grades
Schools grade is shown separately in the Schools card above.
Census & demographics
- Census place
- Portland, OR
- County
- Multnomah County · 786,692 people
- City population
- 774,334
- Metro
- Portland-Vancouver-Hillsboro, OR-WA
- Population (ZIP)
- 35,169
- Household income
- $100,361
- Rent vs Own
- Severe rent burden
- 1532.0
Population outlook (Multnomah County) Hauer SSP2
- Today (2025)
- 930,825 people
- By 2030
- 996,904 · +7.1%
- By 2040
- 1,121,379 · +20.5%
- By 2050
- 1,242,124 · +33.4%
- By 2075
- 1,464,431 · +57.3%
- By 2100
- 1,576,181 · +69.3%
Race, ethnicity, and origin ACS 2023
- Neighborhood character
- Predominantly White (71%)
- Race & ethnicity
- White 71% Two or more races 12% Hispanic / Latino 9% Black 7% Asian 3%
- Hispanic origin (detail)
- Mexican 5%
- Common ancestry
- Italian 5% Slovak 4% Portuguese 3%
- Foreign-born
- 8% · Canada, China, Vietnam
- Languages at home
- 90% English-only · Spanish 4% Other Indo-European 1% Chinese 1%
Political lean MEDSL · Multnomah
- 2024 margin
- Solid D (+62.1) · D 79.3% · R 17.2% · Other 3.5%
- 2008→2024 swing
- +6.0pp toward D · 2008: 56.1pp · 2024: 62.1pp
- All cycles
- 2024: D+62.1 2020: D+61.3 2016: D+58.3 2012: D+54.9 2008: D+56.1
Not yet ingested
- Civics
- —
Market trends
- HPI YoY
- ▼ -747.13%
- Current HPI
- 370.7526
- Rent YoY
- ▲ 0.89%
- Metro
- Portland-Vancouver-Hillsboro, OR-WA
- State GDP YoY
- ▲ 2.05%
- F500 in state
- 2
Industry mix (Fortune 500 HQ in OR)
| Industry | F500 HQs | Revenue |
|---|---|---|
| Consumer Goods | 1 | $51B |
|
||
Price history
+88.8% since first listed4 events — show timeline
- 2026-06-02 Pending — RMLS
- 2026-05-11 Listed $99,850 RMLS
- 1998-11-12 Sold (MLS) $47,900 RMLS
- 1998-06-03 Listed $52,900 RMLS
Property tax history
+28.8%/yrLatest (2016): $461 · +14.4% YoY. Source: county tax records.
Cash-flow waterfall
monthlySold comps — $/sqft
last 12 mo · ≤1 miLoading sold comps…