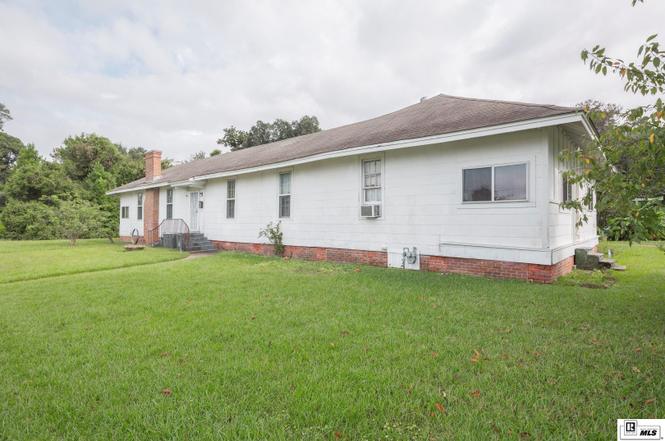
100 Rochelle Ave · Monroe, LA
Flood risk 1/10 · Minimal
- FEMA flood zone
- X (shaded)
- Chance of flooding over 30 yrs
- 0.0%
- Est. flood insurance / yr
- $507 – $1,088
Fire risk 1/10 · Minimal
- Est. fire insurance / yr
- $1,269 – $2,357
Heat risk 7/10 · Major
- Hot days now (above 112°F)
- 7 days/yr
- Hot days in 30 yrs
- 20 days/yr
Wind risk 7/10 · Major
- Chance of severe wind over 30 yrs
- 76.0%
Air-quality risk 1/10 · Minimal
- Unhealthy air days now
- 0 days/yr
- Unhealthy air days in 30 yrs
- 0 days/yr
Risk factors via First Street. Map © Google.
Why this score? — see what drove the D grade
The composite is a weighted blend of 9 inputs, each scored 0–100. Each bar is that input's sub-score; the figure is the points it added to the 100-point composite (weight × sub-score).
- Cash flow +14.6/30.0
- ARV discount +7.5/15.0
- DSCR +4.4/10.0
- 1% rule +3.8/10.0
- Livability +3.3/5.0
- Rent growth +2.5/5.0
- Condition / age +2.5/5.0
- Schools +2.1/10.0
- Appreciation +0.0/10.0
$150,000
🖨 Deal sheet 📄 Offer letter ✓ Due diligence
Listing remarks
Sitting on the corner of Riverside and Rochelle, this spacious property is full of potential and ready for a fresh vision. With 5 bedrooms and 2 baths spread over 2,820 heated square feet, there’s plenty of room to reimagine and make it your own. The layout includes a large living room and several bonus spaces that could easily be transformed into offices, a playroom, or extra living areas — whatever fits your lifestyle best. Out back, you’ll find a fenced yard and a covered patio, perfect for relaxing or entertaining once polished up. And that’s not all — there’s also a separate, retro apartment that’s absolutely brimming with charm and possibility
Key facts
- Bonus spaces
- Fenced yard
- Covered patio
Tags
Property features AI
Finance
- Other: Zoned residential
- HOA & community: No association amenities
Exterior
- Parking: Gravel parking; Detached garage with 1-car capacity
- Security: Security system; Accessible entrance
- Utilities: Public water; Public sewer; Natural gas available
- Home design: Single-family residence; One story (entry level: 1); Site-built home
- Construction: Frame construction; Asphalt roof; Pillar/post/pier foundation
- Exterior features: Covered patio/porch; Landscaped yard; Corner lot; Paved road access; Fenced (other type)
Interior
- Kitchen: Gas water heater
- Bedrooms: Four main-level bedrooms
- Bathrooms: Two full bathrooms
- Heating & cooling: Wall furnace heating; Ceiling fans and wall/window air conditioning units
- Interior features: Ceiling fans; Two gas-log fireplaces
Neighborhood map
What this means for you Summary
Snapshot
- This is a 2-bed/1.0-bath single-family listed at $150k.
Deal economics
- At list price, monthly cash flow is $35 ($420/yr) — positive.
- The deal already cash-flows at list — no discount required.
- To meet the 1% rule (rent ≥ 1% of price), the offer needs to be $132k (12.0% below list).
- Recommended offer: $132k (12.0% below list) — sets the bar for 1% rule.
Location & tenants
- Location reads 66/100 on livability (#128 in LA) — a middle-class / working-renter tenant base. Strengths: cost of living A+, health & safety A+; Watch: crime F, amenities F, commute F.
- City Of Monroe School District (urban): math 21% / reading 31% proficiency, ranked #60 of 98 in LA (top 61%) — low school quality limits family demand, transient renter base, plan for 1-2y turnover; 82% free/reduced lunch — lower-income household profile, screen leases tightly.
- Zoned schools: Neville Junior High School (math 29% / reading 53%, grade F, #61 of 218 statewide, top 28%, 480 students, 58% FRL) — zoned schools average 58% FRL vs 82% district-wide (23 pts lower); this property's tenant base skews higher-income than the district average.
- Zoned-school proficiency averages 41% at this address vs 26% district-wide (+15 pts) — the actual schools serving this property are materially stronger than the City Of Monroe School District average implies; a family-tenant draw the district grade alone would hide.
- Market conditions: 142 active listings in the ZIP; 5 comparable units currently listed for rent nearby; rentals at typical pace (median 21d on market — plan ~3-4 weeks tenant-placement turnaround); 40% of comp listings sitting > 30 days — soft ceiling on asking rent; 345 units permitted in Ouachita Parish in 2024 (0 in 5+ unit buildings).
Forward outlook
- Local home prices are declining (-3.0%/yr); year-one equity from $1k of loan paydown is wiped out by about $4k of value loss. Plan a longer hold.
Negotiation context
- It's been on market 229 days — a 12% lower offer ($132k) is reasonable based on typical stale-listing flexibility.
Risks & watch-outs
- Watch-outs: built in 1930 — expect roof / HVAC / electrical / plumbing capex.
- Climate carrying-cost: major wind risk, 76% chance of damaging wind over 30y; extreme-heat days projected 7→20/yr by 2055 (HVAC capex compounding) — expect insurance premiums to compound above CPI over the hold.
Questions for the listing agent
- It's been on market 229 days. Have you received any prior offers? Is the seller open to a 12% concession, seller financing, or rate buy-down credit?
- Built in 1930 — when were the roof, HVAC, electrical panel, plumbing, and water heater last replaced?
- Why hasn't it sold? Are there any deal-killer items the seller is aware of (foundation, flood, title, zoning, code violations)?
- Is there a deadline driving the sale (1031 exchange, divorce, estate, relocation)? That informs how much negotiation room exists.
- Crime grade is F in this area — have there been break-ins, vandalism, or insurance claims at this property in the last 3 years? What carrier currently insures it and at what premium?
- The area grade is low — what's the realistic commute time and amenity access for the typical tenant pool here? Any planned neighborhood developments (good or bad) we should know about?
- What's the average days-on-market for RENTAL listings here right now (not sales)? A rising rental-DOM trend means longer vacancies and softer asking-rent achievability than the comps imply.
- What's the recent tenant-quality profile in this submarket — average credit score on applications, eviction rate, late-payment / NSF rate, and stable-employment percentage? A property-management company in the area should have these aggregated.
- How much new for-sale + rental construction is in the pipeline within 1–3 miles? Heavy new supply typically softens prices + rents 12–24 months out; constrained supply supports both.
Investment metrics
- 1% rule
- 0.88% ✗
- Cap rate
- 6.57%
- Cash-on-cash
- 1.00%
- DSCR
- 1.04
- GRM
- 9.5
CMA / ARV
- ARV (on-the-fly)
- $66,912
- Comps found
- 1
Show comp detail 1 sale within ~0.75 mi
| Address | Dist | Beds/Ba | Sqft | Sold | Price | $/sf | Match |
|---|---|---|---|---|---|---|---|
| 208 Conella St | 0.72mi | 2/1.0 | 832 (+2%) | 2mo | $68,500 | $82 | 62 |
Match score weights: distance 35% · size 25% · config 20% · recency 20%. Top-matched comps best support the ARV.
Projected returns pro-forma
-3.0% appreciation · 3.0% rent growth · sell at horizon
- IRR
- -14.7%
- Equity multiple
- 0.47×
- Total profit
- $-22,076
- Equity at exit
- $22,365
- IRR
- -6.0%
- Equity multiple
- 0.61×
- Total profit
- $-16,345
- Equity at exit
- $12,969
Cash invested: $42,000 (down + closing). Projections, not guarantees.
Landlord ↔ Tenant lean methodology
- Overall (STATE)
- 90 Strongly Landlord-Friendly
- State Louisiana
- 90 Strongly Landlord-Friendly · R+12
- County
- — inherits STATE
- City
- — inherits STATE
ZIP-level market 71201
- Home prices YoY
- -31.9%
- Active inventory
- 142
- Price-to-rent
- 9.5×
Monthly cashflow live
- Estimated rent
- $1,320 high interval (Pro) →
- Mortgage (P&I)
- −$787
- Tax from tax record
- −$159 /mo · $1,903/yr
- Insurance
- −$62
- HOA
- −$0
- Vacancy / Maint / Mgmt
- −$277
- Net cashflow
- $35
Break-even live
UW: 25.0% down · 7.5% · 30yr · 1.5% tax · 5.0% vac · 8.0% maint · 8.0% mgmt
Financing live
Cash to close
- Down payment
- $37,500
- Closing costs
- $4,500
- Reserves months
- —
- Total cash needed
- —
Loan-product check · same deal, 3 products live
Conventional
25% down · 7.5% · 30yr
- Down + closing
- —
- Monthly P&I
- —
- Monthly cashflow
- —
- DSCR
- —
- Eligible?
- —
Personal DTI + credit; lowest rate.
DSCR
20% down · 8.5% · 30yr
- Down + closing
- —
- Monthly P&I
- —
- Monthly cashflow
- —
- DSCR
- —
- Eligible?
- —
No personal income docs; deal must DSCR.
Hard money
10% down · 12.0% · 12mo
- Down + closing
- —
- Monthly P&I
- —
- Monthly cashflow
- —
- DSCR
- —
- Eligible?
- —
Short-term bridge; refi at stabilization.
Rent comps 5 comps
| Address | Beds | Baths | Sqft | Rent | $/sqft | DOM | Units | Dist |
|---|---|---|---|---|---|---|---|---|
| 1107 N 2nd St Unit B Monroe, LA | 1.0 | 1.0 | 847 | $850 | $1.00 | 20d | 1 | 0.33mi |
| 220 Drew Ave West Monroe, LA | 3.0 | 1.0 | 900 | $1,525 | $1.69 | 20d | 1 | 0.52mi |
| 110 Pine St Unit 12 West Monroe, LA | 2.0 | 2.0 | 1000 | $2,400 | $2.40 | 43d | 1 | 0.78mi |
| 2417 N 9th St West Monroe, LA | 2.0 | 1.0 | 900 | $2,000 | $2.22 | 43d | 1 | 1.40mi |
| 411 Filhiol Ave West Monroe, LA | 2.0 | 1.0 | 782 | $875 | $1.12 | 20d | 1 | 1.42mi |
Listing history 9 events
-
2026-06-05statusdays on market $150,000 Pending 229 DOM
-
2026-06-02days on market $150,000 Active 228 DOM
-
2026-06-01days on market $150,000 Active 227 DOM
-
2026-05-31days on market $150,000 Active 226 DOM
-
2026-05-30days on market $150,000 Active 225 DOM
-
2026-05-07price $150,000
-
2026-04-07price $174,000
-
2026-01-08price $194,000
-
2025-10-17$214,500 Active
ⓘ Source: listings_history table (triggers on properties + properties_extension) + one-shot
backfill from property_details.listing_events for pre-trigger history.
Tax reassessment forecast LA · Resets to sale price
- Current annual tax
- $1,903 · $159/mo
- Projected year-2 tax
- $1,903 · $159/mo
- Expected delta
- $0/yr ($0/mo · 0.0%)
ⓘ Screening estimate from a state-policy table — verify with the county assessor before closing.
Climate risk First Street
- Flood 1/10 Low FEMA zone X (shaded) · 0% chance over 30 yrs
- Wildfire 1/10 Low
- Heat 7/10 Severe 7 d/yr ≥112°F today · 20 d/yr by 30 yrs out
- Wind 7/10 Severe 76% chance of damaging wind over 30 yrs
- Air quality 1/10 Low 0 unhealthy d/yr today · 0 by 30 yrs out
Nearby sold comps map
Loading sold comps map…
Walkable amenities ~0.75 mi
Loading nearby amenities…
Taxation est. · year 1
- Rental income
- $15,838
- − Mortgage interest
- −$8,402
- − Property taxes
- −$1,903
- − Insurance
- −$750
- − Repairs & maintenance
- −$1,267
- − Management
- −$1,267
- − Depreciation
- −$4,364
- Taxable loss
- −$2,115
- Est. tax savings @ 24.0%
- +$508
- After-tax cash flow
- $927/yr
For passive investors: Depreciation is non-cash, so a rental often shows a tax loss while cash-flowing — sheltering income. Rental losses are passive: they offset passive income freely, and up to $25,000/yr can offset ordinary (W-2) income if you actively participate and your MAGI is under $100k (phasing out to $0 by $150k); unused losses carry forward. On sale, claimed depreciation is recaptured at up to 25%, and gains may owe capital-gains tax (a 1031 exchange can defer both). Figures are a year-1 estimate at your 24.0% rate — not tax advice; consult a CPA.
Schools (NCES district)
- District
- City Of Monroe School District
- NCES district ID
- 2201080
- Math proficiency
- 21% ▼ -36.00%
- Reading proficiency
- 31% ▼ -34.00%
- Median HH income
- $28,751
- Composite
- 20.82/100
- National rank
- #8505
- State rank
- #60 of 98 in LA
Livability — Monroe
- Score
- 66/100
- State rank
- #128
- US rank
- #11948
Category grades
Schools grade is shown separately in the Schools card above.
Census & demographics
- Census place
- Monroe, LA
- County
- Ouachita Parish · 118,340 people
- City population
- 60,136
- Metro
- Monroe, LA
- Population (ZIP)
- 21,782
- Household income
- $65,446
- Rent vs Own
- Severe rent burden
- 1466.0
Population outlook (Ouachita County) Hauer SSP2
- Today (2025)
- 163,370 people
- By 2030
- 165,520 · +1.3%
- By 2040
- 167,652 · +2.6%
- By 2050
- 166,699 · +2.0%
- By 2075
- 156,348 · -4.3%
- By 2100
- 134,102 · -17.9%
Race, ethnicity, and origin ACS 2023
- Neighborhood character
- Diverse neighborhood (Simpson 0.55)
- Race & ethnicity
- White 57% Black 35% Two or more races 3% Hispanic / Latino 3% Asian 2%
- Common ancestry
- Lithuanian 3% Slovak 2% Italian 1%
- Foreign-born
- 3% · Vietnam
- Languages at home
- 95% English-only · Spanish 3% Other Indo-European 1% Arabic 1%
Political lean MEDSL · Ouachita
- 2024 margin
- Strong R (+27.9) · D 35.5% · R 63.3% · Other 1.2%
- 2008→2024 swing
- -2.7pp toward R · 2008: -25.2pp · 2024: -27.9pp
- All cycles
- 2024: R+27.9 2020: R+23.6 2016: R+25.4 2012: R+20.9 2008: R+25.2
Not yet ingested
- Civics
- —
Market trends
- HPI YoY
- ▼ -92.35%
- Current HPI
- 196.7468
- Rent YoY
- —
- Metro
- Monroe, LA
- State GDP YoY
- ▲ 3.29%
- F500 in state
- 10
Industry mix (Fortune 500 HQ in LA)
| Industry | F500 HQs | Revenue |
|---|---|---|
| Telecommunications | 2 | $23B |
|
||
| Utilities | 1 | $12B |
|
||
| Wholesale / Distribution | 1 | $5B |
|
||
| Advertising | 1 | $2B |
|
||
Price history
-30.1% since first listed4 events — show timeline
- 2026-05-07 Price Changed $150,000 NELABOR
- 2026-04-07 Price Changed $174,000 NELABOR
- 2026-01-08 Price Changed $194,000 NELABOR
- 2025-10-17 Listed $214,500 NELABOR
Property tax history
+4.8%/yrLatest (2025): $1,903 · -0.1% YoY. Source: county tax records.
Cash-flow waterfall
monthlySold comps — $/sqft
last 12 mo · ≤1 miLoading sold comps…