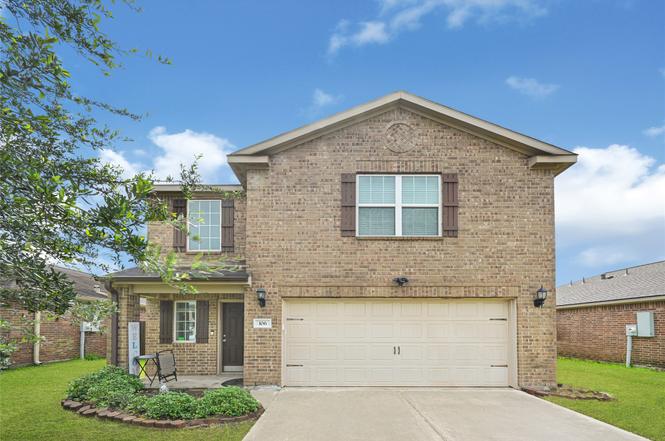
106 Mojave Ln · La Marque, TX
Flood risk 4/10 · Minor
- FEMA flood zone
- X (unshaded)
- Chance of flooding over 30 yrs
- 0.2%
- Est. flood insurance / yr
- $507 – $1,088
Fire risk 3/10 · Minor
- Est. fire insurance / yr
- $1,222 – $2,270
Heat risk 10/10 · Severe
- Hot days now (above 110°F)
- 7 days/yr
- Hot days in 30 yrs
- 28 days/yr
Wind risk 9/10 · Severe
- Chance of severe wind over 30 yrs
- 99.0%
Air-quality risk 3/10 · Minor
- Unhealthy air days now
- 2 days/yr
- Unhealthy air days in 30 yrs
- 2 days/yr
Risk factors via First Street. Map © Google.
Why this score? — see what drove the D grade
The composite is a weighted blend of 9 inputs, each scored 0–100. Each bar is that input's sub-score; the figure is the points it added to the 100-point composite (weight × sub-score).
- Cash flow +12.8/30.0
- ARV discount +10.7/15.0
- 1% rule +4.3/10.0
- DSCR +3.8/10.0
- Rent growth +3.5/5.0
- Schools +3.5/10.0
- Livability +3.0/5.0
- Condition / age +2.5/5.0
- Appreciation +0.0/10.0
$248,999
🖨 Deal sheet (PDF) 📄 Offer letter ✓ Due diligence
Listing remarks
Single-family home located in La Marque featuring 3 bedrooms, 2 full baths, 1 half bath, and approximately 1,719 sq. ft. of living space. The home offers a functional two-story layout with an attached garage, fenced backyard, and a manageable lot size of approximately 5,488 sq. ft. Located in a community-friendly neighborhood with nearby dog walking park access and convenient access to I-45, shopping, dining, and area amenities. Home also features a Rheem A/C unit. Buyer to independently verify room dimensions, square footage, schools, taxes, HOA, and all property information.
Key facts
- 5,488 sq ft lot
- 2 garage spots
- Built 2015
Property features AI
Finance
- HOA & community: Community managed by Inframark Community Management
Exterior
- Parking: Attached garage (2 spaces)
- Security: Prewired security
- Utilities: Public water; Public sewer
- Home design: Residential property; Faces north; Single-story entry (first-floor living implied)
- Construction: Built in 2015; Brick construction; Slab foundation
- Exterior features: Deck; Patio; Porch; Fully fenced yard with backyard fencing; Private yard; Sprinkler/irrigation; Paved driveway; Backs to greenbelt/park; Subdivision setting
Interior
- Kitchen: Double oven; Electric cooktop; Electric oven; Electric range; Disposal; Microwave; Refrigerator; Granite counters; Breakfast bar
- Bedrooms: Primary bedroom on the first floor (16 x 12); Bedroom on the first floor (12 x 11); Bedroom on the first floor (11 x 11)
- Flooring: Carpet; Tile
- Bathrooms: 2 full bathrooms; 1 half bathroom
- Heating & cooling: Central heating (electric); Central air conditioning; Gas-powered cooling
- Interior features: Breakfast bar; Granite counters; High ceilings; Vaulted ceiling(s); Separate shower; Stove fireplace (1)
- Laundry & utility: Electric dryer hookup
Neighborhood map
What this means for you Summary
Snapshot
- This is a 3-bed/2.5-bath single-family listed at $249k.
Deal economics
- At list price, monthly cash flow is $-25 ($-298/yr) — negative.
- To cash-flow at today's rent, offer at most $245k (1.8% below list).
- To meet the 1% rule (rent ≥ 1% of price), the offer needs to be $230k (7.5% below list).
- Recommended offer: $230k (7.5% below list) — sets the bar for 1% rule.
Location & tenants
- Location reads 59/100 on livability (#1,136 in TX) — a working-class tenant base; expect higher turnover. Strengths: cost of living A+, housing A+; Watch: employment D, crime F, amenities F.
- Santa Fe ISD (suburban): math 38% / reading 39% proficiency, ranked #385 of 826 in TX (top 47%) — families likely to look elsewhere, expect single-tenant / working-renter base with shorter leases.
- Zoned schools: William F Barnett El (math 59% / reading 46%, grade C-, #720 of 4,322 statewide, top 17%, 646 students, 59% FRL); Santa Fe J H (math 34% / reading 37%, grade F, #827 of 1,662 statewide, top 51%, 1,009 students, 52% FRL); Santa Fe H S (math 19% / reading 34%, grade F, #1,228 of 1,632 statewide, top 76%, 1,369 students, 47% FRL) — zoned schools average 53% FRL vs 35% district-wide (17 pts higher); higher-poverty schools than district average — tighter screening recommended.
- Market conditions: Rents rising (+4.0%/yr); 661 active listings in the ZIP; 7 comparable units currently listed for rent nearby; rentals leasing fast (median 7d on market — plan ~1-2 weeks tenant-placement turnaround); 3,258 units permitted in Galveston County in 2024 (0 in 5+ unit buildings).
- This rent runs 37% of the median local income ($75k/yr) — at the standard rent-burdened threshold; future hikes will face affordability resistance.
Forward outlook
- Local home prices are declining (-3.0%/yr); year-one equity from $2k of loan paydown is wiped out by about $7k of value loss. Plan a longer hold.
- Galveston County population projected at +43% by 2050 — long-run rental-demand tailwind backs the buy-and-hold thesis.
Negotiation context
- Only 1 days on market — expect competitive offers; lowballing is unlikely to land.
- 7 sale attempts since 10y ago with the ask held roughly flat each time — persistent listings suggest the price (not the market) is what's stuck; bring a comps-based counter.
Risks & watch-outs
- Climate carrying-cost: severe wind risk, 99% chance of damaging wind over 30y; extreme-heat days projected 7→28/yr by 2055 (HVAC capex compounding) — expect insurance premiums to compound above CPI over the hold.
Questions for the listing agent
- What do current leases actually rent for vs. the listed asking? Can we see a recent rent roll and the last 12 months of T-12 income?
- Is there a deadline driving the sale (1031 exchange, divorce, estate, relocation)? That informs how much negotiation room exists.
- Schools are F-rated, which usually means shorter tenancies and higher turnover. Who's the typical renter profile here, and what's been the actual vacancy rate?
- Crime grade is F in this area — have there been break-ins, vandalism, or insurance claims at this property in the last 3 years? What carrier currently insures it and at what premium?
- The area grade is low — what's the realistic commute time and amenity access for the typical tenant pool here? Any planned neighborhood developments (good or bad) we should know about?
- What's the average days-on-market for RENTAL listings here right now (not sales)? A rising rental-DOM trend means longer vacancies and softer asking-rent achievability than the comps imply.
- What's the recent tenant-quality profile in this submarket — average credit score on applications, eviction rate, late-payment / NSF rate, and stable-employment percentage? A property-management company in the area should have these aggregated.
- How much new for-sale + rental construction is in the pipeline within 1–3 miles? Heavy new supply typically softens prices + rents 12–24 months out; constrained supply supports both.
Investment metrics
- 1% rule
- 0.93% ✗
- Cap rate
- 6.17%
- Cash-on-cash
- -0.43%
- DSCR
- 0.98
- GRM
- 9.0
CMA / ARV
- ARV (on-the-fly)
- $268,164
- Comps found
- 12
Show comp detail 12 sales within ~0.75 mi
| Address | Dist | Beds/Ba | Sqft | Sold | Price | $/sf | Match |
|---|---|---|---|---|---|---|---|
| 109 Indigo Brush Dr | 0.02mi | 3/2.5 | 1,719 (0%) | 4mo | $235,000 | $137 | 96 |
| 12609 Pirate Bend Dr | 0.31mi | 3/2.0 | 1,720 (+0%) | 5mo | $265,000 | $154 | 79 |
| 2317 Nautica Terrace Dr | 0.41mi | 3/2.0 | 1,666 (-3%) | 1mo | $242,500 | $146 | 73 |
| 2315 Oyster Bay Ave | 0.42mi | 3/2.5 | 1,615 (-6%) | 3mo | $250,000 | $155 | 68 |
| 6 Prairie Oaks Dr | 0.32mi | 3/2.0 | 1,860 (+8%) | 4mo | $295,000 | $159 | 66 |
| 2210 Mirror Ridge Ct | 0.29mi | 4/2.0 (+1) | 1,831 (+6%) | 5mo | $299,990 | $164 | 64 |
| 211 Hawks View Dr | 0.29mi | 4/2.0 (+1) | 1,875 (+9%) | 1mo | $267,500 | $143 | 64 |
| 12801 Pirate Bend Dr | 0.29mi | 3/2.0 | 1,535 (-11%) | 4mo | $264,000 | $172 | 64 |
| 2322 Nautica Terrace Dr | 0.43mi | 3/2.0 | 1,575 (-8%) | 1mo | $250,000 | $159 | 63 |
| 2215 Manta Way | 0.43mi | 3/2.0 | 1,575 (-8%) | 1mo | $245,000 | $156 | 63 |
| 13137 Leisure Cove Dr | 0.59mi | 4/2.5 (+1) | 1,785 (+4%) | 2mo | $309,900 | $174 | 60 |
| 225 Splintered Arrow Dr | 0.21mi | 4/2.0 (+1) | 1,967 (+14%) | 3mo | $270,000 | $137 | 57 |
Match score weights: distance 35% · size 25% · config 20% · recency 20%. Top-matched comps best support the ARV.
Projected returns pro-forma
-3.0% appreciation · 3.95% rent growth · sell at horizon
- IRR
- -15.8%
- Equity multiple
- 0.43×
- Total profit
- $-39,597
- Equity at exit
- $37,127
- IRR
- -5.7%
- Equity multiple
- 0.62×
- Total profit
- $-26,767
- Equity at exit
- $21,529
Cash invested: $69,720 (down + closing). Projections, not guarantees.
Landlord ↔ Tenant lean methodology
- Overall (STATE)
- 87 Strongly Landlord-Friendly
- State Texas
- 87 Strongly Landlord-Friendly · R+5
- County
- — inherits STATE
- City
- — inherits STATE
ZIP-level market 77568
- Home prices YoY
- -22.7%
- Rents YoY
- 4.0%
- Active inventory
- 661
- Price-to-rent
- 9.0×
Monthly cashflow live
- Estimated rent
- $2,304 high interval (Pro) →
- Mortgage (P&I)
- −$1,306
- Tax from tax record
- −$435 /mo · $5,222/yr
- Insurance
- −$104
- HOA
- −$0
- Vacancy / Maint / Mgmt
- −$484
- Net cashflow
- $-25
Break-even live
Sensitivity live
| Price | -10% $116 | -5% $46 | +0% $-25 | +5% $-95 | +10% $-166 |
|---|---|---|---|---|---|
| Rent | -10% $-207 | -5% $-116 | +0% $-25 | +5% $66 | +10% $157 |
| Rate | -1.0pp $101 | -0.5pp $38 | base $-25 | +0.5pp $-89 | +1.0pp $-155 |
UW: 25.0% down · 7.5% · 30yr · 1.5% tax · 5.0% vac · 8.0% maint · 8.0% mgmt
Financing live
Cash to close
- Down payment
- $62,250
- Closing costs
- $7,470
- Reserves months
- —
- Total cash needed
- —
Loan-product check · same deal, 3 products live
Conventional
25% down · 7.5% · 30yr
- Down + closing
- —
- Monthly P&I
- —
- Monthly cashflow
- —
- DSCR
- —
- Eligible?
- —
Personal DTI + credit; lowest rate.
DSCR
20% down · 8.5% · 30yr
- Down + closing
- —
- Monthly P&I
- —
- Monthly cashflow
- —
- DSCR
- —
- Eligible?
- —
No personal income docs; deal must DSCR.
Hard money
10% down · 12.0% · 12mo
- Down + closing
- —
- Monthly P&I
- —
- Monthly cashflow
- —
- DSCR
- —
- Eligible?
- —
Short-term bridge; refi at stabilization.
Rent comps 7 comps
| Address | Beds | Baths | Sqft | Rent | $/sqft | DOM | Units | Dist |
|---|---|---|---|---|---|---|---|---|
| 640 Totem Trail Dr La Marque, TX | 4.0 | 2.5 | 2134 | $2,309 | $1.08 | 13d | 1 | 0.22mi |
| 114 Mustang Stampede Dr La Marque, TX | 3.0 | 2.0 | 1752 | $2,050 | $1.17 | 3d | 1 | 0.34mi |
| 12524 Jetty Cv Santa Fe, TX | 3.0 | 2.0 | 1803 | $2,506 | $1.39 | 23d | 1 | 0.50mi |
| 2301 Starboard Sail Alta Loma, TX | 4.0 | 2.0 | 1856 | $2,181 | $1.18 | 13d | 1 | 0.54mi |
| 2437 Regatta Ln La Marque, TX | 4.0 | 2.0 | 1844 | $2,079 | $1.13 | 7d | 1 | 0.58mi |
| 3301 Gulf Fwy La Marque, TX | 1.0–3.0 | 1.0–2.0 | 991 | $2,430 | $2.45 | 0d | 21 | 0.98mi |
| 3210 Gulf Fwy Texas City, TX | 1.0–2.0 | 1.0–2.0 | 872 | $1,780 | $2.04 | 0d | 12 | 1.14mi |
Listing history 2 events
-
2026-06-21remarks 583-char remark
-
2026-06-21$248,999 Active 1 DOM
ⓘ Source: listings_history table (triggers on properties + properties_extension) + one-shot
backfill from property_details.listing_events for pre-trigger history.
Tax reassessment forecast TX · Resets to sale price
- Current annual tax
- $5,222 · $435/mo
- Projected year-2 tax
- $5,222 · $435/mo
- Expected delta
- $0/yr ($0/mo · 0.0%)
ⓘ Screening estimate from a state-policy table — verify with the county assessor before closing.
Climate risk First Street
- Flood 4/10 Moderate FEMA zone X (unshaded) · 20% chance over 30 yrs
- Wildfire 3/10 Moderate
- Heat 10/10 Extreme 7 d/yr ≥110°F today · 28 d/yr by 30 yrs out
- Wind 9/10 Extreme 99% chance of damaging wind over 30 yrs
- Air quality 3/10 Moderate 2 unhealthy d/yr today · 2 by 30 yrs out
Nearby sold comps map
Loading sold comps map…
Walkable amenities ~0.75 mi
Loading nearby amenities…
Taxation est. · year 1
- Rental income
- $27,644
- − Mortgage interest
- −$13,948
- − Property taxes
- −$5,222
- − Insurance
- −$1,245
- − Repairs & maintenance
- −$2,211
- − Management
- −$2,211
- − Depreciation
- −$7,244
- Taxable loss
- −$4,438
- Est. tax savings @ 24.0%
- +$1,065
- After-tax cash flow
- $767/yr
For passive investors: Depreciation is non-cash, so a rental often shows a tax loss while cash-flowing — sheltering income. Rental losses are passive: they offset passive income freely, and up to $25,000/yr can offset ordinary (W-2) income if you actively participate and your MAGI is under $100k (phasing out to $0 by $150k); unused losses carry forward. On sale, claimed depreciation is recaptured at up to 25%, and gains may owe capital-gains tax (a 1031 exchange can defer both). Figures are a year-1 estimate at your 24.0% rate — not tax advice; consult a CPA.
Schools (NCES district)
- District
- Santa Fe ISD
- NCES district ID
- 4839270
- Math proficiency
- 38% ▼ -10.00%
- Reading proficiency
- 39% ▼ -2.00%
- Median HH income
- $66,769
- Composite
- 34.86/100
- National rank
- #5091
- State rank
- #385 of 826 in TX
Livability — La Marque
- Score
- 59/100
- State rank
- #1136
- US rank
- #20037
Category grades
Schools grade is shown separately in the Schools card above.
Census & demographics
- Census place
- La Marque, TX
- County
- Galveston County · 357,330 people
- City population
- 23,083
- Metro
- Houston-The Woodlands-Sugar Land, TX
- Population (ZIP)
- 23,083
- Household income
- $74,694
- Rent vs Own
- Severe rent burden
- 700.0
Population outlook (Galveston County) Hauer SSP2
- Today (2025)
- 390,640 people
- By 2030
- 425,226 · +8.9%
- By 2040
- 493,765 · +26.4%
- By 2050
- 559,698 · +43.3%
- By 2075
- 719,260 · +84.1%
- By 2100
- 819,628 · +109.8%
Race, ethnicity, and origin ACS 2023
- Neighborhood character
- Highly diverse neighborhood (Simpson 0.71)
- Race & ethnicity
- White 37% Hispanic / Latino 29% Black 26% Two or more races 17% Asian 3%
- Hispanic origin (detail)
- Mexican 22% Puerto Rican 1%
- Common ancestry
- Lithuanian 1% Italian 1% Serbian 1%
- Foreign-born
- 8% · Canada
- Languages at home
- 77% English-only · Spanish 21% Tagalog/Filipino 1% Other Asian/Pacific 1%
Political lean MEDSL · Galveston
- 2024 margin
- Strong R (+27.4) · D 35.7% · R 63.1% · Other 1.2%
- 2008→2024 swing
- -7.9pp toward R · 2008: -19.5pp · 2024: -27.4pp
- All cycles
- 2024: R+27.4 2020: R+22.6 2016: R+22.6 2012: R+26.9 2008: R+19.5
Not yet ingested
- Civics
- —
Market trends
- HPI YoY
- ▼ -69.39%
- Current HPI
- 236.0239
- Rent YoY
- ▲ 3.95%
- Metro
- Houston-The Woodlands-Sugar Land, TX
- State GDP YoY
- ▲ 3.95%
- F500 in state
- 110
Industry mix (Fortune 500 HQ in TX)
| Industry | F500 HQs | Revenue |
|---|---|---|
| Energy | 16 | $1,198B |
|
||
| Technology | 5 | $198B |
|
||
| Engineering / Construction | 4 | $72B |
|
||
| Energy Services | 3 | $60B |
|
||
| Utilities | 3 | $41B |
|
||
| Healthcare | 2 | $330B |
|
||
Price history
+36.9% since first listed24 events — show timeline
- 2026-06-20 Listed $248,999 HARMLS
- 2025-05-15 Listing Removed — HARMLS
- 2025-04-02 Listed $248,500 HARMLS
- 2025-03-31 Listing Removed — HARMLS
- 2025-03-01 Price Changed $249,800 HARMLS
- 2025-02-15 Listed $252,000 HARMLS
- 2023-08-03 Sold (Public Records) — Public Records
- 2023-07-14 Sold (MLS) — HARMLS
- 2023-06-12 Pending — HARMLS
- 2023-06-01 Pending — HARMLS
- 2023-05-19 Price Changed $249,000 HARMLS
- 2023-05-01 Listed $254,800 HARMLS
- 2019-03-19 Sold (Public Records) — Public Records
- 2019-03-15 Sold (MLS) — HARMLS
- 2019-02-07 Pending — HARMLS
- 2019-02-01 Pending — HARMLS
- 2018-11-30 Listed $165,000 HARMLS
- 2016-06-21 Sold (MLS) — HARMLS
- 2016-05-27 Pending — HARMLS
- 2016-04-29 Price Changed $181,900 HARMLS
- 2016-04-29 Relisted — HARMLS
- 2016-03-24 Pending — HARMLS
- 2016-02-26 Price Changed $179,900 HARMLS
- 2016-02-18 Listed $181,900 HARMLS
Property tax history
+1.8%/yrLatest (2025): $5,222 · -3.2% YoY. Source: county tax records.
Cash-flow waterfall
monthlySold comps — $/sqft
last 12 mo · ≤1 miLoading sold comps…