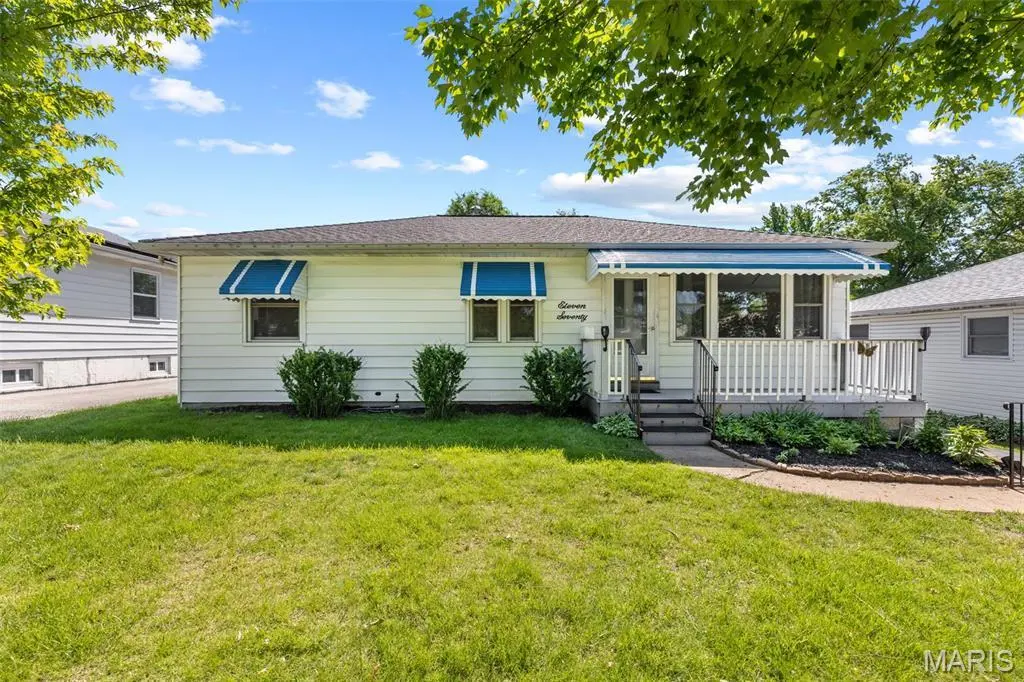
1170 Margaret Ln · Olivette, MO
Flood risk 1/10 · Minimal
- FEMA flood zone
- X (unshaded)
- Chance of flooding over 30 yrs
- 0.0%
- Est. flood insurance / yr
- $473 – $860
Fire risk 1/10 · Minimal
- Est. fire insurance / yr
- $1,054 – $1,958
Heat risk 5/10 · Moderate
- Hot days now (above 107°F)
- 7 days/yr
- Hot days in 30 yrs
- 21 days/yr
Wind risk 2/10 · Minimal
- Chance of severe wind over 30 yrs
- 1.0%
Air-quality risk 2/10 · Minimal
- Unhealthy air days now
- 1 days/yr
- Unhealthy air days in 30 yrs
- 3 days/yr
Risk factors via First Street. Map © Google.
Why this score? — see what drove the D grade
The composite is a weighted blend of 9 inputs, each scored 0–100. Each bar is that input's sub-score; the figure is the points it added to the 100-point composite (weight × sub-score).
- Cash flow +12.6/30.0
- ARV discount +7.8/15.0
- Schools +6.3/10.0
- Rent growth +4.2/5.0
- DSCR +3.8/10.0
- Livability +3.5/5.0
- 1% rule +2.9/10.0
- Condition / age +2.5/5.0
- Appreciation +0.0/10.0
$250,000
🖨 Deal sheet (PDF) 📄 Offer letter ✓ Due diligence
Listing remarks
Location, convenience, and opportunity come together in this adorable 3-bedroom home in the esteemed Ladue School District! Tucked away on a quiet, private lane with only five homes, this property offers a rare blend of peaceful living and unbeatable access to shopping, dining, and everyday conveniences. Just moments from the exciting new Costco development with Dierbergs, Target, and numerous restaurants, plus steps from Chevy’s and the new Paris Baguette Bakery, you’ll love the lifestyle and easy access to everything. Inside, the home shines with gorgeous refinished hardwood floors in all three bedrooms, while the living room, dining room, and kitchen feature stylish new luxur
Key facts
- 7,039 sq ft lot
- Built 1953
- Listed 2 days
Property features AI
Finance
- Other: Living area reported as 1,040 (public records); Lot dimensions approximately 128 x 55
Exterior
- Parking: Driveway parking
- Utilities: Public water; Public sewer; Electric service by Ameren; Electricity connected; Natural gas connected; Water connected; Sewer connected
- Home design: Single-family residence; One level; Private ownership
- Construction: Aluminum siding; Architectural shingle roof; Concrete perimeter foundation; Built year (public records)
- Exterior features: Deck; Front porch; Awnings; Sliding doors; Shed(s); Back yard; Front yard; Few trees; Level, rectangular lot; Located on a cul-de-sac; Concrete road frontage on a private road
Interior
- Kitchen: Dishwasher; Free-standing gas range
- Bedrooms: 3 bedrooms on main level
- Flooring: Hardwood
- Bathrooms: 1 full bathroom
- Heating & cooling: Natural gas heating; Central air conditioning
- Interior features: Laminate counters; Open floor plan; 8 ft+ poured basement
- Laundry & utility: Washer and dryer (included); Gas water heater; Laundry located in basement
Neighborhood map
What this means for you Summary
Snapshot
- This is a 2-bed/1.0-bath single-family listed at $250k.
Deal economics
- At list price, monthly cash flow is $-31 ($-377/yr) — negative.
- To cash-flow at today's rent, offer at most $244k (2.2% below list).
- To meet the 1% rule (rent ≥ 1% of price), the offer needs to be $198k (20.9% below list).
- Recommended offer: $198k (20.9% below list) — sets the bar for 1% rule.
- Cap rate 6.1% vs local median 0.6% in Olivette — top-decile yield for the area; either an underpriced asset or a hidden risk that comps aren't pricing in. Stress-test before assuming the spread holds.
Location & tenants
- Location reads 69/100 on livability (#148 in MO) — a middle-class / working-renter tenant base. Strengths: crime A+, employment A+, housing A+; Watch: amenities F, commute F, cost of living D-.
- Ladue (suburban): math 64% / reading 70% proficiency, ranked #2 of 324 in MO (top 1%) — acceptable for families but not a draw, mixed tenant base, ~2y average lease; only 9% free/reduced lunch — higher-income household profile.
- Zoned schools: Old Bonhomme Elementary (math 62% / reading 67%, grade B, #70 of 1,115 statewide, top 8%, 391 students, 10% FRL); Ladue Middle (math 58% / reading 68%, grade B+, #12 of 391 statewide, top 3%, 1,018 students, 12% FRL); Ladue Horton Watkins High (math 70% / reading 72%, grade B+, #8 of 521 statewide, top 1%, 1,313 students, 12% FRL) — zoned schools at 11% FRL track the district average.
- Market conditions: Rents rising fast (+6.6%/yr); 53 active listings in the ZIP; 17 comparable units currently listed for rent nearby; rentals leasing fast (median 5d on market — plan ~1-2 weeks tenant-placement turnaround); solid renter incomes; 920 units permitted in St. Louis County in 2024 (250 in 5+ unit buildings).
Forward outlook
- Local home prices are declining (-3.0%/yr); year-one equity from $2k of loan paydown is wiped out by about $8k of value loss. Plan a longer hold.
Negotiation context
- Only 2 days on market — expect competitive offers; lowballing is unlikely to land.
Risks & watch-outs
- Watch-outs: built in 1953 — expect roof / HVAC / electrical / plumbing capex.
- Climate carrying-cost: extreme-heat days projected 7→21/yr by 2055 (HVAC capex compounding) — expect insurance premiums to compound above CPI over the hold.
Questions for the listing agent
- What do current leases actually rent for vs. the listed asking? Can we see a recent rent roll and the last 12 months of T-12 income?
- Built in 1953 — when were the roof, HVAC, electrical panel, plumbing, and water heater last replaced?
- Is there a deadline driving the sale (1031 exchange, divorce, estate, relocation)? That informs how much negotiation room exists.
- Schools are A-rated — typically a magnet for longer-tenancy family renters. What's the average tenant stay here, and is there a school-zone premium baked into asking?
- The area grade is low — what's the realistic commute time and amenity access for the typical tenant pool here? Any planned neighborhood developments (good or bad) we should know about?
- What's the average days-on-market for RENTAL listings here right now (not sales)? A rising rental-DOM trend means longer vacancies and softer asking-rent achievability than the comps imply.
- What's the recent tenant-quality profile in this submarket — average credit score on applications, eviction rate, late-payment / NSF rate, and stable-employment percentage? A property-management company in the area should have these aggregated.
- How much new for-sale + rental construction is in the pipeline within 1–3 miles? Heavy new supply typically softens prices + rents 12–24 months out; constrained supply supports both.
Investment metrics
- 1% rule
- 0.79% ✗
- Cap rate
- 6.14%
- Cash-on-cash
- -0.54%
- DSCR
- 0.98
- GRM
- 10.5
CMA / ARV
- ARV (median comp)
- $251,582
- List price
- $250,000
- Delta
- -0.63%
- Verdict
- FAIR
- Comps
- 20 within 1.0 mi
Show comp detail 12 sales within ~0.75 mi
| Address | Dist | Beds/Ba | Sqft | Sold | Price | $/sf | Match |
|---|---|---|---|---|---|---|---|
| 1170 Margaret Ln | 0.00mi | 3/1.0 (+1) | 1,040 (0%) | 0mo | $250,000 | $240 | 95 |
| 1127 Hilltop Dr | 0.12mi | 2/1.0 | 988 (-5%) | 14mo | $199,000 | $201 | 74 |
| 1211 Olivette Dr | 0.10mi | 3/1.5 (+1) | 1,008 (-3%) | 15mo | $199,990 | $198 | 71 |
| 9311 Kenneth Pl | 0.36mi | 3/2.0 (+1) | 1,120 (+8%) | 3mo | $345,000 | $308 | 59 |
| 8409 Braddock Dr | 0.70mi | 2/1.5 | 952 (-8%) | 0mo | $74,900 | $79 | 51 |
| 9405 Trenton Ave | 0.60mi | 3/1.5 (+1) | 1,075 (+3%) | 13mo | $215,000 | $200 | 48 |
| 9411 Crockett Dr | 0.72mi | 3/1.5 (+1) | 1,118 (+8%) | 1mo | $249,900 | $224 | 46 |
| 1430 Sheridan | 0.55mi | 2/1.0 | 936 (-10%) | 14mo | $125,000 | $134 | 46 |
| 8646 Spoon Dr | 0.57mi | 3/1.0 (+1) | 1,152 (+11%) | 11mo | $269,000 | $234 | 41 |
| 1253 Dielman Rd | 0.64mi | 3/1.5 (+1) | 1,144 (+10%) | 8mo | $224,900 | $197 | 40 |
| 1471 Coolidge | 0.56mi | 2/1.5 | 900 (-14%) | 14mo | $157,000 | $174 | 38 |
| 8410 Richard Ave | 0.63mi | 3/1.0 (+1) | 1,188 (+14%) | 13mo | $190,000 | $160 | 31 |
Match score weights: distance 35% · size 25% · config 20% · recency 20%. Top-matched comps best support the ARV.
Projected returns pro-forma
-3.0% appreciation · 6.64% rent growth · sell at horizon
- IRR
- -13.5%
- Equity multiple
- 0.50×
- Total profit
- $-35,054
- Equity at exit
- $37,276
- IRR
- -0.0%
- Equity multiple
- 1.00×
- Total profit
- $-100
- Equity at exit
- $21,615
Cash invested: $70,000 (down + closing). Projections, not guarantees.
Landlord ↔ Tenant lean methodology
- Overall (STATE)
- 81 Strongly Landlord-Friendly
- State Missouri
- 81 Strongly Landlord-Friendly · R+10
- County
- — inherits STATE
- City
- — inherits STATE
ZIP-level market 63132
- Rents YoY
- 6.6%
- Active inventory
- 53
- Price-to-rent
- 10.5×
Monthly cashflow live
- Estimated rent
- $1,978 high interval (Pro) →
- Mortgage (P&I)
- −$1,311
- Tax from tax record
- −$179 /mo · $2,146/yr
- Insurance
- −$104
- HOA
- −$0
- Vacancy / Maint / Mgmt
- −$415
- Net cashflow
- $-31
Break-even live
Sensitivity live
| Price | -10% $110 | -5% $39 | +0% $-31 | +5% $-102 | +10% $-173 |
|---|---|---|---|---|---|
| Rent | -10% $-188 | -5% $-110 | +0% $-31 | +5% $47 | +10% $125 |
| Rate | -1.0pp $94 | -0.5pp $32 | base $-31 | +0.5pp $-96 | +1.0pp $-162 |
UW: 25.0% down · 7.5% · 30yr · 1.5% tax · 5.0% vac · 8.0% maint · 8.0% mgmt
Financing live
Cash to close
- Down payment
- $62,500
- Closing costs
- $7,500
- Reserves months
- —
- Total cash needed
- —
Loan-product check · same deal, 3 products live
Conventional
25% down · 7.5% · 30yr
- Down + closing
- —
- Monthly P&I
- —
- Monthly cashflow
- —
- DSCR
- —
- Eligible?
- —
Personal DTI + credit; lowest rate.
DSCR
20% down · 8.5% · 30yr
- Down + closing
- —
- Monthly P&I
- —
- Monthly cashflow
- —
- DSCR
- —
- Eligible?
- —
No personal income docs; deal must DSCR.
Hard money
10% down · 12.0% · 12mo
- Down + closing
- —
- Monthly P&I
- —
- Monthly cashflow
- —
- DSCR
- —
- Eligible?
- —
Short-term bridge; refi at stabilization.
Rent comps 17 comps
| Address | Beds | Baths | Sqft | Rent | $/sqft | DOM | Units | Dist |
|---|---|---|---|---|---|---|---|---|
| 1150 N Price Rd St. Louis, MO | 1.0–3.0 | 1.0–2.0 | 999 | $2,758 | $2.76 | 0d | 150 | 0.09mi |
| 8669 Old Towne Dr St. Louis, MO | 1.0–2.0 | 1.0–2.0 | 1185 | $1,874 | $1.58 | 0d | 9 | 0.60mi |
| 910 N McKnight Rd St. Louis, MO | 2.0 | 2.0 | 1400 | $2,500 | $1.79 | 0d | 1 | 0.82mi |
| 8303 Braddock Dr Saint Louis, MO | 2.0 | 1.0 | 720 | $1,075 | $1.49 | 25d | 1 | 0.83mi |
| 8246 Montreal Dr Saint Louis, MO | 2.0 | 1.0 | 850 | $1,450 | $1.71 | 45d | 1 | 0.86mi |
| 8650 Kingsbridge Dr St. Louis, MO | 2.0–3.0 | 1.0 | 887 | $1,150 | $1.30 | 0d | 9 | 0.96mi |
| 1 Heartwoods Ct Unit A St. Louis, MO | 2.0 | 1.0 | 850 | $1,495 | $1.76 | 16d | 1 | 1.00mi |
| 1276 Vaughan Dr Saint Louis, MO | 2.0 | 1.0 | 825 | $1,100 | $1.33 | 18d | 1 | 1.01mi |
| 8701 Delmar Blvd Unit 8701-3D Delmar St. Louis, MO | 3.0 | 2.0 | 1450 | $1,595 | $1.10 | 45d | 1 | 1.10mi |
| 2201 Gaebler Ave Unit A Overland, MO | 2.0 | 1.0 | 710 | $1,250 | $1.76 | 25d | 1 | 1.20mi |
| 2201 Gaebler Ave Unit 1 Overland, MO | 2.0 | 1.0 | 750 | $1,300 | $1.73 | 0d | 1 | 1.20mi |
| 8400 Delmar Blvd St. Louis, MO | 3.0 | 1.0–2.0 | 1006 | $2,967 | $2.95 | 0d | 8 | 1.28mi |
| 9905 Iveland Dr Saint Louis, MO | 2.0 | 1.0 | 816 | $1,370 | $1.68 | 4d | 1 | 1.33mi |
| 8241 Delmar Blvd Apt 2E St. Louis, MO | 2.0 | 1.0 | 1100 | $1,175 | $1.07 | 16d | 1 | 1.35mi |
| 8342 Delcrest Dr Saint Louis, MO | 1.0–3.0 | 1.0–2.0 | 1089 | $2,326 | $2.13 | 0d | 16 | 1.40mi |
| 8449 Atherton Dr St. Louis, MO | 1.0–2.0 | 1.0 | 900 | $1,245 | $1.38 | 4d | 2 | 1.43mi |
| 7812 Drexel Dr Saint Louis, MO | 2.0 | 1.0 | 1100 | $1,450 | $1.32 | 0d | 1 | 1.48mi |
Listing history 4 events
-
2026-05-16status Pending 1329-char remark
-
2026-05-15$250,000 Active 1329-char remark
-
2026-05-14historical $250,000 1329-char remark
-
1964-01-07soldstatus
ⓘ Source: listings_history table (triggers on properties + properties_extension) + one-shot
backfill from property_details.listing_events for pre-trigger history.
Tax reassessment forecast MO · Resets to sale price
- Current annual tax
- $2,146 · $179/mo
- Projected year-2 tax
- $2,425 · $202/mo
- Expected delta
- +$279/yr (+$23/mo · 13.0%)
ⓘ Screening estimate from a state-policy table — verify with the county assessor before closing.
Climate risk First Street
- Flood 1/10 Low FEMA zone X (unshaded) · 0% chance over 30 yrs
- Wildfire 1/10 Low
- Heat 5/10 Major 7 d/yr ≥107°F today · 21 d/yr by 30 yrs out
- Wind 2/10 Low 100% chance of damaging wind over 30 yrs
- Air quality 2/10 Low 1 unhealthy d/yr today · 3 by 30 yrs out
Nearby sold comps map
Loading sold comps map…
Walkable amenities ~0.75 mi
Loading nearby amenities…
Taxation est. · year 1
- Rental income
- $23,737
- − Mortgage interest
- −$14,004
- − Property taxes
- −$2,146
- − Insurance
- −$1,250
- − Repairs & maintenance
- −$1,899
- − Management
- −$1,899
- − Depreciation
- −$7,273
- Taxable loss
- −$4,734
- Est. tax savings @ 24.0%
- +$1,136
- After-tax cash flow
- $759/yr
For passive investors: Depreciation is non-cash, so a rental often shows a tax loss while cash-flowing — sheltering income. Rental losses are passive: they offset passive income freely, and up to $25,000/yr can offset ordinary (W-2) income if you actively participate and your MAGI is under $100k (phasing out to $0 by $150k); unused losses carry forward. On sale, claimed depreciation is recaptured at up to 25%, and gains may owe capital-gains tax (a 1031 exchange can defer both). Figures are a year-1 estimate at your 24.0% rate — not tax advice; consult a CPA.
Schools (NCES district)
- District
- Ladue
- NCES district ID
- 2917820
- Math proficiency
- 64% ▼ -6.00%
- Reading proficiency
- 70% ▼ -2.00%
- Median HH income
- $109,713
- Composite
- 62.57/100
- National rank
- #681
- State rank
- #2 of 324 in MO
Livability — Olivette
- Score
- 69/100
- State rank
- #148
- US rank
- #8431
Category grades
Schools grade is shown separately in the Schools card above.
Census & demographics
- Census place
- Olivette, MO
- County
- Saint Louis County · 888,823 people
- City population
- 14,283
- Metro
- St. Louis, MO-IL
- Population (ZIP)
- 14,283
- Household income
- $87,385
- Rent vs Own
- Severe rent burden
- 644.0
Population outlook (St. Louis County) Hauer SSP2
- Today (2025)
- 1,025,227 people
- By 2030
- 1,028,023 · +0.3%
- By 2040
- 1,020,940 · -0.4%
- By 2050
- 1,007,280 · -1.8%
- By 2075
- 987,277 · -3.7%
- By 2100
- 921,984 · -10.1%
Race, ethnicity, and origin ACS 2023
- Neighborhood character
- Diverse neighborhood (Simpson 0.66)
- Race & ethnicity
- White 49% Black 27% Asian 16% Two or more races 5% Hispanic / Latino 1%
- Common ancestry
- Romanian 5% Scotch-Irish 3% Slovak 2%
- Foreign-born
- 12% · China, Canada, Philippines
- Languages at home
- 82% English-only · Chinese 9% Other Asian/Pacific 3% Other Indo-European 2%
Political lean MEDSL · St. Louis
- 2024 margin
- Strong D (+23.4) · D 60.8% · R 37.4% · Other 1.7%
- 2008→2024 swing
- +3.5pp toward D · 2008: 19.9pp · 2024: 23.4pp
- All cycles
- 2024: D+23.4 2020: D+24.0 2016: D+16.2 2012: D+13.7 2008: D+19.9
Not yet ingested
- Civics
- —
Market trends
- HPI YoY
- ▼ -482.68%
- Current HPI
- 255.4778
- Rent YoY
- ▲ 6.64%
- Metro
- St. Louis, MO-IL
- State GDP YoY
- ▲ 1.84%
- F500 in state
- 20
Industry mix (Fortune 500 HQ in MO)
| Industry | F500 HQs | Revenue |
|---|---|---|
| Healthcare | 1 | $163B |
|
||
| Insurance | 1 | $21B |
|
||
| Industrial Technology | 1 | $17B |
|
||
| Retail | 1 | $16B |
|
||
| Industrial Distribution | 1 | $10B |
|
||
| Utilities | 1 | $9B |
|
||
Price history
+0.0% since first listed5 events — show timeline
- 2026-06-10 Sold (MLS) — MARIS as Distributed by MLS Grid
- 2026-05-16 Pending — MARIS as Distributed by MLS Grid
- 2026-05-15 Listed $250,000 MARIS as Distributed by MLS Grid
- 2026-05-14 Coming Soon $250,000 MARIS as Distributed by MLS Grid
- 1964-01-07 Sold (Public Records) — Public Records
Property tax history
+4.7%/yrLatest (2022): $2,146 · +0.6% YoY. Source: county tax records.
Cash-flow waterfall
monthlySold comps — $/sqft
last 12 mo · ≤1 miLoading sold comps…