7809 SW 12th Pl · Bell, FL
Flood risk 1/10 · Minimal
- FEMA flood zone
- X (shaded)
- Chance of flooding over 30 yrs
- 0.0%
- Est. flood insurance / yr
- $507 – $1,088
Fire risk 6/10 · Moderate
- Est. fire insurance / yr
- $947 – $1,759
Heat risk 8/10 · Major
- Hot days now (above 108°F)
- 7 days/yr
- Hot days in 30 yrs
- 21 days/yr
Wind risk 9/10 · Severe
- Chance of severe wind over 30 yrs
- 99.0%
Air-quality risk 3/10 · Minor
- Unhealthy air days now
- 3 days/yr
- Unhealthy air days in 30 yrs
- 3 days/yr
Risk factors via First Street. Map © Google.
Why this score? — see what drove the A- grade
The composite is a weighted blend of 9 inputs, each scored 0–100. Each bar is that input's sub-score; the figure is the points it added to the 100-point composite (weight × sub-score).
- Cash flow +30.0/30.0
- 1% rule +10.0/10.0
- DSCR +10.0/10.0
- Appreciation +10.0/10.0
- ARV discount +7.5/15.0
- Schools +5.3/10.0
- Livability +3.1/5.0
- Rent growth +2.5/5.0
- Condition / age +2.5/5.0
$64,900
🖨 Deal sheet 📄 Offer letter ✓ Due diligence
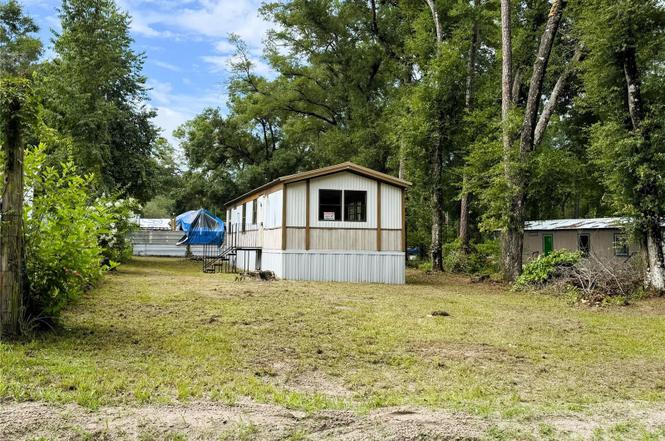
Listing remarks
If you’ve been dreaming of a place in North Central Florida surrounded by nature that you can make your own, look no further. Tucked away in a peaceful, rural setting, this property sits just a half mile from a paved public boat ramp on the historic Suwannee River, giving you effortless access to boating, fishing, and endless river adventures. You’re also close to some of the area’s most loved natural attractions: Hart Springs is approx. 10 miles, Otter Springs is approx. 8 miles, Blue Springs State Park is approx. 14 miles, and Fanning Springs State Park is approx. 12 miles. While the setting is remote, you’re still within reach of nearby towns for shopping, dini
Key facts
- Suwannee river
- Otter springs
- Public boat ramp
Tags
Property features AI
Finance
- Other: Residential property; Property subtype: Manufactured Home; Universal property ID available
- Financial info: No lease restrictions
- HOA & community: No HOA/association
Exterior
- Parking: No parking details provided
- Security: No security features listed
- Utilities: Well water; Septic system; Electricity connected; Water connected; Sewer connected
- Home design: Manufactured single-wide home; One story; Faces east; Entry at ground level
- Construction: Metal siding; Metal roof; Built on crawlspace with pillar/post/pier foundation
- Exterior features: Dirt road access; Publicly maintained road; Lot approximately 0.15 acres (about 607 m²); No waterfront or water access
Interior
- Kitchen: Range; Refrigerator; Electric water heater
- Bedrooms: 2 bedrooms
- Flooring: Wood flooring
- Bathrooms: 1 full bathroom
- Heating & cooling: Central heating; Central air conditioning
- Interior features: Kitchen and family room combined; Total of 4 rooms
- Laundry & utility: Inside laundry
Neighborhood map
What this means for you Summary
Snapshot
- This is a 2-bed/2.0-bath manufactured listed at $65k.
Deal economics
- At list price, monthly cash flow is $822 ($10k/yr) — positive.
- The deal already cash-flows at list — no discount required.
- Meets the 1% rule at list price ($2k rent vs $65k).
- Cap rate 21.5% vs local median 4.8% in Bell — top-decile yield for the area; either an underpriced asset or a hidden risk that comps aren't pricing in. Stress-test before assuming the spread holds.
Location & tenants
- Location reads 62/100 on livability (#767 in FL) — a middle-class / working-renter tenant base. Strengths: cost of living A+, housing A+; Watch: crime D, health & safety D, amenities F.
- Gilchrist (rural): math 66% / reading 61% proficiency, ranked #9 of 73 in FL (top 12%) — acceptable for families but not a draw, mixed tenant base, ~2y average lease.
- Market conditions: 112 active listings in the ZIP; 94 units permitted in Gilchrist County in 2024 (0 in 5+ unit buildings).
Forward outlook
- In year one you build about $7k of equity ($449 loan paydown + $6k appreciation (10.0% local appreciation)).
- Gilchrist County population projected to shrink 6% by 2050 — rents likely to lag national; underwrite the cash flow, not the appreciation.
- At projected returns (10.0% appreciation + 3.0% rent growth), your $18k cash investment doubles in ~2 years — after that, you're playing with house money.
- By year 5, paydown + projected appreciation supports a ~$32k cash-out refi (75% LTV) — recoverable capital for the next deal without selling this one.
Negotiation context
- Only 1 days on market — expect competitive offers; lowballing is unlikely to land.
- 3 sale attempts since 3y ago with the ask held roughly flat each time — persistent listings suggest the price (not the market) is what's stuck; bring a comps-based counter.
Risks & watch-outs
- Climate carrying-cost: severe wind risk, 99% chance of damaging wind over 30y; major wildfire risk; extreme-heat days projected 7→21/yr by 2055 (HVAC capex compounding) — expect insurance premiums to compound above CPI over the hold.
Questions for the listing agent
- Is there a deadline driving the sale (1031 exchange, divorce, estate, relocation)? That informs how much negotiation room exists.
- Crime grade is D in this area — have there been break-ins, vandalism, or insurance claims at this property in the last 3 years? What carrier currently insures it and at what premium?
- What's the average days-on-market for RENTAL listings here right now (not sales)? A rising rental-DOM trend means longer vacancies and softer asking-rent achievability than the comps imply.
- What's the recent tenant-quality profile in this submarket — average credit score on applications, eviction rate, late-payment / NSF rate, and stable-employment percentage? A property-management company in the area should have these aggregated.
- How much new for-sale + rental construction is in the pipeline within 1–3 miles? Heavy new supply typically softens prices + rents 12–24 months out; constrained supply supports both.
Investment metrics
- 1% rule
- 2.44% ✓
- Cap rate
- 21.50%
- Cash-on-cash
- 54.31%
- DSCR
- 3.42
- GRM
- 3.4
CMA / ARV
No comps found within radius.
Projected returns pro-forma
9.98% appreciation · 3.0% rent growth · sell at horizon
- IRR
- 67.2%
- Equity multiple
- 5.82×
- Total profit
- $87,628
- Equity at exit
- $58,352
- IRR
- 60.9%
- Equity multiple
- 12.93×
- Total profit
- $216,854
- Equity at exit
- $125,716
Cash invested: $18,172 (down + closing). Projections, not guarantees.
Landlord ↔ Tenant lean methodology
- Overall (STATE)
- 87 Strongly Landlord-Friendly
- State Florida
- 87 Strongly Landlord-Friendly · R+3
- County
- — inherits STATE
- City
- — inherits STATE
ZIP-level market 32619
- Home prices YoY
- 2.5%
- Active inventory
- 112
- Price-to-rent
- 3.4×
Monthly cashflow live
- Estimated rent
- $1,584 medium interval (Pro) →
- Mortgage (P&I)
- −$340
- Tax from tax record
- −$62 /mo · $741/yr
- Insurance
- −$27
- HOA
- −$0
- Vacancy / Maint / Mgmt
- −$333
- Net cashflow
- $822
Break-even live
UW: 25.0% down · 7.5% · 30yr · 1.5% tax · 5.0% vac · 8.0% maint · 8.0% mgmt
Financing live
Cash to close
- Down payment
- $16,225
- Closing costs
- $1,947
- Reserves months
- —
- Total cash needed
- —
Loan-product check · same deal, 3 products live
Conventional
25% down · 7.5% · 30yr
- Down + closing
- —
- Monthly P&I
- —
- Monthly cashflow
- —
- DSCR
- —
- Eligible?
- —
Personal DTI + credit; lowest rate.
DSCR
20% down · 8.5% · 30yr
- Down + closing
- —
- Monthly P&I
- —
- Monthly cashflow
- —
- DSCR
- —
- Eligible?
- —
No personal income docs; deal must DSCR.
Hard money
10% down · 12.0% · 12mo
- Down + closing
- —
- Monthly P&I
- —
- Monthly cashflow
- —
- DSCR
- —
- Eligible?
- —
Short-term bridge; refi at stabilization.
Listing history 2 events
-
2026-06-18remarks 675-char remark
-
2026-06-18$64,900 Active 1 DOM
ⓘ Source: listings_history table (triggers on properties + properties_extension) + one-shot
backfill from property_details.listing_events for pre-trigger history.
Tax reassessment forecast FL · Resets to sale price
- Current annual tax
- $741 · $62/mo
- Projected year-2 tax
- $741 · $62/mo
- Expected delta
- $0/yr ($0/mo · 0.0%)
ⓘ Screening estimate from a state-policy table — verify with the county assessor before closing.
Climate risk First Street
- Flood 1/10 Low FEMA zone X (shaded) · 0% chance over 30 yrs
- Wildfire 6/10 Major
- Heat 8/10 Severe 7 d/yr ≥108°F today · 21 d/yr by 30 yrs out
- Wind 9/10 Extreme 99% chance of damaging wind over 30 yrs
- Air quality 3/10 Moderate 3 unhealthy d/yr today · 3 by 30 yrs out
Nearby sold comps map
Loading sold comps map…
Walkable amenities ~0.75 mi
Loading nearby amenities…
Taxation est. · year 1
- Rental income
- $19,011
- − Mortgage interest
- −$3,635
- − Property taxes
- −$741
- − Insurance
- −$324
- − Repairs & maintenance
- −$1,521
- − Management
- −$1,521
- − Depreciation
- −$1,888
- Taxable income
- $9,380
- Est. tax owed @ 24.0%
- −$2,251
- After-tax cash flow
- $7,617/yr
For passive investors: Depreciation is non-cash, so a rental often shows a tax loss while cash-flowing — sheltering income. Rental losses are passive: they offset passive income freely, and up to $25,000/yr can offset ordinary (W-2) income if you actively participate and your MAGI is under $100k (phasing out to $0 by $150k); unused losses carry forward. On sale, claimed depreciation is recaptured at up to 25%, and gains may owe capital-gains tax (a 1031 exchange can defer both). Figures are a year-1 estimate at your 24.0% rate — not tax advice; consult a CPA.
Schools (NCES district)
- District
- Gilchrist
- NCES district ID
- 1200630
- Math proficiency
- 66% ▼ -4.00%
- Reading proficiency
- 61% ▼ -5.00%
- Median HH income
- $39,610
- Composite
- 53.01/100
- National rank
- #1522
- State rank
- #9 of 73 in FL
Livability — Bell
- Score
- 62/100
- State rank
- #767
- US rank
- #17229
Category grades
Schools grade is shown separately in the Schools card above.
Census & demographics
- City population
- 5,227
- Population (ZIP)
- 5,227
Population outlook (Gilchrist County) Hauer SSP2
- Today (2025)
- 17,730 people
- By 2030
- 17,722 · +-0.0%
- By 2040
- 17,393 · -1.9%
- By 2050
- 16,597 · -6.4%
- By 2075
- 14,300 · -19.3%
- By 2100
- 11,498 · -35.1%
Race, ethnicity, and origin ACS 2023
- Neighborhood character
- Predominantly White (90%)
- Race & ethnicity
- White 90% Hispanic / Latino 7% Two or more races 4%
- Hispanic origin (detail)
- Mexican 3%
- Common ancestry
- Lithuanian 9% Romanian 3% Scotch-Irish 2%
- Foreign-born
- 7% · Canada
- Languages at home
- 93% English-only · Spanish 4% German/W. Germanic 2% Tagalog/Filipino 1%
Political lean MEDSL · Gilchrist
- 2024 margin
- Solid R (+68.0) · D 15.6% · R 83.6%
- 2008→2024 swing
- -21.2pp toward R · 2008: -46.8pp · 2024: -68.0pp
- All cycles
- 2024: R+68.0 2020: R+64.0 2016: R+62.8 2012: R+51.0 2008: R+46.8
Not yet ingested
- Civics
- —
Market trends
- HPI YoY
- ▲ 9.98%
- Current HPI
- 404.4164
- Rent YoY
- —
- Metro
- —
- State GDP YoY
- ▲ 3.28%
- F500 in state
- 36
Industry mix (Fortune 500 HQ in FL)
| Industry | F500 HQs | Revenue |
|---|---|---|
| Industrial Technology | 2 | $29B |
|
||
| Insurance | 2 | $17B |
|
||
| Retail | 1 | $60B |
|
||
| Technology Distribution | 1 | $58B |
|
||
| Homebuilding | 1 | $35B |
|
||
| Technology Manufacturing | 1 | $35B |
|
||
Price history
+75.4% since first listed7 events — show timeline
- 2026-06-18 Listed $64,900 Stellar MLS as Distributed by MLS Grid
- 2025-03-22 Listing Removed — Stellar MLS as Distributed by MLS Grid
- 2025-01-04 Price Changed $69,000 Stellar MLS as Distributed by MLS Grid
- 2024-12-10 Price Changed $74,000 Stellar MLS as Distributed by MLS Grid
- 2024-09-24 Listed $78,000 Stellar MLS as Distributed by MLS Grid
- 2023-10-02 Listing Removed — Stellar MLS as Distributed by MLS Grid
- 2023-03-06 Listed $37,000 Stellar MLS as Distributed by MLS Grid
Property tax history
+7.5%/yrLatest (2025): $741 · +54.3% YoY. Source: county tax records.
Cash-flow waterfall
monthlySold comps — $/sqft
last 12 mo · ≤1 miLoading sold comps…