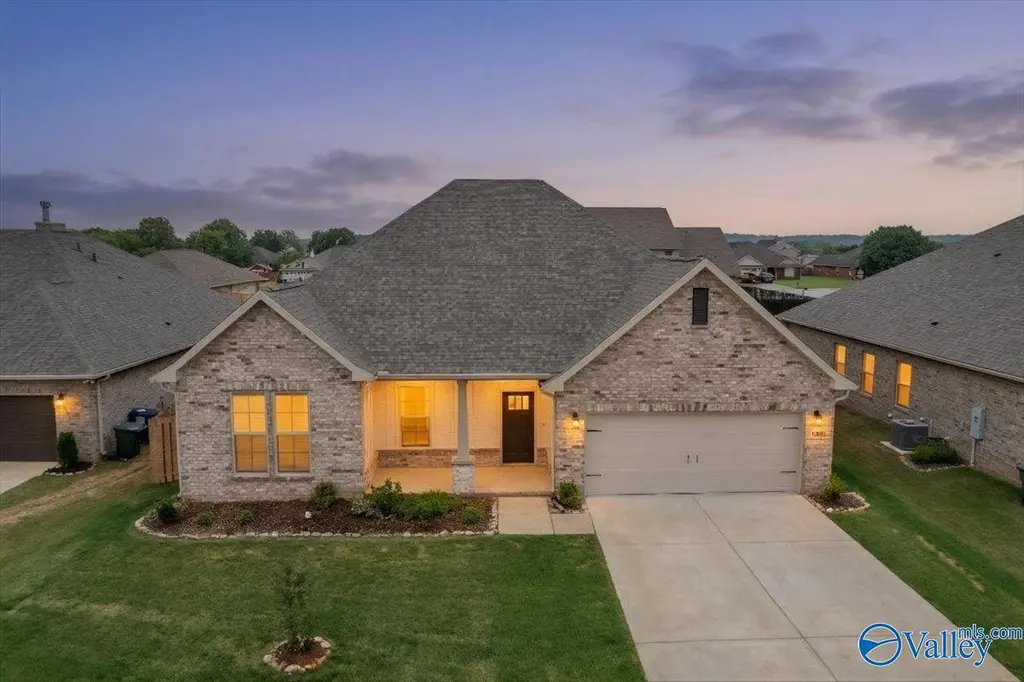
15908 NW Big Ben Dr · Huntsville, AL
Flood risk 1/10 · Minimal
- FEMA flood zone
- X (unshaded)
- Chance of flooding over 30 yrs
- 0.0%
- Est. flood insurance / yr
- $507 – $1,088
Fire risk 3/10 · Minor
- Est. fire insurance / yr
- $916 – $1,700
Heat risk 6/10 · Moderate
- Hot days now (above 104°F)
- 7 days/yr
- Hot days in 30 yrs
- 19 days/yr
Wind risk 4/10 · Minor
- Chance of severe wind over 30 yrs
- 15.0%
Air-quality risk 2/10 · Minimal
- Unhealthy air days now
- 1 days/yr
- Unhealthy air days in 30 yrs
- 1 days/yr
Risk factors via First Street. Map © Google.
Why this score? — see what drove the D- grade
The composite is a weighted blend of 9 inputs, each scored 0–100. Each bar is that input's sub-score; the figure is the points it added to the 100-point composite (weight × sub-score).
- Cash flow +11.6/30.0
- ARV discount +9.0/15.0
- Livability +4.1/5.0
- DSCR +3.4/10.0
- Schools +2.9/10.0
- Rent growth +2.7/5.0
- Condition / age +2.5/5.0
- 1% rule +2.1/10.0
- Appreciation +0.0/10.0
$338,900
🖨 Deal sheet (PDF) 📄 Offer letter ✓ Due diligence
Listing remarks
10k towards closing Full brick 4 BR, 2BA upgraded plan w/ no carpet better than new. Upgrades double vanity, garden tub, separate shower & walk-in closet in the master bath, double vanity 2nd bath, Stainless kitchen appliance w/ Fridge kitchen island, tile backsplash, walk-in pantry, boot bench & cov front porch & rear patio, undermount sinks, custom kitchen backsplash, recessed/pendant lights, landscaping with stone edging, gutters, stone address blocks & soaring 10 & 11 foot ceilings, vinyl low E-3 tilt-in windows, drop zone in mudroom, Laundry & closets have wooden shelving, 5 panel doors, new privacy fence. Baths has ceramic tile & granite coun
Key facts
- Double vanity
- Walk-in closet
- Separate shower
Tags
Property features AI
Finance
- Other: Lot approximately 0.23 acres (10,018.8 sq ft) with irregular dimensions
- HOA & community: Homeowners association with annual fee of $160; Community common grounds; Subdivision: Tunlaw Ridge; Community curbs
Exterior
- Parking: Attached two-car garage with automatic opener and front-facing garage door
- Utilities: Public water; Public sewer; Electric service
- Home design: Single-family residence; One story; Built in 2024
- Construction: Brick construction; Slab foundation; Shingle roof (not specified but standard — roof type not listed)
- Exterior features: Curbs and gutters; Concrete driveway; Sidewalk; Underground utilities; See remarks
Interior
- Kitchen: Dishwasher; Disposal; Microwave; Range
- Bathrooms: 2 full bathrooms
- Heating & cooling: Central electric heating; Central electric cooling
- Interior features: 9 total rooms; No fireplaces
- Laundry & utility: Electric water heater
Neighborhood map
What this means for you Summary
Snapshot
- This is a 4-bed/2.0-bath single-family listed at $339k.
Deal economics
- At list price, monthly cash flow is $-104 ($-1k/yr) — negative.
- To cash-flow at today's rent, offer at most $320k (5.4% below list).
- To meet the 1% rule (rent ≥ 1% of price), the offer needs to be $242k (28.5% below list).
- Recommended offer: $242k (28.5% below list) — sets the bar for 1% rule.
- Cap rate 5.9% vs local median 3.8% in Huntsville — top-decile yield for the area; either an underpriced asset or a hidden risk that comps aren't pricing in. Stress-test before assuming the spread holds.
Location & tenants
- Location reads 82/100 on livability (#3 in AL, #1,082 nationally) — a professional / high-income tenant draw. Strengths: commute A+, cost of living A+, housing A+; Watch: crime F.
- Huntsville City (urban): math 21% / reading 46% proficiency, ranked #48 of 129 in AL (top 37%) — families likely to look elsewhere, expect single-tenant / working-renter base with shorter leases.
- Zoned schools: Providence Elementary (math 14% / reading 42%, grade F, #385 of 627 statewide, top 62%, 848 students, 52% FRL); Williams Middle School (math 16% / reading 50%, grade F, #101 of 257 statewide, top 40%, 548 students, 58% FRL); Columbia High School (math 12% / reading 17%, grade F, #220 of 305 statewide, top 77%, 954 students, 50% FRL).
- Market conditions: Rents flat; 666 active listings in the ZIP; 23 comparable units currently listed for rent nearby; rentals at typical pace (median 25d on market — plan ~3-4 weeks tenant-placement turnaround); solid renter incomes; 494 units permitted in Limestone County in 2024 (0 in 5+ unit buildings).
Forward outlook
- Local home prices are declining (-3.0%/yr); year-one equity from $2k of loan paydown is wiped out by about $10k of value loss. Plan a longer hold.
- Limestone County population projected at +43% by 2050 — long-run rental-demand tailwind backs the buy-and-hold thesis.
Negotiation context
- Only 8 days on market — expect competitive offers; lowballing is unlikely to land.
Risks & watch-outs
- Climate carrying-cost: extreme-heat days projected 7→19/yr by 2055 (HVAC capex compounding) — expect insurance premiums to compound above CPI over the hold.
Questions for the listing agent
- What do current leases actually rent for vs. the listed asking? Can we see a recent rent roll and the last 12 months of T-12 income?
- What does the HOA fee cover, when was the last increase, and are there any pending special assessments or reserve-fund shortfalls?
- Is there a deadline driving the sale (1031 exchange, divorce, estate, relocation)? That informs how much negotiation room exists.
- Crime grade is F in this area — have there been break-ins, vandalism, or insurance claims at this property in the last 3 years? What carrier currently insures it and at what premium?
- The area grade is low — what's the realistic commute time and amenity access for the typical tenant pool here? Any planned neighborhood developments (good or bad) we should know about?
- What's the average days-on-market for RENTAL listings here right now (not sales)? A rising rental-DOM trend means longer vacancies and softer asking-rent achievability than the comps imply.
- What's the recent tenant-quality profile in this submarket — average credit score on applications, eviction rate, late-payment / NSF rate, and stable-employment percentage? A property-management company in the area should have these aggregated.
- How much new for-sale + rental construction is in the pipeline within 1–3 miles? Heavy new supply typically softens prices + rents 12–24 months out; constrained supply supports both.
Investment metrics
- 1% rule
- 0.71% ✗
- Cap rate
- 5.92%
- Cash-on-cash
- -1.32%
- DSCR
- 0.94
- GRM
- 11.7
CMA / ARV
- ARV (median comp)
- $350,622
- List price
- $338,900
- Delta
- -3.34%
- Verdict
- FAIR
- Comps
- 20 within 1.0 mi
Show comp detail 12 sales within ~0.75 mi
| Address | Dist | Beds/Ba | Sqft | Sold | Price | $/sf | Match |
|---|---|---|---|---|---|---|---|
| 15776 Mizewell Ln | 0.08mi | 4/2.0 | 2,188 (-5%) | 3mo | $350,000 | $160 | 85 |
| 29672 Robert Lee Ct | 0.24mi | 4/2.5 | 2,227 (-4%) | 1mo | $227,500 | $102 | 80 |
| 15717 Clayton Royce Dr NW | 0.42mi | 3/2.0 (-1) | 2,280 (-2%) | 3mo | $343,000 | $150 | 70 |
| 15641 Mizewell Ln NW | 0.23mi | 4/3.0 | 2,092 (-10%) | 5mo | $337,819 | $161 | 65 |
| 29635 Limestone Creek Way | 0.53mi | 3/2.5 (-1) | 2,286 (-1%) | 2mo | $377,242 | $165 | 64 |
| 29900 Thunderpaw Dr | 0.44mi | 4/2.0 | 2,536 (+10%) | 2mo | $328,000 | $129 | 62 |
| 15375 Bees St NW | 0.30mi | 5/3.0 (+1) | 2,092 (-10%) | 3mo | $325,990 | $156 | 59 |
| 29376 Canoe Cir | 0.54mi | 4/3.0 | 2,461 (+6%) | 3mo | $399,900 | $162 | 58 |
| 29794 Thunderpaw Dr | 0.37mi | 3/2.0 (-1) | 2,584 (+12%) | 1mo | $285,000 | $110 | 57 |
| 29375 Canoe Cir | 0.56mi | 4/3.0 | 2,136 (-8%) | 4mo | $348,000 | $163 | 54 |
| 29518 Crawfish Dr | 0.57mi | 4/2.5 | 2,504 (+8%) | 6mo | $379,534 | $152 | 53 |
| 29258 Crawfish Dr | 0.72mi | 3/2.0 (-1) | 2,441 (+6%) | 4mo | $389,900 | $160 | 49 |
Match score weights: distance 35% · size 25% · config 20% · recency 20%. Top-matched comps best support the ARV.
Projected returns pro-forma
-3.0% appreciation · 0.81% rent growth · sell at horizon
- IRR
- -20.7%
- Equity multiple
- 0.29×
- Total profit
- $-66,937
- Equity at exit
- $50,531
- IRR
- -18.9%
- Equity multiple
- 0.07×
- Total profit
- $-88,007
- Equity at exit
- $29,302
Cash invested: $94,892 (down + closing). Projections, not guarantees.
Landlord ↔ Tenant lean methodology
- Overall (STATE)
- 90 Strongly Landlord-Friendly
- State Alabama
- 90 Strongly Landlord-Friendly · R+15
- County
- — inherits STATE
- City
- — inherits STATE
ZIP-level market 35749
- Home prices YoY
- -5.4%
- Rents YoY
- 0.8%
- Active inventory
- 666
- Price-to-rent
- 11.7×
Monthly cashflow live
- Estimated rent
- $2,423 high interval (Pro) →
- Mortgage (P&I)
- −$1,777
- Tax from tax record
- −$87 /mo · $1,039/yr
- Insurance
- −$141
- HOA
- −$13
- Vacancy / Maint / Mgmt
- −$509
- Net cashflow
- $-104
Break-even live
Sensitivity live
| Price | -10% $88 | -5% $-8 | +0% $-104 | +5% $-200 | +10% $-296 |
|---|---|---|---|---|---|
| Rent | -10% $-296 | -5% $-200 | +0% $-104 | +5% $-8 | +10% $87 |
| Rate | -1.0pp $67 | -0.5pp $-18 | base $-104 | +0.5pp $-192 | +1.0pp $-281 |
UW: 25.0% down · 7.5% · 30yr · 1.5% tax · 5.0% vac · 8.0% maint · 8.0% mgmt
Financing live
Cash to close
- Down payment
- $84,725
- Closing costs
- $10,167
- Reserves months
- —
- Total cash needed
- —
Loan-product check · same deal, 3 products live
Conventional
25% down · 7.5% · 30yr
- Down + closing
- —
- Monthly P&I
- —
- Monthly cashflow
- —
- DSCR
- —
- Eligible?
- —
Personal DTI + credit; lowest rate.
DSCR
20% down · 8.5% · 30yr
- Down + closing
- —
- Monthly P&I
- —
- Monthly cashflow
- —
- DSCR
- —
- Eligible?
- —
No personal income docs; deal must DSCR.
Hard money
10% down · 12.0% · 12mo
- Down + closing
- —
- Monthly P&I
- —
- Monthly cashflow
- —
- DSCR
- —
- Eligible?
- —
Short-term bridge; refi at stabilization.
Rent comps 23 comps
| Address | Beds | Baths | Sqft | Rent | $/sqft | DOM | Units | Dist |
|---|---|---|---|---|---|---|---|---|
| 15818 Trey Hughes Dr Harvest, AL | 5.0 | 3.0 | 2662 | $2,822 | $1.06 | 44d | 1 | 0.30mi |
| 15980 Trey Hughes Dr Harvest, AL | 4.0 | 2.5 | 1898 | $1,686 | $0.89 | 44d | 1 | 0.35mi |
| 29873 Copper Run Dr Harvest, AL | 5.0 | 2.5 | 2966 | $2,700 | $0.91 | 15d | 1 | 0.38mi |
| 15881 Elaine Ct Unit 1250617P Harvest, AL | 3.0 | 2.0 | 2497 | $4,891 | $1.96 | 14d | 1 | 0.48mi |
| 29419 Canoe Cir NW Harvest, AL | 4.0 | 2.5 | 1964 | $2,095 | $1.07 | 24d | 1 | 0.50mi |
| 15626 Ironcrest Dr NW Harvest, AL | 4.0 | 2.0 | 1815 | $2,000 | $1.10 | 24d | 1 | 0.62mi |
| 17331 Fieldway Cir Harvest, AL | 3.0 | 2.0 | 1648 | $1,800 | $1.09 | 22d | 1 | 0.80mi |
| 30000 Abbeywood Ln Harvest, AL | 3.0 | 2.0 | 1618 | $1,600 | $0.99 | 24d | 1 | 0.93mi |
| 29889 Glenrose Way Harvest, AL | 3.0 | 2.0 | 1670 | $1,600 | $0.96 | 24d | 1 | 1.01mi |
| 14892 Smith Dr Harvest, AL | 3.0 | 2.0 | 1905 | $1,400 | $0.73 | 44d | 1 | 1.01mi |
| 14892 Smith Dr Harvest, AL | 3.0 | 2.0 | 1905 | $1,200 | $0.63 | 24d | 1 | 1.01mi |
| 192 Rosecliff Dr Harvest, AL | 5.0 | 3.0 | 3100 | $2,495 | $0.80 | 24d | 1 | 1.06mi |
| 227 Poplar Hollow Dr Harvest, AL | 4.0 | 3.0 | 2108 | $2,100 | $1.00 | 44d | 1 | 1.10mi |
| 30199 Plantation Park Dr NW Harvest, AL | 5.0 | 3.0 | 2565 | $3,000 | $1.17 | 24d | 1 | 1.10mi |
| 110 Autumn Branch Dr Madison, AL | 4.0 | 2.0 | 2515 | $2,195 | $0.87 | 14d | 1 | 1.15mi |
| 161 Autumn Branch Dr Madison, AL | 3.0 | 2.0 | 1970 | $1,750 | $0.89 | 44d | 1 | 1.22mi |
| 111 Capote Dr Harvest, AL | 4.0 | 2.0 | 2357 | $1,850 | $0.78 | 24d | 1 | 1.30mi |
| 29681 Westfield Dr Harvest, AL | 4.0 | 2.5 | 2556 | $1,874 | $0.73 | 44d | 1 | 1.36mi |
| 219 Woodgrove Dr NW Madison, AL | 4.0 | 3.0 | 2436 | $2,950 | $1.21 | 24d | 1 | 1.42mi |
| 218 Woodgrove Dr NW Madison, AL | 5.0 | 3.5 | 2879 | $3,000 | $1.04 | 44d | 1 | 1.44mi |
| 127 Frankie Ln Madison, AL | 3.0 | 2.0 | 2200 | $1,800 | $0.82 | 24d | 1 | 1.45mi |
| 14560 Water Stream Dr Madison, AL | 4.0 | 2.0 | 1932 | $1,950 | $1.01 | 14d | 1 | 1.47mi |
| 29635 Laura Ridge Dr NW Harvest, AL | 3.0 | 2.0 | 1844 | $1,850 | $1.00 | 14d | 1 | 1.50mi |
HOA detail
- Monthly dues
- $13 · $156/yr
- Likely covers
- landscaping
Listing history 2 events
-
2026-05-06status Pending 732-char remark
-
2026-04-28$338,900 Active 732-char remark
ⓘ Source: listings_history table (triggers on properties + properties_extension) + one-shot
backfill from property_details.listing_events for pre-trigger history.
Tax reassessment forecast AL · Resets to sale price
- Current annual tax
- $1,039 · $87/mo
- Projected year-2 tax
- $1,389 · $116/mo
- Expected delta
- +$350/yr (+$29/mo · 33.7%)
ⓘ Screening estimate from a state-policy table — verify with the county assessor before closing.
Climate risk First Street
- Flood 1/10 Low FEMA zone X (unshaded) · 0% chance over 30 yrs
- Wildfire 3/10 Moderate
- Heat 6/10 Major 7 d/yr ≥104°F today · 19 d/yr by 30 yrs out
- Wind 4/10 Moderate 15% chance of damaging wind over 30 yrs
- Air quality 2/10 Low 1 unhealthy d/yr today · 1 by 30 yrs out
Nearby sold comps map
Loading sold comps map…
Walkable amenities ~0.75 mi
Loading nearby amenities…
Taxation est. · year 1
- Rental income
- $29,072
- − Mortgage interest
- −$18,984
- − Property taxes
- −$1,039
- − Insurance
- −$1,694
- − Repairs & maintenance
- −$2,326
- − Management
- −$2,326
- − HOA
- −$156
- − Depreciation
- −$9,859
- Taxable loss
- −$7,312
- Est. tax savings @ 24.0%
- +$1,755
- After-tax cash flow
- $505/yr
For passive investors: Depreciation is non-cash, so a rental often shows a tax loss while cash-flowing — sheltering income. Rental losses are passive: they offset passive income freely, and up to $25,000/yr can offset ordinary (W-2) income if you actively participate and your MAGI is under $100k (phasing out to $0 by $150k); unused losses carry forward. On sale, claimed depreciation is recaptured at up to 25%, and gains may owe capital-gains tax (a 1031 exchange can defer both). Figures are a year-1 estimate at your 24.0% rate — not tax advice; consult a CPA.
Schools (NCES district)
- District
- Huntsville City
- NCES district ID
- 0101800
- Math proficiency
- 21% ▼ -23.00%
- Reading proficiency
- 46% ▬ 0.00%
- Median HH income
- $48,264
- Composite
- 28.84/100
- National rank
- #6647
- State rank
- #48 of 129 in AL
Livability — Huntsville
- Score
- 82/100
- State rank
- #3
- US rank
- #1082
Category grades
Schools grade is shown separately in the Schools card above.
Census & demographics
- Census place
- Huntsville, AL
- County
- Madison County · 380,832 people
- City population
- 220,435
- Metro
- Huntsville, AL
- Population (ZIP)
- 30,710
- Household income
- $103,901
- Rent vs Own
- Severe rent burden
- 174.0
Population outlook (Limestone County) Hauer SSP2
- Today (2025)
- 111,441 people
- By 2030
- 121,272 · +8.8%
- By 2040
- 140,705 · +26.3%
- By 2050
- 159,069 · +42.7%
- By 2075
- 202,231 · +81.5%
- By 2100
- 230,608 · +106.9%
Race, ethnicity, and origin ACS 2023
- Neighborhood character
- Diverse neighborhood (Simpson 0.56)
- Race & ethnicity
- White 60% Black 29% Two or more races 7% Hispanic / Latino 4% Asian 2%
- Common ancestry
- Italian 2% Slovak 1% Serbian 1%
- Foreign-born
- 3% · Canada, South Korea
- Languages at home
- 95% English-only · Spanish 3% Korean 1% Other Indo-European 1%
Political lean MEDSL · Limestone
- 2024 margin
- Solid R (+43.9) · D 27.5% · R 71.4% · Other 1.2%
- 2008→2024 swing
- -2.0pp toward R · 2008: -41.9pp · 2024: -43.9pp
- All cycles
- 2024: R+43.9 2020: R+42.6 2016: R+49.5 2012: R+43.6 2008: R+41.9
Not yet ingested
- Civics
- —
Market trends
- HPI YoY
- ▼ -16.54%
- Current HPI
- 291.1184
- Rent YoY
- ▲ 0.81%
- Metro
- Huntsville, AL
- State GDP YoY
- ▲ 2.94%
- F500 in state
- 4
Industry mix (Fortune 500 HQ in AL)
| Industry | F500 HQs | Revenue |
|---|---|---|
| Financial Services | 1 | $8B |
|
||
| Healthcare | 1 | $5B |
|
||
Price history
+1.8% since first listed3 events — show timeline
- 2026-06-15 Sold (MLS) $345,000 VMLS
- 2026-05-06 Pending — VMLS
- 2026-04-28 Listed $338,900 VMLS
Property tax history
+52.8%/yrLatest (2025): $1,039 · +133.4% YoY. Source: county tax records.
Cash-flow waterfall
monthlySold comps — $/sqft
last 12 mo · ≤1 miLoading sold comps…