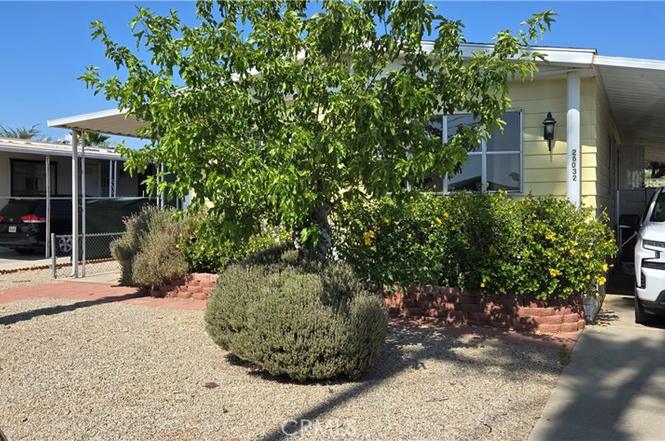
26032 Highland Palm · Homeland, CA
Flood risk No data
- FEMA flood zone
- —
- Chance of flooding over 30 yrs
- %
- Est. flood insurance / yr
- —
Fire risk No data
- Est. fire insurance / yr
- —
Heat risk No data
- Hot days now (above °F)
- days/yr
- Hot days in 30 yrs
- days/yr
Wind risk No data
- Chance of severe wind over 30 yrs
- %
Air-quality risk No data
- Unhealthy air days now
- days/yr
- Unhealthy air days in 30 yrs
- days/yr
Risk factors via First Street. Map © Google.
Why this score? — see what drove the B grade
The composite is a weighted blend of 9 inputs, each scored 0–100. Each bar is that input's sub-score; the figure is the points it added to the 100-point composite (weight × sub-score).
- Cash flow +24.3/30.0
- ARV discount +13.0/15.0
- Appreciation +10.0/10.0
- DSCR +7.8/10.0
- 1% rule +7.0/10.0
- Schools +3.7/10.0
- Rent growth +2.5/5.0
- Condition / age +2.5/5.0
- Livability +2.2/5.0
$249,999
🖨 Deal sheet 📄 Offer letter ✓ Due diligence
Listing remarks
Coming soon - This triple wide 1780 square foot home on its OWN LAND, is a flip property and seller has and is in the process of, and has done all improvements including a brand new kitchen with brand new appliance's (ie; Cabinets, Stove, Overhead Vent, Dishwasher, Sink, Garbage Disposal etc). New paint through-out. Has a huge Family room complete with a wet bar. Extra large primary/master bedroom with primary/master bath with double sinks, a soaking tub, and a separate shower as well as a walk-in closet. For our wheelchair friends, there is an electric wheelchair ramp for easy access into the home. Did we mention the clubhouse with all of its amenities, (ie; Pool, Rec Rooms, Pool Tables, C
Key facts
- 9 hole golf course
- Wet bar
- Brand new kitchen
Tags
Neighborhood map
What this means for you Summary
Snapshot
- This is a 2-bed/2.0-bath manufactured listed at $250k.
Deal economics
- At list price, monthly cash flow is $503 ($6k/yr) — positive.
- The deal already cash-flows at list — no discount required.
- Meets the 1% rule at list price ($3k rent vs $250k).
- Cap rate 8.7% vs local median 5.9% in Homeland — top-decile yield for the area; either an underpriced asset or a hidden risk that comps aren't pricing in. Stress-test before assuming the spread holds.
Location & tenants
- Location reads 45/100 on livability (#1,297 in CA) — a working-class tenant base; expect higher turnover. Strengths: housing A+; Watch: cost of living C-, health & safety C-, employment D.
- Romoland Elementary (suburban): math 35% / reading 44% proficiency, ranked #699 of 1,400 in CA (top 50%) — families likely to look elsewhere, expect single-tenant / working-renter base with shorter leases.
- Market conditions: 53 active listings in the ZIP; 1 comparable units currently listed for rent nearby; 9,195 units permitted in Riverside County in 2024 (1,512 in 5+ unit buildings).
Forward outlook
- In year one you build about $27k of equity ($2k loan paydown + $25k appreciation (10.0% local appreciation)).
- Riverside County population projected at +22% by 2050 — long-run rental-demand tailwind backs the buy-and-hold thesis.
- At projected returns (10.0% appreciation + 3.0% rent growth), your $70k cash investment doubles in ~3 years — after that, you're playing with house money.
- By year 2, paydown + projected appreciation supports a ~$43k cash-out refi (75% LTV) — recoverable capital for the next deal without selling this one.
Negotiation context
- Only 1 days on market — expect competitive offers; lowballing is unlikely to land.
Questions for the listing agent
- Built in 1972 — when were the roof, HVAC, electrical panel, plumbing, and water heater last replaced?
- What does the HOA fee cover, when was the last increase, and are there any pending special assessments or reserve-fund shortfalls?
- Is there a deadline driving the sale (1031 exchange, divorce, estate, relocation)? That informs how much negotiation room exists.
- Schools are F-rated, which usually means shorter tenancies and higher turnover. Who's the typical renter profile here, and what's been the actual vacancy rate?
- Crime grade is F in this area — have there been break-ins, vandalism, or insurance claims at this property in the last 3 years? What carrier currently insures it and at what premium?
- What's the average days-on-market for RENTAL listings here right now (not sales)? A rising rental-DOM trend means longer vacancies and softer asking-rent achievability than the comps imply.
- What's the recent tenant-quality profile in this submarket — average credit score on applications, eviction rate, late-payment / NSF rate, and stable-employment percentage? A property-management company in the area should have these aggregated.
- How much new for-sale + rental construction is in the pipeline within 1–3 miles? Heavy new supply typically softens prices + rents 12–24 months out; constrained supply supports both.
Investment metrics
- 1% rule
- 1.20% ✓
- Cap rate
- 8.71%
- Cash-on-cash
- 8.63%
- DSCR
- 1.38
- GRM
- 7.0
CMA / ARV
- ARV (on-the-fly)
- $284,800
- Comps found
- 12
Show comp detail 12 sales within ~0.75 mi
| Address | Dist | Beds/Ba | Sqft | Sold | Price | $/sf | Match |
|---|---|---|---|---|---|---|---|
| 26032 Highland Palm Dr | 0.00mi | 2/2.0 | 1,780 (0%) | 2mo | $159,000 | $89 | 98 |
| 30697 Butia Palm | 0.17mi | 2/2.0 | 1,760 (-1%) | 4mo | $249,000 | $141 | 87 |
| 30740 Palmetto Palm Ave | 0.16mi | 2/2.0 | 1,740 (-2%) | 3mo | $260,000 | $149 | 86 |
| 26171 Kentia Palm | 0.31mi | 3/2.0 (+1) | 1,800 (+1%) | 1mo | $385,000 | $214 | 78 |
| 30562 Paradise Palm Ave | 0.29mi | 2/2.0 | 1,832 (+3%) | 10mo | $219,000 | $120 | 73 |
| 26130 Fountain Palm Dr | 0.16mi | 2/2.0 | 1,624 (-9%) | 7mo | $290,000 | $179 | 72 |
| 30737 Butia Palm Ave | 0.13mi | 3/2.0 (+1) | 1,680 (-6%) | 13mo | $285,000 | $170 | 69 |
| 26148-Dr Queen Palm Dr | 0.17mi | 2/2.0 | 1,608 (-10%) | 10mo | $257,000 | $160 | 68 |
| 26049 Phoenix Palm Dr | 0.11mi | 3/2.0 (+1) | 1,620 (-9%) | 12mo | $262,500 | $162 | 65 |
| 26136 Ivory Palm Dr | 0.12mi | 2/2.0 | 1,920 (+8%) | 21mo | $290,000 | $151 | 63 |
| 31510 Wakefield Ave | 0.68mi | 2/2.0 | 1,640 (-8%) | 21mo | $250,000 | $152 | 38 |
| 25760 Juniper Flats Rd | 0.54mi | 3/2.0 (+1) | 1,582 (-11%) | 19mo | $480,000 | $303 | 35 |
Match score weights: distance 35% · size 25% · config 20% · recency 20%. Top-matched comps best support the ARV.
Projected returns pro-forma
10.0% appreciation · 3.0% rent growth · sell at horizon
- IRR
- 30.6%
- Equity multiple
- 3.40×
- Total profit
- $168,344
- Equity at exit
- $225,219
- IRR
- 26.5%
- Equity multiple
- 7.73×
- Total profit
- $470,788
- Equity at exit
- $485,693
Cash invested: $70,000 (down + closing). Projections, not guarantees.
Landlord ↔ Tenant lean methodology
- Overall (STATE)
- 18 Strongly Tenant-Friendly
- State California
- 18 Strongly Tenant-Friendly · D+13
- County
- — inherits STATE
- City
- — inherits STATE
ZIP-level market 92548
- Home prices YoY
- 16.7%
- Active inventory
- 53
- Price-to-rent
- 7.0×
Monthly cashflow live
- Estimated rent
- $2,995 medium interval (Pro) →
- Mortgage (P&I)
- −$1,311
- Tax est. 1.5%
- −$312 /mo · $3,750/yr
- Insurance
- −$104
- HOA
- −$135
- Vacancy / Maint / Mgmt
- −$629
- Net cashflow
- $503
Break-even live
UW: 25.0% down · 7.5% · 30yr · 1.5% tax · 5.0% vac · 8.0% maint · 8.0% mgmt
Financing live
Cash to close
- Down payment
- $62,500
- Closing costs
- $7,500
- Reserves months
- —
- Total cash needed
- —
Loan-product check · same deal, 3 products live
Conventional
25% down · 7.5% · 30yr
- Down + closing
- —
- Monthly P&I
- —
- Monthly cashflow
- —
- DSCR
- —
- Eligible?
- —
Personal DTI + credit; lowest rate.
DSCR
20% down · 8.5% · 30yr
- Down + closing
- —
- Monthly P&I
- —
- Monthly cashflow
- —
- DSCR
- —
- Eligible?
- —
No personal income docs; deal must DSCR.
Hard money
10% down · 12.0% · 12mo
- Down + closing
- —
- Monthly P&I
- —
- Monthly cashflow
- —
- DSCR
- —
- Eligible?
- —
Short-term bridge; refi at stabilization.
Rent comps 1 comps
| Address | Beds | Baths | Sqft | Rent | $/sqft | DOM | Units | Dist |
|---|---|---|---|---|---|---|---|---|
| 25120 Charina Ln Homeland, CA | 3.0 | 2.0 | 1782 | $2,995 | $1.68 | 1d | 1 | 0.96mi |
HOA detail
- Monthly dues
- $135 · $1,620/yr
- Likely covers
- trashelectricpool
Listing history 2 events
-
2026-06-19remarks 699-char remark
-
2026-06-19$249,999 Coming Soon 1 DOM
ⓘ Source: listings_history table (triggers on properties + properties_extension) + one-shot
backfill from property_details.listing_events for pre-trigger history.
Nearby sold comps map
Loading sold comps map…
Walkable amenities ~0.75 mi
Loading nearby amenities…
Taxation est. · year 1
- Rental income
- $35,940
- − Mortgage interest
- −$14,004
- − Property taxes
- −$3,750
- − Insurance
- −$1,250
- − Repairs & maintenance
- −$2,875
- − Management
- −$2,875
- − HOA
- −$1,620
- − Depreciation
- −$7,273
- Taxable income
- $2,293
- Est. tax owed @ 24.0%
- −$550
- After-tax cash flow
- $5,490/yr
For passive investors: Depreciation is non-cash, so a rental often shows a tax loss while cash-flowing — sheltering income. Rental losses are passive: they offset passive income freely, and up to $25,000/yr can offset ordinary (W-2) income if you actively participate and your MAGI is under $100k (phasing out to $0 by $150k); unused losses carry forward. On sale, claimed depreciation is recaptured at up to 25%, and gains may owe capital-gains tax (a 1031 exchange can defer both). Figures are a year-1 estimate at your 24.0% rate — not tax advice; consult a CPA.
Schools (NCES district)
- District
- Romoland Elementary
- NCES district ID
- 0633390
- Math proficiency
- 35% ▲ 2.00%
- Reading proficiency
- 44% ▲ 1.00%
- Median HH income
- $58,935
- Composite
- 37.36/100
- National rank
- #8931
- State rank
- #699 of 1400 in CA
Livability — Homeland
- Score
- 45/100
- State rank
- #1297
- US rank
- #26584
Category grades
Schools grade is shown separately in the Schools card above.
Census & demographics
- Census place
- Homeland, CA
- Population (ZIP)
- 6,435
Population outlook (Riverside County) Hauer SSP2
- Today (2025)
- 2,664,475 people
- By 2030
- 2,802,692 · +5.2%
- By 2040
- 3,050,904 · +14.5%
- By 2050
- 3,256,783 · +22.2%
- By 2075
- 3,655,058 · +37.2%
- By 2100
- 3,766,594 · +41.4%
Race, ethnicity, and origin ACS 2023
- Neighborhood character
- Predominantly Hispanic (65%)
- Race & ethnicity
- Hispanic / Latino 65% White 30% Two or more races 9% Native American 3% Asian 3%
- Hispanic origin (detail)
- Mexican 59% Puerto Rican 2%
- Common ancestry
- Italian 2% Lithuanian 1% Serbian 1%
- Foreign-born
- 20% · Canada, South Korea
- Languages at home
- 54% English-only · Spanish 44% Korean 1% Vietnamese 1%
Political lean MEDSL · Riverside
- 2024 margin
- Toss-up / Even · D 48.0% · R 49.3% · Other 2.6%
- 2008→2024 swing
- -3.6pp toward R · 2008: 2.3pp · 2024: -1.3pp
- All cycles
- 2024: R+1.3 2020: D+8.0 2016: D+4.3 2012: R+0.4 2008: D+2.3
Not yet ingested
- Civics
- —
Market trends
- HPI YoY
- ▲ 62.36%
- Current HPI
- 435.0222
- Rent YoY
- —
- Metro
- —
- State GDP YoY
- ▲ 3.21%
- F500 in state
- 116
Industry mix (Fortune 500 HQ in CA)
| Industry | F500 HQs | Revenue |
|---|---|---|
| Technology | 27 | $1,492B |
|
||
| Financial Services | 3 | $174B |
|
||
| Retail | 3 | $44B |
|
||
| Insurance | 3 | $26B |
|
||
| Media / Entertainment | 2 | $115B |
|
||
| Pharmaceuticals / Biotech | 2 | $62B |
|
||
Cash-flow waterfall
monthlySold comps — $/sqft
last 12 mo · ≤1 miLoading sold comps…