12025 Pierce Plz #324 · Omaha, NE
Flood risk 1/10 · Minimal
- FEMA flood zone
- X (unshaded)
- Chance of flooding over 30 yrs
- 0.0%
- Est. flood insurance / yr
- $507 – $1,088
Fire risk 1/10 · Minimal
- Est. fire insurance / yr
- $1,161 – $2,155
Heat risk 3/10 · Minor
- Hot days now (above 102°F)
- 7 days/yr
- Hot days in 30 yrs
- 16 days/yr
Wind risk 2/10 · Minimal
- Chance of severe wind over 30 yrs
- —
Air-quality risk 2/10 · Minimal
- Unhealthy air days now
- 1 days/yr
- Unhealthy air days in 30 yrs
- 1 days/yr
Risk factors via First Street. Map © Google.
Why this score? — see what drove the D- grade
The composite is a weighted blend of 9 inputs, each scored 0–100. Each bar is that input's sub-score; the figure is the points it added to the 100-point composite (weight × sub-score).
- Cash flow +8.0/30.0
- ARV discount +7.5/15.0
- 1% rule +5.7/10.0
- Livability +4.2/5.0
- Rent growth +3.0/5.0
- Condition / age +2.5/5.0
- Schools +2.1/10.0
- DSCR +2.0/10.0
- Appreciation +0.0/10.0
$160,000
🖨 Deal sheet (PDF) 📄 Offer letter ✓ Due diligence
Listing remarks
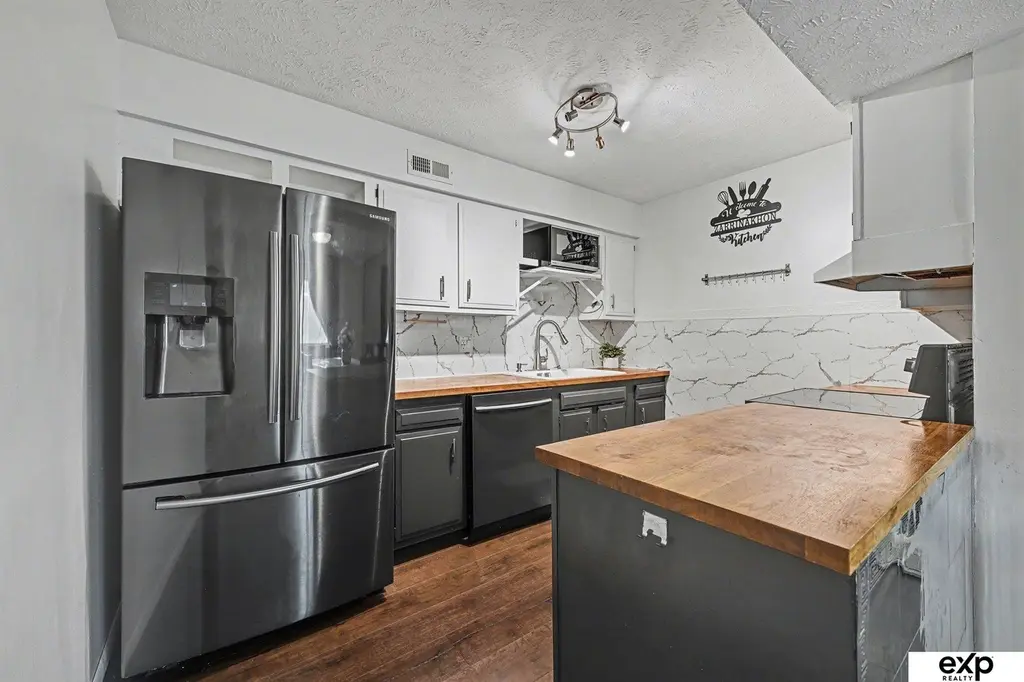
Welcome home to this beautifully maintained 3-bedroom, 2-bath condo designed for easy, low-maintenance living! Featuring stylish LVP flooring, newer carpet, and a clean, well-kept interior, this home is truly move-in ready. Enjoy summer days at the community pool while leaving the maintenance to someone else. The HOA covers pool access and maintenance, exterior insurance and exterior maintenance, lawn care, snow removal, water, and garbage service—making homeownership simple and stress-free. All appliances stay, along with the security camera system. Don't miss this opportunity to enjoy convenient living with fantastic amenities. AMA.
Key facts
- Security cameras
- Community pool
- $389 HOA
Tags
Property features AI
Finance
- HOA & community: Has association (Boardwalk Condominium); Monthly association fee of $389.10; Association covers: exterior maintenance, grounds maintenance, common area maintenance, water, trash, snow removal, pool access and pool maintenance, and management
Exterior
- Parking: No garage
- Security: Security system
- Utilities: Electricity available; Public water; Public sewer
- Home design: Residential condominium; Attached property; Flat roof; Built in 1966; Single-level living (all main-floor rooms listed)
- Construction: Brick construction; Block foundation
- Exterior features: Deck; City lot
Interior
- Kitchen: Range; Refrigerator; Dishwasher; Microwave; Garbage disposal
- Bedrooms: Primary bedroom on the main floor (approx. 11.05 x 14); Second bedroom on the main floor (approx. 9.08 x 12); Third bedroom on the main floor (approx. 9.09 x 11.1)
- Flooring: Engineered wood; Luxury vinyl plank
- Bathrooms: Two bathrooms total: one full bath and one three-quarter master bath (both on the main floor)
- Heating & cooling: Electric forced air heating; Central air conditioning
- Interior features: No fireplace; Security system
- Laundry & utility: Washer; Dryer
Neighborhood map
What this means for you Summary
Snapshot
- This is a 3-bed/2.0-bath condo listed at $160k.
Deal economics
- At list price, monthly cash flow is $-164 ($-2k/yr) — negative.
- To cash-flow at today's rent, offer at most $131k (18.1% below list).
- Meets the 1% rule at list price ($2k rent vs $160k).
- Recommended offer: $131k (18.1% below list) — sets the bar for cash-flow.
- Cap rate 5.1% vs local median 3.6% in Omaha — top-decile yield for the area; either an underpriced asset or a hidden risk that comps aren't pricing in. Stress-test before assuming the spread holds.
Location & tenants
- Location reads 84/100 on livability (#7 in NE, #663 nationally) — a professional / high-income tenant draw. Strengths: amenities A+, commute A+, cost of living A+; Watch: crime F.
- Omaha Public Schools (urban): math 20% / reading 28% proficiency, ranked #110 of 111 in NE (top 99%) — low school quality limits family demand, transient renter base, plan for 1-2y turnover; 62% free/reduced lunch — lower-income household profile, screen leases tightly.
- Zoned schools: Crestridge Magnet Center (math 32% / reading 47%, grade F, #346 of 502 statewide, top 74%, 384 students, 0% FRL); Beveridge Magnet Middle School (math 27% / reading 37%, grade F, #107 of 128 statewide, top 84%, 816 students, 0% FRL); Burke High School (math 28% / reading 38%, grade F, #226 of 261 statewide, top 87%, 1,915 students, 0% FRL) — zoned schools average 0% FRL vs 62% district-wide (62 pts lower); this property's tenant base skews higher-income than the district average.
- Market conditions: Rents rising (+1.9%/yr); 112 active listings in the ZIP; 11 comparable units currently listed for rent nearby; rentals leasing fast (median 5d on market — plan ~1-2 weeks tenant-placement turnaround); solid renter incomes; 4,539 units permitted in Douglas County in 2024 (2,583 in 5+ unit buildings).
Forward outlook
- Local home prices are declining (-3.0%/yr); year-one equity from $1k of loan paydown is wiped out by about $5k of value loss. Plan a longer hold.
- Douglas County population projected at +28% by 2050 — long-run rental-demand tailwind backs the buy-and-hold thesis.
Negotiation context
- It's been on market 18 days — a 2% lower offer ($158k) is reasonable based on typical stale-listing flexibility.
- 8 sale attempts since 20y ago with the ask held roughly flat each time — persistent listings suggest the price (not the market) is what's stuck; bring a comps-based counter.
Risks & watch-outs
- Watch-outs: HOA is 23% of rent.
Questions for the listing agent
- What do current leases actually rent for vs. the listed asking? Can we see a recent rent roll and the last 12 months of T-12 income?
- Built in 1966 — when were the roof, HVAC, electrical panel, plumbing, and water heater last replaced?
- What does the HOA fee cover, when was the last increase, and are there any pending special assessments or reserve-fund shortfalls?
- Any open or pending special assessments — roof, HVAC, plumbing, elevator, façade? What's the per-unit balance and payoff schedule, and is the seller paying it off at close or rolling it to the buyer?
- Is there a deadline driving the sale (1031 exchange, divorce, estate, relocation)? That informs how much negotiation room exists.
- Crime grade is F in this area — have there been break-ins, vandalism, or insurance claims at this property in the last 3 years? What carrier currently insures it and at what premium?
- The area grade is low — what's the realistic commute time and amenity access for the typical tenant pool here? Any planned neighborhood developments (good or bad) we should know about?
- What's the average days-on-market for RENTAL listings here right now (not sales)? A rising rental-DOM trend means longer vacancies and softer asking-rent achievability than the comps imply.
- What's the recent tenant-quality profile in this submarket — average credit score on applications, eviction rate, late-payment / NSF rate, and stable-employment percentage? A property-management company in the area should have these aggregated.
- How much new apartment / multifamily construction is in the pipeline within 1–3 miles? Heavy new supply (>2% of stock underway) typically softens rents 12–24 months out; light construction supports rent growth.
Investment metrics
- 1% rule
- 1.07% ✓
- Cap rate
- 5.06%
- Cash-on-cash
- -4.39%
- DSCR
- 0.80
- GRM
- 7.8
CMA / ARV
No comps found within radius.
Projected returns pro-forma
-3.0% appreciation · 1.95% rent growth · sell at horizon
- IRR
- -25.2%
- Equity multiple
- 0.15×
- Total profit
- $-37,872
- Equity at exit
- $23,857
- IRR
- -25.6%
- Equity multiple
- -0.17×
- Total profit
- $-52,471
- Equity at exit
- $13,834
Cash invested: $44,800 (down + closing). Projections, not guarantees.
Landlord ↔ Tenant lean methodology
- Overall (STATE)
- 83 Strongly Landlord-Friendly
- State Nebraska
- 83 Strongly Landlord-Friendly · R+13
- County
- — inherits STATE
- City
- — inherits STATE
ZIP-level market 68144
- Rents YoY
- 1.9%
- Active inventory
- 112
- Price-to-rent
- 7.8×
Monthly cashflow live
- Estimated rent
- $1,710 high interval (Pro) →
- Mortgage (P&I)
- −$839
- Tax from tax record
- −$220 /mo · $2,644/yr
- Insurance
- −$67
- HOA
- −$389
- Vacancy / Maint / Mgmt
- −$359
- Net cashflow
- $-164
Break-even live
Sensitivity live
| Price | -10% $-73 | -5% $-119 | +0% $-164 | +5% $-209 | +10% $-254 |
|---|---|---|---|---|---|
| Rent | -10% $-299 | -5% $-231 | +0% $-164 | +5% $-96 | +10% $-29 |
| Rate | -1.0pp $-83 | -0.5pp $-123 | base $-164 | +0.5pp $-205 | +1.0pp $-247 |
UW: 25.0% down · 7.5% · 30yr · 1.5% tax · 5.0% vac · 8.0% maint · 8.0% mgmt
Financing live
Cash to close
- Down payment
- $40,000
- Closing costs
- $4,800
- Reserves months
- —
- Total cash needed
- —
Loan-product check · same deal, 3 products live
Conventional
25% down · 7.5% · 30yr
- Down + closing
- —
- Monthly P&I
- —
- Monthly cashflow
- —
- DSCR
- —
- Eligible?
- —
Personal DTI + credit; lowest rate.
DSCR
20% down · 8.5% · 30yr
- Down + closing
- —
- Monthly P&I
- —
- Monthly cashflow
- —
- DSCR
- —
- Eligible?
- —
No personal income docs; deal must DSCR.
Hard money
10% down · 12.0% · 12mo
- Down + closing
- —
- Monthly P&I
- —
- Monthly cashflow
- —
- DSCR
- —
- Eligible?
- —
Short-term bridge; refi at stabilization.
Rent comps 11 comps
| Address | Beds | Baths | Sqft | Rent | $/sqft | DOM | Units | Dist |
|---|---|---|---|---|---|---|---|---|
| 13110 Sterling Ridge Dr Omaha, NE | 1.0–2.0 | 1.0–2.0 | 894 | $4,048 | $4.53 | 4d | 21 | 0.82mi |
| 11510 Farnam St Omaha, NE | 3.0 | 2.5 | 1646 | $2,250 | $1.37 | 45d | 1 | 0.83mi |
| 11510 Farnam St Omaha, NE | 3.0 | 2.5 | 1646 | $2,250 | $1.37 | 12d | 1 | 0.83mi |
| 11718 Arbor St Unit 2 Omaha, NE | 2.0 | 2.0 | 1000 | $1,200 | $1.20 | 45d | 1 | 0.84mi |
| 11706 Arbor St Omaha, NE | 2.0 | 2.0 | 1000 | $1,200 | $1.20 | 45d | 1 | 0.85mi |
| 11766 Wakeley Plz Omaha, NE | 1.0–3.0 | 1.0–3.0 | 1380 | $1,840 | $1.33 | 4d | 26 | 0.97mi |
| 11611 Westwood Ln Omaha, NE | 3.0 | 2.0 | 1760 | $1,804 | $1.02 | 4d | 1 | 1.16mi |
| 12500 W Dodge Rd Omaha, NE | 1.0–3.0 | 1.0–2.0 | 1188 | $3,330 | $2.80 | 4d | 25 | 1.17mi |
| 13407 Montclair Dr Omaha, NE | 1.0–2.0 | 1.0 | 865 | $1,003 | $1.16 | 4d | 2 | 1.33mi |
| 10506 Pacific St Omaha, NE | 1.0–3.0 | 1.0–2.5 | 1295 | $2,855 | $2.20 | 4d | 29 | 1.36mi |
| 12418 Burt Plz Omaha, NE | 1.0–2.0 | 1.0–2.0 | 919 | $1,075 | $1.17 | 4d | 9 | 1.38mi |
HOA detail condo
- Monthly dues
- $389 · $4,668/yr
- Likely covers
- watertrashlandscapingsnow removalexterior maint.poolsecurity
- Assessments
- None detected in remarks — confirm with the listing agent.
Listing history 31 events
-
2026-06-21days on market $160,000 Active 18 DOM
-
2026-06-18days on market $160,000 Active 15 DOM
-
2026-06-17days on market $160,000 Active 14 DOM
-
2026-06-16days on market $160,000 Active 13 DOM
-
2026-06-15days on market $160,000 Active 12 DOM
-
2026-06-13days on market $160,000 Active 10 DOM
-
2026-06-10days on market $160,000 Active 7 DOM
-
2026-06-09days on market $160,000 Active 6 DOM
-
2026-06-08statusdays on market $160,000 Active 5 DOM
-
2026-06-07remarks 642-char remark
-
2026-06-07days on market $160,000 New 4 DOM
-
2026-06-03pricestatusdays on market $160,000 New 1 DOM
-
2026-06-03days on market $165,000 Active 33 DOM
-
2026-06-01days on market $165,000 Active 32 DOM
-
2026-06-01days on market $165,000 Active 31 DOM
-
2026-04-30$165,000 New 378-char remark
-
2026-04-30historical
-
2026-03-23$167,000 New
-
2024-10-18soldstatus $157,000 Sold
-
2024-09-24status Pending
-
2024-09-19$165,000 New
-
2013-05-28soldstatus $70,000
-
2013-05-24soldstatus $70,000
-
2013-04-03historical
-
2013-01-09$69,900
-
2012-12-31historical
-
2012-06-26$69,900
-
2009-03-06historical
-
2008-09-27$79,500
-
2006-09-20historical
-
2006-04-20$81,500
ⓘ Source: listings_history table (triggers on properties + properties_extension) + one-shot
backfill from property_details.listing_events for pre-trigger history.
Tax reassessment forecast NE · Resets to sale price
- Current annual tax
- $2,644 · $220/mo
- Projected year-2 tax
- $2,768 · $231/mo
- Expected delta
- +$124/yr (+$10/mo · 4.7%)
ⓘ Screening estimate from a state-policy table — verify with the county assessor before closing.
Climate risk First Street
- Flood 1/10 Low FEMA zone X (unshaded) · 0% chance over 30 yrs
- Wildfire 1/10 Low
- Heat 3/10 Moderate 7 d/yr ≥102°F today · 16 d/yr by 30 yrs out
- Wind 2/10 Low
- Air quality 2/10 Low 1 unhealthy d/yr today · 1 by 30 yrs out
Nearby sold comps map
Loading sold comps map…
Walkable amenities ~0.75 mi
Loading nearby amenities…
Taxation est. · year 1
- Rental income
- $20,525
- − Mortgage interest
- −$8,962
- − Property taxes
- −$2,644
- − Insurance
- −$800
- − Repairs & maintenance
- −$1,642
- − Management
- −$1,642
- − HOA
- −$4,668
- − Depreciation
- −$4,655
- Taxable loss
- −$4,488
- Est. tax savings @ 24.0%
- +$1,077
- After-tax cash flow
- $-889/yr
For passive investors: Depreciation is non-cash, so a rental often shows a tax loss while cash-flowing — sheltering income. Rental losses are passive: they offset passive income freely, and up to $25,000/yr can offset ordinary (W-2) income if you actively participate and your MAGI is under $100k (phasing out to $0 by $150k); unused losses carry forward. On sale, claimed depreciation is recaptured at up to 25%, and gains may owe capital-gains tax (a 1031 exchange can defer both). Figures are a year-1 estimate at your 24.0% rate — not tax advice; consult a CPA.
Schools (NCES district)
- District
- Omaha Public Schools
- NCES district ID
- 3174820
- Math proficiency
- 20% ▼ -10.00%
- Reading proficiency
- 28% ▼ -5.00%
- Median HH income
- $46,039
- Composite
- 20.83/100
- National rank
- #8502
- State rank
- #110 of 111 in NE
Livability — Omaha
- Score
- 84/100
- State rank
- #7
- US rank
- #663
Category grades
Schools grade is shown separately in the Schools card above.
Census & demographics
- Census place
- Omaha, NE
- County
- Douglas County · 538,646 people
- City population
- 552,986
- Metro
- Omaha-Council Bluffs, NE-IA
- Population (ZIP)
- 25,732
- Household income
- $83,576
- Rent vs Own
- Severe rent burden
- 1113.0
Population outlook (Douglas County) Hauer SSP2
- Today (2025)
- 625,245 people
- By 2030
- 661,613 · +5.8%
- By 2040
- 732,395 · +17.1%
- By 2050
- 801,988 · +28.3%
- By 2075
- 968,637 · +54.9%
- By 2100
- 1,101,871 · +76.2%
Race, ethnicity, and origin ACS 2023
- Neighborhood character
- Predominantly White (84%)
- Race & ethnicity
- White 84% Hispanic / Latino 7% Two or more races 6% Black 3% Asian 2%
- Hispanic origin (detail)
- Mexican 4%
- Common ancestry
- Romanian 4% Slovak 4% Portuguese 2%
- Foreign-born
- 5% · Canada, United Kingdom, South Korea
- Languages at home
- 92% English-only · Spanish 3% Arabic 1% Other Indo-European 1%
Political lean MEDSL · Douglas
- 2024 margin
- D (+10.2) · D 54.4% · R 44.2% · Other 1.4%
- 2008→2024 swing
- +5.5pp toward D · 2008: 4.6pp · 2024: 10.2pp
- All cycles
- 2024: D+10.2 2020: D+11.3 2016: D+1.4 2012: R+4.3 2008: D+4.6
Not yet ingested
- Civics
- —
Market trends
- HPI YoY
- ▼ -228.19%
- Current HPI
- 249.064
- Rent YoY
- ▲ 1.95%
- Metro
- Omaha-Council Bluffs, NE-IA
- State GDP YoY
- ▲ 0.68%
- F500 in state
- 2
Industry mix (Fortune 500 HQ in NE)
| Industry | F500 HQs | Revenue |
|---|---|---|
| Conglomerate | 1 | $371B |
|
||
Price history
+96.3% since first listed18 events — show timeline
- 2026-06-03 Listing Removed — GPRMLS
- 2026-06-03 Listed $160,000 GPRMLS
- 2026-04-30 Listing Removed — GPRMLS
- 2026-04-30 Listed $165,000 GPRMLS
- 2026-03-23 Listed $167,000 GPRMLS
- 2024-10-18 Sold (MLS) $157,000 GPRMLS
- 2024-09-24 Pending — GPRMLS
- 2024-09-19 Listed $165,000 GPRMLS
- 2013-05-28 Sold (Public Records) $70,000 Public Records
- 2013-05-24 Sold (MLS) $70,000 GPRMLS
- 2013-04-03 Listing Removed — GPRMLS
- 2013-01-09 Listed $69,900 GPRMLS
- 2012-12-31 Listing Removed — GPRMLS
- 2012-06-26 Listed $69,900 GPRMLS
- 2009-03-06 Listing Removed — GPRMLS
- 2008-09-27 Listed $79,500 GPRMLS
- 2006-09-20 Listing Removed — GPRMLS
- 2006-04-20 Listed $81,500 GPRMLS
Property tax history
+5.8%/yrLatest (2025): $2,644 · -3.5% YoY. Source: county tax records.
Cash-flow waterfall
monthlySold comps — $/sqft
last 12 mo · ≤1 miLoading sold comps…