2628 High Top Rd · Shenandoah Farms, VA
Flood risk 1/10 · Minimal
- FEMA flood zone
- X (unshaded)
- Chance of flooding over 30 yrs
- 0.0%
- Est. flood insurance / yr
- $473 – $860
Fire risk 5/10 · Moderate
- Est. fire insurance / yr
- $666 – $1,236
Heat risk 3/10 · Minor
- Hot days now (above 99°F)
- 6 days/yr
- Hot days in 30 yrs
- 12 days/yr
Wind risk 2/10 · Minimal
- Chance of severe wind over 30 yrs
- 2.0%
Air-quality risk 1/10 · Minimal
- Unhealthy air days now
- 0 days/yr
- Unhealthy air days in 30 yrs
- 0 days/yr
Risk factors via First Street. Map © Google.
Why this score? — see what drove the C- grade
The composite is a weighted blend of 9 inputs, each scored 0–100. Each bar is that input's sub-score; the figure is the points it added to the 100-point composite (weight × sub-score).
- ARV discount +15.0/15.0
- Appreciation +10.0/10.0
- Cash flow +8.5/30.0
- Schools +4.9/10.0
- Livability +3.0/5.0
- Rent growth +2.5/5.0
- Condition / age +2.5/5.0
- DSCR +2.3/10.0
- 1% rule +1.8/10.0
$274,900
🖨 Deal sheet (PDF) 📄 Offer letter ✓ Due diligence
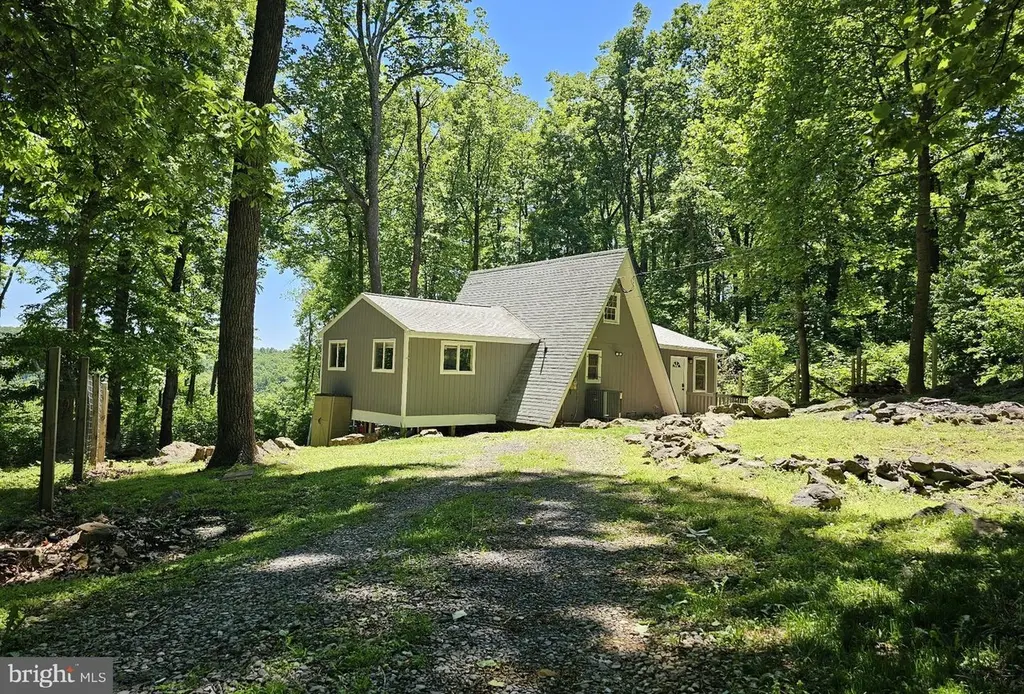
Listing remarks
Discover your dream retreat in the serene Shen Farms community! This charming A-Frame home offers a perfect blend of modern comfort and rustic charm. With 1,102 sq. ft. of thoughtfully designed living space, this 2-bedroom, 1-bathroom gem is ideal for those seeking tranquility and style. Nestled on a generous wooded 0.46-acre lot, the property boasts ample outdoor space for gardening, entertaining, or simply enjoying nature. The view of your back deck for your morning coffee near the Shenandoah mountains are breathtaking. Inside, the open layout invites natural light, creating a welcoming atmosphere. The versatile attic loft offers endless possibilities-transform it into a cozy den, a home
Key facts
- Detached structure
- Wooded lot
- Wood siding exterior
Tags
Property features AI
Finance
- Other: Ownership is fee simple
- HOA & community: HOA fee $295 annually
Exterior
- Parking: Driveway
- Utilities: Well water; On-site septic; Cable internet available; Cable TV available; Phone service available; Electric service available; Propane available
- Home design: Detached property; Estimated year built; Above-grade finished living area reported
- Construction: Wood siding exterior; Crawl space foundation; Above-grade and below-grade other structures
- Exterior features: Not located in a federal flood zone; Tidal water not present
Interior
- Bedrooms: 2 bedrooms on the main level
- Bathrooms: 1 full bathroom on the main level
- Heating & cooling: Heat pump heating; Central air conditioning; Electric heating and cooling; Electric hot water
- Interior features: Basement present (other type)
Neighborhood map
What this means for you Summary
Snapshot
- This is a 2-bed/1.0-bath single-family listed at $275k.
Deal economics
- At list price, monthly cash flow is $-241 ($-3k/yr) — negative.
- To cash-flow at today's rent, offer at most $232k (15.5% below list).
- To meet the 1% rule (rent ≥ 1% of price), the offer needs to be $186k (32.3% below list).
- Recommended offer: $186k (32.3% below list) — sets the bar for 1% rule.
- Cap rate 5.2% vs local median 2.8% in Shenandoah Farms — top-decile yield for the area; either an underpriced asset or a hidden risk that comps aren't pricing in. Stress-test before assuming the spread holds.
Location & tenants
- Location reads 60/100 on livability (#440 in VA) — a middle-class / working-renter tenant base. Strengths: crime A+, housing A+, employment A-; Watch: amenities F, commute F, health & safety F.
- Warren County Public School District (town): math 49% / reading 64% proficiency, ranked #70 of 131 in VA (top 53%) — acceptable for families but not a draw, mixed tenant base, ~2y average lease.
- Zoned schools: Hilda J. Barbour Elementary (math 57% / reading 57%, grade C+, #597 of 1,108 statewide, top 57%, 469 students, 66% FRL); Warren County High (math 82% / reading 82%, grade A, #40 of 319 statewide, top 15%, 833 students, 65% FRL) — zoned schools average 66% FRL vs 34% district-wide (31 pts higher); higher-poverty schools than district average — tighter screening recommended.
- Zoned-school proficiency averages 70% at this address vs 56% district-wide (+13 pts) — the actual schools serving this property are materially stronger than the Warren County Public School District average implies; a family-tenant draw the district grade alone would hide.
- Market conditions: 61 active listings in the ZIP; 170 units permitted in Warren County in 2024 (0 in 5+ unit buildings).
Forward outlook
- In year one you build about $29k of equity ($2k loan paydown + $27k appreciation (10.0% local appreciation)).
- Warren County population projected at +8% by 2050 — modest demand growth; plan on rents tracking national, not racing it.
- By year 2, paydown + projected appreciation supports a ~$47k cash-out refi (75% LTV) — recoverable capital for the next deal without selling this one.
Negotiation context
- It's been on market 20 days — a 2% lower offer ($271k) is reasonable based on typical stale-listing flexibility.
- 5 sale attempts since 8y ago with the ask held roughly flat each time — persistent listings suggest the price (not the market) is what's stuck; bring a comps-based counter.
- Current owner paid $157k; list at $275k implies a 75% gain — meaningful room to come down on a strong offer.
Risks & watch-outs
- Climate carrying-cost: moderate wildfire risk — expect insurance premiums to compound above CPI over the hold.
Questions for the listing agent
- What do current leases actually rent for vs. the listed asking? Can we see a recent rent roll and the last 12 months of T-12 income?
- What does the HOA fee cover, when was the last increase, and are there any pending special assessments or reserve-fund shortfalls?
- Is there a deadline driving the sale (1031 exchange, divorce, estate, relocation)? That informs how much negotiation room exists.
- Schools are F-rated, which usually means shorter tenancies and higher turnover. Who's the typical renter profile here, and what's been the actual vacancy rate?
- What's the average days-on-market for RENTAL listings here right now (not sales)? A rising rental-DOM trend means longer vacancies and softer asking-rent achievability than the comps imply.
- What's the recent tenant-quality profile in this submarket — average credit score on applications, eviction rate, late-payment / NSF rate, and stable-employment percentage? A property-management company in the area should have these aggregated.
- How much new for-sale + rental construction is in the pipeline within 1–3 miles? Heavy new supply typically softens prices + rents 12–24 months out; constrained supply supports both.
Investment metrics
- 1% rule
- 0.68% ✗
- Cap rate
- 5.24%
- Cash-on-cash
- -3.76%
- DSCR
- 0.83
- GRM
- 12.3
CMA / ARV
- ARV (on-the-fly)
- $378,108
- Comps found
- 2
Show comp detail 2 sales within ~0.75 mi
| Address | Dist | Beds/Ba | Sqft | Sold | Price | $/sf | Match |
|---|---|---|---|---|---|---|---|
| 47 Freeze Rd | 0.25mi | 2/1.0 | 840 (-14%) | 3mo | $327,000 | $389 | 64 |
| 1664 High Top Rd | 0.58mi | 2/1.0 | 912 (-6%) | 21mo | $205,000 | $225 | 45 |
Match score weights: distance 35% · size 25% · config 20% · recency 20%. Top-matched comps best support the ARV.
Projected returns pro-forma
10.0% appreciation · 3.0% rent growth · sell at horizon
- IRR
- 21.6%
- Equity multiple
- 2.74×
- Total profit
- $134,285
- Equity at exit
- $247,652
- IRR
- 19.5%
- Equity multiple
- 6.29×
- Total profit
- $407,340
- Equity at exit
- $534,070
Cash invested: $76,972 (down + closing). Projections, not guarantees.
Landlord ↔ Tenant lean methodology
- Overall (STATE)
- 55 Moderately Landlord-Leaning
- State Virginia
- 55 Moderately Landlord-Leaning · D+2
- County
- — inherits STATE
- City
- — inherits STATE
ZIP-level market 22642
- Home prices YoY
- 10.6%
- Active inventory
- 61
- Price-to-rent
- 12.3×
Monthly cashflow live
- Estimated rent
- $1,861 medium interval (Pro) →
- Mortgage (P&I)
- −$1,442
- Tax from tax record
- −$130 /mo · $1,562/yr
- Insurance
- −$115
- HOA
- −$25
- Vacancy / Maint / Mgmt
- −$391
- Net cashflow
- $-241
Break-even live
Sensitivity live
| Price | -10% $-85 | -5% $-163 | +0% $-241 | +5% $-319 | +10% $-397 |
|---|---|---|---|---|---|
| Rent | -10% $-388 | -5% $-314 | +0% $-241 | +5% $-167 | +10% $-94 |
| Rate | -1.0pp $-102 | -0.5pp $-171 | base $-241 | +0.5pp $-312 | +1.0pp $-385 |
UW: 25.0% down · 7.5% · 30yr · 1.5% tax · 5.0% vac · 8.0% maint · 8.0% mgmt
Financing live
Cash to close
- Down payment
- $68,725
- Closing costs
- $8,247
- Reserves months
- —
- Total cash needed
- —
Loan-product check · same deal, 3 products live
Conventional
25% down · 7.5% · 30yr
- Down + closing
- —
- Monthly P&I
- —
- Monthly cashflow
- —
- DSCR
- —
- Eligible?
- —
Personal DTI + credit; lowest rate.
DSCR
20% down · 8.5% · 30yr
- Down + closing
- —
- Monthly P&I
- —
- Monthly cashflow
- —
- DSCR
- —
- Eligible?
- —
No personal income docs; deal must DSCR.
Hard money
10% down · 12.0% · 12mo
- Down + closing
- —
- Monthly P&I
- —
- Monthly cashflow
- —
- DSCR
- —
- Eligible?
- —
Short-term bridge; refi at stabilization.
HOA detail
- Monthly dues
- $25 · $300/yr
Listing history 13 events
-
2026-06-21days on market $274,900 Active 20 DOM
-
2026-06-18days on market $274,900 Active 17 DOM
-
2026-06-17days on market $274,900 Active 16 DOM
-
2026-06-16pricedays on market $274,900 Active 15 DOM
-
2026-06-15days on market $289,000 Active 14 DOM
-
2026-06-13days on market $289,000 Active 12 DOM
-
2026-06-09days on market $289,000 Active 8 DOM
-
2026-06-08days on market $289,000 Active 7 DOM
-
2026-06-07days on market $289,000 Active 6 DOM
-
2026-06-04days on market $289,000 Active 3 DOM
-
2026-06-03days on market $289,000 Active 2 DOM
-
2026-06-02remarks 699-char remark
-
2026-06-02$289,000 Active 1 DOM
ⓘ Source: listings_history table (triggers on properties + properties_extension) + one-shot
backfill from property_details.listing_events for pre-trigger history.
Tax reassessment forecast VA · Resets to sale price
- Current annual tax
- $1,562 · $130/mo
- Projected year-2 tax
- $2,254 · $188/mo
- Expected delta
- +$692/yr (+$58/mo · 44.3%)
ⓘ Screening estimate from a state-policy table — verify with the county assessor before closing.
Climate risk First Street
- Flood 1/10 Low FEMA zone X (unshaded) · 0% chance over 30 yrs
- Wildfire 5/10 Major
- Heat 3/10 Moderate 6 d/yr ≥99°F today · 12 d/yr by 30 yrs out
- Wind 2/10 Low 2% chance of damaging wind over 30 yrs
- Air quality 1/10 Low 0 unhealthy d/yr today · 0 by 30 yrs out
Nearby sold comps map
Loading sold comps map…
Walkable amenities ~0.75 mi
Loading nearby amenities…
Taxation est. · year 1
- Rental income
- $22,335
- − Mortgage interest
- −$15,399
- − Property taxes
- −$1,562
- − Insurance
- −$1,374
- − Repairs & maintenance
- −$1,787
- − Management
- −$1,787
- − HOA
- −$300
- − Depreciation
- −$7,997
- Taxable loss
- −$7,871
- Est. tax savings @ 24.0%
- +$1,889
- After-tax cash flow
- $-1,002/yr
For passive investors: Depreciation is non-cash, so a rental often shows a tax loss while cash-flowing — sheltering income. Rental losses are passive: they offset passive income freely, and up to $25,000/yr can offset ordinary (W-2) income if you actively participate and your MAGI is under $100k (phasing out to $0 by $150k); unused losses carry forward. On sale, claimed depreciation is recaptured at up to 25%, and gains may owe capital-gains tax (a 1031 exchange can defer both). Figures are a year-1 estimate at your 24.0% rate — not tax advice; consult a CPA.
Schools (NCES district)
- District
- Warren County Public School District
- NCES district ID
- 5103870
- Math proficiency
- 49% ▼ -29.00%
- Reading proficiency
- 64% ▼ -10.00%
- Median HH income
- $61,504
- Composite
- 49.22/100
- National rank
- #2039
- State rank
- #70 of 131 in VA
Livability — Shenandoah Farms
- Score
- 60/100
- State rank
- #440
- US rank
- #18845
Category grades
Schools grade is shown separately in the Schools card above.
Census & demographics
- Population (ZIP)
- 4,130
Population outlook (Warren County) Hauer SSP2
- Today (2025)
- 42,045 people
- By 2030
- 43,257 · +2.9%
- By 2040
- 45,088 · +7.2%
- By 2050
- 45,567 · +8.4%
- By 2075
- 46,081 · +9.6%
- By 2100
- 42,093 · +0.1%
Race, ethnicity, and origin ACS 2023
- Neighborhood character
- Predominantly White (79%)
- Race & ethnicity
- White 79% Hispanic / Latino 10% Two or more races 9% Black 3%
- Hispanic origin (detail)
- Mexican 2%
- Common ancestry
- Slovak 7% Italian 6% Lithuanian 2%
- Foreign-born
- 7% · Canada
- Languages at home
- 95% English-only · Spanish 4%
Political lean MEDSL · Warren
- 2024 margin
- Solid R (+37.6) · D 30.6% · R 68.3% · Other 1.1%
- 2008→2024 swing
- -26.0pp toward R · 2008: -11.7pp · 2024: -37.6pp
- All cycles
- 2024: R+37.6 2020: R+35.3 2016: R+37.1 2012: R+20.5 2008: R+11.7
Not yet ingested
- Civics
- —
Market trends
- HPI YoY
- ▲ 41.77%
- Current HPI
- 437.0062
- Rent YoY
- —
- Metro
- —
- State GDP YoY
- ▲ 2.40%
- F500 in state
- 50
Industry mix (Fortune 500 HQ in VA)
| Industry | F500 HQs | Revenue |
|---|---|---|
| Aerospace / Defense | 4 | $236B |
|
||
| Technology / Defense | 3 | $32B |
|
||
| Financial Services | 2 | $176B |
|
||
| Utilities | 2 | $27B |
|
||
| Insurance | 2 | $25B |
|
||
| Technology | 2 | $15B |
|
||
Price history
+92.8% since first listed18 events — show timeline
- 2026-06-01 Listed $289,000 BRIGHT MLS
- 2020-07-31 Sold (Public Records) $156,700 Public Records
- 2020-07-27 Sold (MLS) $156,700 BRIGHT MLS
- 2020-07-10 Pending — BRIGHT MLS
- 2020-06-24 Contingent — BRIGHT MLS
- 2020-06-17 Listed $159,900 BRIGHT MLS
- 2019-07-01 Listing Removed — BRIGHT MLS
- 2019-05-23 Price Changed $160,000 BRIGHT MLS
- 2019-05-07 Listed $165,000 BRIGHT MLS
- 2018-08-22 Sold (Public Records) $146,000 Public Records
- 2018-08-21 Price Changed $149,000 BRIGHT MLS
- 2018-08-21 Price Changed $149,000 MRIS
- 2018-08-20 Sold (MLS) $146,000 MRIS
- 2018-08-20 Sold (MLS) $146,000 BRIGHT MLS
- 2018-07-14 Contingent — BRIGHT MLS
- 2018-07-14 Pending — MRIS
- 2018-07-10 Listed $149,900 MRIS
- 2018-07-10 Listed $149,900 BRIGHT MLS
Property tax history
+6.8%/yrLatest (2026): $1,562 · +18.8% YoY. Source: county tax records.
Cash-flow waterfall
monthlySold comps — $/sqft
last 12 mo · ≤1 miLoading sold comps…