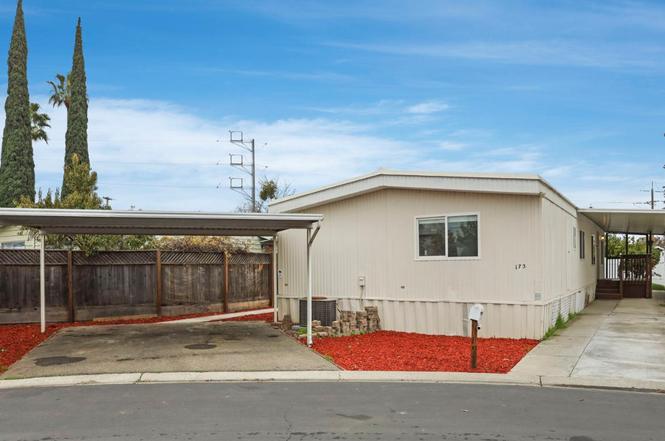
2929 N Macarthur Dr #173 · Tracy, CA
Flood risk 1/10 · Minimal
- FEMA flood zone
- X (unshaded)
- Chance of flooding over 30 yrs
- 0.0%
- Est. flood insurance / yr
- $507 – $1,088
Fire risk 2/10 · Minimal
- Est. fire insurance / yr
- $659 – $1,223
Heat risk 6/10 · Moderate
- Hot days now (above 103°F)
- 7 days/yr
- Hot days in 30 yrs
- 15 days/yr
Wind risk 1/10 · Minimal
- Chance of severe wind over 30 yrs
- —
Air-quality risk 10/10 · Severe
- Unhealthy air days now
- 25 days/yr
- Unhealthy air days in 30 yrs
- 26 days/yr
Risk factors via First Street. Map © Google.
Why this score? — see what drove the C+ grade
The composite is a weighted blend of 9 inputs, each scored 0–100. Each bar is that input's sub-score; the figure is the points it added to the 100-point composite (weight × sub-score).
- Cash flow +27.4/30.0
- DSCR +9.5/10.0
- 1% rule +7.4/10.0
- ARV discount +4.9/15.0
- Rent growth +3.3/5.0
- Livability +3.1/5.0
- Schools +2.8/10.0
- Condition / age +2.5/5.0
- Appreciation +0.0/10.0
$199,950
🖨 Deal sheet 📄 Offer letter ✓ Due diligence
Listing remarks
Welcome to this stylishly remodeled home. Step inside to an inviting layout with neutral and modern updates, refreshed interiors, and a bright and comfortable feel in every room. This community allows for easy living in a well-kept community that is very sought after by many. It is conveniently located close to shopping, dinning as well as commuter routs. Truly a wonderful bend of value and convenience!
Key facts
- Parking
- Built 1976
- Listed 105 days
Property features AI
Finance
- Other: Located at 2929 N MacArthur Dr #173, Tracy, CA 95376; Directions: From 205 exit on MacArthur head south; park is to the right
- HOA & community: No homeowner association; Not a senior community; Land lease: No (listed land lease amount present in source excluded from output)
Exterior
- Parking: Attached parking; Guest parking available
- Utilities: 220 volts in kitchen; Public water; Public sewer
- Home design: Manufactured in-park home; Double wide; Built in 1976
- Construction: Composition roof; Manufacturer: SkyLine; Make/Model: Buddy
- Exterior features: Backyard; Court lot; Storage shed(s)
Interior
- Kitchen: Gas cooktop; Hood over range; Dishwasher; Microwave; Kitchen island; Stone countertops
- Bedrooms: 3 bedrooms
- Flooring: Laminate; Tile; Wood
- Bathrooms: 2 full bathrooms; Double sinks; Shower stall(s)
- Heating & cooling: Central heating; Central air conditioning; Ceiling fans
- Interior features: Cathedral/vaulted living area; Great room; Formal dining area; Island kitchen with stone counters; Storage area
- Laundry & utility: Washer included; Dryer included; Indoor laundry (inside room/area)
Neighborhood map
What this means for you Summary
Snapshot
- This is a 3-bed/2.0-bath manufactured listed at $200k.
Deal economics
- At list price, monthly cash flow is $582 ($7k/yr) — positive.
- The deal already cash-flows at list — no discount required.
- Meets the 1% rule at list price ($2k rent vs $200k).
- Recommended offer: $182k (9.0% below list) — sets the bar for market timing.
- Cap rate 9.8% vs local median 2.6% in Tracy — top-decile yield for the area; either an underpriced asset or a hidden risk that comps aren't pricing in. Stress-test before assuming the spread holds.
Location & tenants
- Location reads 62/100 on livability (#496 in CA) — a middle-class / working-renter tenant base. Strengths: employment A+, housing A+; Watch: schools D, amenities F, commute F.
- Tracy Joint Unified (suburban): math 22% / reading 37% proficiency, ranked #305 of 517 in CA (top 59%) — low school quality limits family demand, transient renter base, plan for 1-2y turnover.
- Market conditions: Rents rising (+3.2%/yr); 160 active listings in the ZIP; 16 comparable units currently listed for rent nearby; rentals leasing fast (median 3d on market — plan ~1-2 weeks tenant-placement turnaround); solid renter incomes; 3,779 units permitted in San Joaquin County in 2024 (0 in 5+ unit buildings).
Forward outlook
- Local home prices are declining (-3.0%/yr); year-one equity from $1k of loan paydown is wiped out by about $6k of value loss. Plan a longer hold.
- San Joaquin County population projected at +17% by 2050 — long-run rental-demand tailwind backs the buy-and-hold thesis.
- At projected returns (-3.0% appreciation + 3.2% rent growth), your $56k cash investment doubles in ~9 years — after that, you're playing with house money.
Negotiation context
- It's been on market 105 days — a 9% lower offer ($182k) is reasonable based on typical stale-listing flexibility.
Risks & watch-outs
- Climate carrying-cost: extreme-heat days projected 7→15/yr by 2055 (HVAC capex compounding) — expect insurance premiums to compound above CPI over the hold.
Questions for the listing agent
- It's been on market 105 days. Have you received any prior offers? Is the seller open to a 9% concession, seller financing, or rate buy-down credit?
- Built in 1976 — when were the roof, HVAC, electrical panel, plumbing, and water heater last replaced?
- Why hasn't it sold? Are there any deal-killer items the seller is aware of (foundation, flood, title, zoning, code violations)?
- Is there a deadline driving the sale (1031 exchange, divorce, estate, relocation)? That informs how much negotiation room exists.
- Schools are D-rated, which usually means shorter tenancies and higher turnover. Who's the typical renter profile here, and what's been the actual vacancy rate?
- What's the average days-on-market for RENTAL listings here right now (not sales)? A rising rental-DOM trend means longer vacancies and softer asking-rent achievability than the comps imply.
- What's the recent tenant-quality profile in this submarket — average credit score on applications, eviction rate, late-payment / NSF rate, and stable-employment percentage? A property-management company in the area should have these aggregated.
- How much new for-sale + rental construction is in the pipeline within 1–3 miles? Heavy new supply typically softens prices + rents 12–24 months out; constrained supply supports both.
Investment metrics
- 1% rule
- 1.24% ✓
- Cap rate
- 9.78%
- Cash-on-cash
- 12.47%
- DSCR
- 1.55
- GRM
- 6.7
CMA / ARV
- ARV (on-the-fly)
- $189,200
- Comps found
- 4
Show comp detail 4 sales within ~0.75 mi
| Address | Dist | Beds/Ba | Sqft | Sold | Price | $/sf | Match |
|---|---|---|---|---|---|---|---|
| 2929 N Macarthur Dr #92 | 0.01mi | 2/2.0 (-1) | 1,060 (-4%) | 19mo | $170,000 | $160 | 73 |
| 2929 N Macarthur #42 | 0.01mi | 3/2.0 | 1,200 (+9%) | 16mo | $165,000 | $138 | 71 |
| 2929 N Macarthur Dr #19 | 0.01mi | 3/2.0 | 990 (-10%) | 15mo | $170,000 | $172 | 71 |
| 2929 N Macarthur Dr #51 | 0.00mi | 2/2.0 (-1) | 956 (-13%) | 16mo | $200,000 | $209 | 60 |
Match score weights: distance 35% · size 25% · config 20% · recency 20%. Top-matched comps best support the ARV.
Projected returns pro-forma
-3.0% appreciation · 3.24% rent growth · sell at horizon
- IRR
- 2.5%
- Equity multiple
- 1.09×
- Total profit
- $5,288
- Equity at exit
- $29,813
- IRR
- 12.3%
- Equity multiple
- 1.98×
- Total profit
- $54,945
- Equity at exit
- $17,288
Cash invested: $55,986 (down + closing). Projections, not guarantees.
Landlord ↔ Tenant lean methodology
- Overall (STATE)
- 18 Strongly Tenant-Friendly
- State California
- 18 Strongly Tenant-Friendly · D+13
- County
- — inherits STATE
- City
- — inherits STATE
ZIP-level market 95376
- Rents YoY
- 3.2%
- Active inventory
- 160
- Price-to-rent
- 6.7×
Monthly cashflow live
- Estimated rent
- $2,485 high interval (Pro) →
- Mortgage (P&I)
- −$1,049
- Tax est. 1.5%
- −$250 /mo · $2,999/yr
- Insurance
- −$83
- HOA
- −$0
- Vacancy / Maint / Mgmt
- −$522
- Net cashflow
- $582
Break-even live
UW: 25.0% down · 7.5% · 30yr · 1.5% tax · 5.0% vac · 8.0% maint · 8.0% mgmt
Financing live
Cash to close
- Down payment
- $49,988
- Closing costs
- $5,998
- Reserves months
- —
- Total cash needed
- —
Loan-product check · same deal, 3 products live
Conventional
25% down · 7.5% · 30yr
- Down + closing
- —
- Monthly P&I
- —
- Monthly cashflow
- —
- DSCR
- —
- Eligible?
- —
Personal DTI + credit; lowest rate.
DSCR
20% down · 8.5% · 30yr
- Down + closing
- —
- Monthly P&I
- —
- Monthly cashflow
- —
- DSCR
- —
- Eligible?
- —
No personal income docs; deal must DSCR.
Hard money
10% down · 12.0% · 12mo
- Down + closing
- —
- Monthly P&I
- —
- Monthly cashflow
- —
- DSCR
- —
- Eligible?
- —
Short-term bridge; refi at stabilization.
Rent comps 16 comps
| Address | Beds | Baths | Sqft | Rent | $/sqft | DOM | Units | Dist |
|---|---|---|---|---|---|---|---|---|
| 321 E Grant Line Rd Tracy, CA | 2.0 | 2.0 | 963 | $2,200 | $2.28 | 2d | 1 | 0.32mi |
| 80 Portola Way Tracy, CA | 2.0 | 2.0 | 1050 | $1,995 | $1.90 | 2d | 1 | 0.52mi |
| 3255 Holly Dr Tracy, CA | 2.0 | 1.0 | 975 | $2,200 | $2.26 | 2d | 1 | 0.61mi |
| 115 E Emerson Ave Tracy, CA | 3.0 | 2.0 | 1112 | $2,475 | $2.23 | 21d | 1 | 0.77mi |
| 3440 Buthmann Ave Tracy, CA | 3.0 | 2.0 | 1068 | $2,550 | $2.39 | 18d | 1 | 0.85mi |
| 2921 Alene Ave Tracy, CA | 3.0 | 1.5 | 1084 | $2,400 | $2.21 | 23d | 1 | 0.93mi |
| 498 Hintz Ave Tracy, CA | 3.0 | 1.5 | 1084 | $2,420 | $2.23 | 2d | 1 | 0.93mi |
| 2800 N Tracy Blvd Tracy, CA | 1.0–2.0 | 1.0–2.0 | 824 | $2,495 | $3.03 | 2d | 9 | 0.99mi |
| 2910 N Tracy Blvd Unit 44 Tracy, CA | 2.0 | 1.0 | 850 | $1,750 | $2.06 | 14d | 1 | 1.02mi |
| 1720 Bessie Ave Tracy, CA | 3.0 | 1.0 | 1080 | $2,475 | $2.29 | 2d | 1 | 1.14mi |
| 1650 Bessie Ave Tracy, CA | 2.0 | 1.0 | 800 | $2,100 | $2.62 | 10d | 1 | 1.18mi |
| 950 W Grant Line Rd Tracy, CA | 1.0–3.0 | 1.0–2.0 | 821 | $2,685 | $3.27 | 2d | 15 | 1.25mi |
| 2680 Bonifacio Dr Tracy, CA | 3.0 | 2.0 | 1332 | $3,000 | $2.25 | 3d | 1 | 1.36mi |
| 1145 Parker Ave Tracy, CA | 2.0 | 1.0 | 700 | $2,095 | $2.99 | 2d | 1 | 1.43mi |
| 1143 Parker Ave Tracy, CA | 2.0 | 1.0 | 700 | $2,095 | $2.99 | 2d | 1 | 1.43mi |
| 1143 Wall St Tracy, CA | 2.0 | 2.0 | 995 | $2,600 | $2.61 | 2d | 1 | 1.48mi |
Listing history 15 events
-
2026-06-18days on market $199,950 Active 105 DOM
-
2026-06-17days on market $199,950 Active 104 DOM
-
2026-06-16days on market $199,950 Active 103 DOM
-
2026-06-15days on market $199,950 Active 102 DOM
-
2026-06-14pricedays on market $199,950 Active 100 DOM
-
2026-06-13days on market $229,950 Active 99 DOM
-
2026-06-10days on market $229,950 Active 97 DOM
-
2026-06-09days on market $229,950 Active 96 DOM
-
2026-06-08days on market $229,950 Active 95 DOM
-
2026-06-07days on market $229,950 Active 94 DOM
-
2026-06-05days on market $229,950 Active 91 DOM
-
2026-06-03days on market $229,950 Active 90 DOM
-
2026-06-03days on market $229,950 Active 89 DOM
-
2026-06-01days on market $229,950 Active 88 DOM
-
2026-05-31days on market $229,950 Active 87 DOM
ⓘ Source: listings_history table (triggers on properties + properties_extension) + one-shot
backfill from property_details.listing_events for pre-trigger history.
Climate risk First Street
- Flood 1/10 Low FEMA zone X (unshaded) · 0% chance over 30 yrs
- Wildfire 2/10 Low
- Heat 6/10 Major 7 d/yr ≥103°F today · 15 d/yr by 30 yrs out
- Wind 1/10 Low
- Air quality 10/10 Extreme 25 unhealthy d/yr today · 26 by 30 yrs out
Nearby sold comps map
Loading sold comps map…
Walkable amenities ~0.75 mi
Loading nearby amenities…
Taxation est. · year 1
- Rental income
- $29,826
- − Mortgage interest
- −$11,200
- − Property taxes
- −$2,999
- − Insurance
- −$1,000
- − Repairs & maintenance
- −$2,386
- − Management
- −$2,386
- − Depreciation
- −$5,817
- Taxable income
- $4,038
- Est. tax owed @ 24.0%
- −$969
- After-tax cash flow
- $6,012/yr
For passive investors: Depreciation is non-cash, so a rental often shows a tax loss while cash-flowing — sheltering income. Rental losses are passive: they offset passive income freely, and up to $25,000/yr can offset ordinary (W-2) income if you actively participate and your MAGI is under $100k (phasing out to $0 by $150k); unused losses carry forward. On sale, claimed depreciation is recaptured at up to 25%, and gains may owe capital-gains tax (a 1031 exchange can defer both). Figures are a year-1 estimate at your 24.0% rate — not tax advice; consult a CPA.
Schools (NCES district)
- District
- Tracy Joint Unified
- NCES district ID
- 0600047
- Math proficiency
- 22% ▼ -9.00%
- Reading proficiency
- 37% ▼ -7.00%
- Median HH income
- $73,095
- Composite
- 27.94/100
- National rank
- #6862
- State rank
- #305 of 517 in CA
Livability — Tracy
- Score
- 62/100
- State rank
- #496
- US rank
- #16717
Category grades
Schools grade is shown separately in the Schools card above.
Census & demographics
- Census place
- Tracy, CA
- County
- San Joaquin County · 729,570 people
- City population
- 133,642
- Metro
- Stockton, CA
- Population (ZIP)
- 54,488
- Household income
- $102,555
- Rent vs Own
- Severe rent burden
- 1328.0
Population outlook (San Joaquin County) Hauer SSP2
- Today (2025)
- 796,965 people
- By 2030
- 828,849 · +4.0%
- By 2040
- 885,611 · +11.1%
- By 2050
- 929,798 · +16.7%
- By 2075
- 994,578 · +24.8%
- By 2100
- 971,291 · +21.9%
Race, ethnicity, and origin ACS 2023
- Neighborhood character
- Diverse neighborhood (Simpson 0.66)
- Race & ethnicity
- Hispanic / Latino 50% White 27% Two or more races 21% Asian 13% Black 5% Native American 1%
- Hispanic origin (detail)
- Mexican 40% Puerto Rican 1%
- Common ancestry
- Russian 3% Lithuanian 2% Italian 1%
- Foreign-born
- 26% · Canada, China, Vietnam
- Languages at home
- 56% English-only · Spanish 30% Other Indo-European 7% Tagalog/Filipino 2%
Political lean MEDSL · San Joaquin
- 2024 margin
- Toss-up / Even · D 48.0% · R 48.9% · Other 3.0%
- 2008→2024 swing
- -11.6pp toward R · 2008: 10.7pp · 2024: -0.9pp
- All cycles
- 2024: R+0.9 2020: D+13.9 2016: D+12.9 2012: D+8.9 2008: D+10.7
Not yet ingested
- Civics
- —
Market trends
- HPI YoY
- ▼ -436.54%
- Current HPI
- 255.8813
- Rent YoY
- ▲ 3.24%
- Metro
- Stockton, CA
- State GDP YoY
- ▲ 3.21%
- F500 in state
- 116
Industry mix (Fortune 500 HQ in CA)
| Industry | F500 HQs | Revenue |
|---|---|---|
| Technology | 27 | $1,492B |
|
||
| Financial Services | 3 | $174B |
|
||
| Retail | 3 | $44B |
|
||
| Insurance | 3 | $26B |
|
||
| Media / Entertainment | 2 | $115B |
|
||
| Pharmaceuticals / Biotech | 2 | $62B |
|
||
Cash-flow waterfall
monthlySold comps — $/sqft
last 12 mo · ≤1 miLoading sold comps…