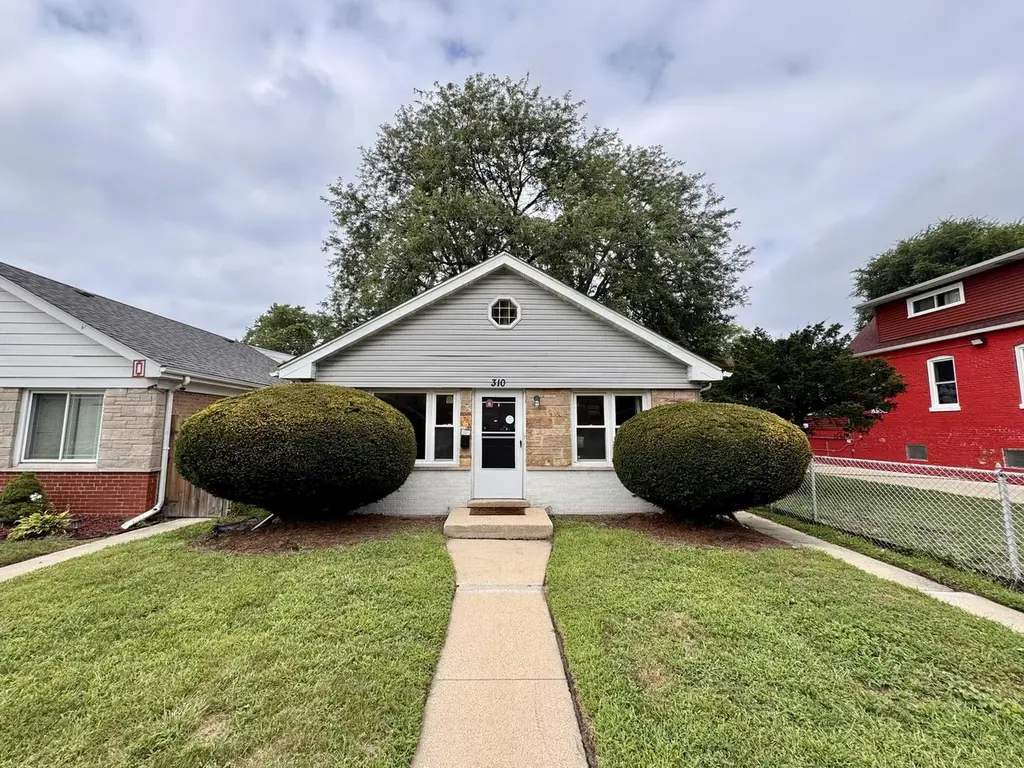
310 155th Pl · Calumet City, IL
Flood risk 4/10 · Minor
- FEMA flood zone
- X (unshaded)
- Chance of flooding over 30 yrs
- 0.22%
- Est. flood insurance / yr
- $507 – $1,088
Fire risk 1/10 · Minimal
- Est. fire insurance / yr
- $804 – $1,492
Heat risk 3/10 · Minor
- Hot days now (above 102°F)
- 7 days/yr
- Hot days in 30 yrs
- 15 days/yr
Wind risk 2/10 · Minimal
- Chance of severe wind over 30 yrs
- 0.0%
Air-quality risk 4/10 · Minor
- Unhealthy air days now
- 5 days/yr
- Unhealthy air days in 30 yrs
- 6 days/yr
Risk factors via First Street. Map © Google.
Why this score? — see what drove the D+ grade
The composite is a weighted blend of 9 inputs, each scored 0–100. Each bar is that input's sub-score; the figure is the points it added to the 100-point composite (weight × sub-score).
- Cash flow +20.6/30.0
- DSCR +6.6/10.0
- 1% rule +5.7/10.0
- Rent growth +4.0/5.0
- Livability +3.6/5.0
- ARV discount +3.2/15.0
- Condition / age +2.5/5.0
- Schools +1.0/10.0
- Appreciation +0.0/10.0
$159,000
🖨 Deal sheet 📄 Offer letter ✓ Due diligence
Listing remarks MLS
BRICK TRI-LEVEL HOME WITH 3 BEDROOMS, 1 1/2 BATHS & 2 CAR GARAGE. SELLER DOES NOT PROVIDE SURVEY OR TERMITE. BUYER RESPONSIBLE FOR ANY VILLAGE INSPECTION, COMPLIANCE OR ESCROW IF NEEDED. PROOF OF FUNDS NEEDED FOR CASH OFFERS. PLEASE ALLOW 2-3 BUSINESS DAYS FOR SELLER TO RESPOND. EARNEST MONEY MUST BE CERTIFIED FUNDS.
Key facts
- Black appliances
- Fenced backyard
- White cabinetry
Tags
Property features AI
Finance
- Other: Property located in Calumet City, Thornton Township; Directions: Sibley north to Wentworth, Wentworth to 155th Place and turn right; Some photos are virtually staged
- HOA & community: No master association fee required
Exterior
- Parking: Detached owned garage (2 garage spaces, 2 parking spaces total)
- Utilities: Water from Lake Michigan; Public sewer
- Home design: Detached single-family home; Split-level design; Fee simple ownership
- Construction: Brick construction; Built before 1978 (51–60 years old)
- Exterior features: Less than 0.25 acre lot; Lot dimensions: 2067
Interior
- Kitchen: Kitchen on the main level (12 x 13)
- Bedrooms: 3 bedrooms total; Master bedroom on the second level (13 x 10); Second bedroom on the second level (11 x 11); Third bedroom on the second level (10 x 10)
- Bathrooms: 1 full bathroom; 1 half bathroom; Basement has a bathroom
- Heating & cooling: Natural gas forced air heating
- Interior features: Partially finished basement; 7 total rooms
- Laundry & utility: Laundry room on the lower level (10 x 8)
Neighborhood map
What this means for you Summary
Snapshot
- This is a 3-bed/1.5-bath single-family listed at $159k.
Deal economics
- At list price, monthly cash flow is $213 ($3k/yr) — positive.
- The deal already cash-flows at list — no discount required.
- Meets the 1% rule at list price ($2k rent vs $159k).
Location & tenants
- Location reads 71/100 on livability (#330 in IL) — a middle-class / working-renter tenant base. Strengths: commute A+, cost of living A+, housing A+; Watch: employment C-, schools F, crime D-.
- Thornton Fractional Twp Hsd 215 (suburban): math 9% / reading 13% proficiency, ranked #563 of 620 in IL (top 91%) — low school quality limits family demand, transient renter base, plan for 1-2y turnover.
- Market conditions: Rents rising fast (+6.2%/yr); 198 active listings in the ZIP; 15 comparable units currently listed for rent nearby; rentals at typical pace (median 17d on market — plan ~3-4 weeks tenant-placement turnaround); 6,272 units permitted in Cook County in 2024 (4,658 in 5+ unit buildings).
- This rent runs 37% of the median local income ($55k/yr) — at the standard rent-burdened threshold; future hikes will face affordability resistance.
Forward outlook
- Local home prices are declining (-3.0%/yr); year-one equity from $1k of loan paydown is wiped out by about $5k of value loss. Plan a longer hold.
- At projected returns (-3.0% appreciation + 6.2% rent growth), your $45k cash investment doubles in ~10 years — after that, you're playing with house money.
Negotiation context
- Only 7 days on market — expect competitive offers; lowballing is unlikely to land.
- 13 sale attempts since 15y ago; this cycle's ask has dropped $18k (10%) from the opening price — seller is motivated, your offer sets the floor, not the list.
- Current owner paid $38k; list at $159k implies a 318% gain — meaningful room to come down on a strong offer.
Questions for the listing agent
- Built in 1966 — when were the roof, HVAC, electrical panel, plumbing, and water heater last replaced?
- Is there a deadline driving the sale (1031 exchange, divorce, estate, relocation)? That informs how much negotiation room exists.
- Schools are F-rated, which usually means shorter tenancies and higher turnover. Who's the typical renter profile here, and what's been the actual vacancy rate?
- Crime grade is D in this area — have there been break-ins, vandalism, or insurance claims at this property in the last 3 years? What carrier currently insures it and at what premium?
- The area grade is low — what's the realistic commute time and amenity access for the typical tenant pool here? Any planned neighborhood developments (good or bad) we should know about?
- What's the average days-on-market for RENTAL listings here right now (not sales)? A rising rental-DOM trend means longer vacancies and softer asking-rent achievability than the comps imply.
- What's the recent tenant-quality profile in this submarket — average credit score on applications, eviction rate, late-payment / NSF rate, and stable-employment percentage? A property-management company in the area should have these aggregated.
- How much new for-sale + rental construction is in the pipeline within 1–3 miles? Heavy new supply typically softens prices + rents 12–24 months out; constrained supply supports both.
Investment metrics
- 1% rule
- 1.07% ✓
- Cap rate
- 7.90%
- Cash-on-cash
- 5.74%
- DSCR
- 1.26
- GRM
- 7.8
CMA / ARV
- ARV (on-the-fly)
- $145,040
- Comps found
- 12
Show comp detail 12 sales within ~0.75 mi
| Address | Dist | Beds/Ba | Sqft | Sold | Price | $/sf | Match |
|---|---|---|---|---|---|---|---|
| 302 153rd St | 0.30mi | 3/1.0 | 1,016 (-2%) | 2mo | $175,000 | $172 | 79 |
| 243 Waltham St | 0.51mi | 3/1.0 | 1,032 (-0%) | 3mo | $200,000 | $194 | 71 |
| 503 Webb St | 0.36mi | 2/1.0 (-1) | 1,093 (+6%) | 1mo | $20,000 | $18 | 66 |
| 419 157th St | 0.26mi | 4/2.0 (+1) | 957 (-8%) | 3mo | $80,000 | $84 | 66 |
| 527 155th Pl | 0.29mi | 2/1.0 (-1) | 947 (-9%) | 3mo | $82,900 | $88 | 63 |
| 211 Waltham St | 0.52mi | 3/2.0 | 1,101 (+6%) | 1mo | $150,000 | $136 | 62 |
| 303 W 153rd Pl | 0.21mi | 3/1.0 | 1,188 (+15%) | 1mo | $65,000 | $55 | 62 |
| 608 Forsythe Ave | 0.44mi | 2/1.0 (-1) | 984 (-5%) | 3mo | $137,500 | $140 | 62 |
| 518 156th Pl | 0.30mi | 3/2.0 | 1,165 (+12%) | 3mo | $167,000 | $143 | 61 |
| 866 Greenbay Ave | 0.50mi | 3/2.0 | 1,163 (+12%) | 3mo | $200,000 | $172 | 52 |
| 422 Garfield Ave | 0.67mi | 2/2.0 (-1) | 920 (-11%) | 1mo | $49,000 | $53 | 42 |
| 7 Highland St | 0.72mi | 3/2.0 | 1,163 (+12%) | 3mo | $172,500 | $148 | 41 |
Match score weights: distance 35% · size 25% · config 20% · recency 20%. Top-matched comps best support the ARV.
Projected returns pro-forma
-3.0% appreciation · 6.17% rent growth · sell at horizon
- IRR
- -3.8%
- Equity multiple
- 0.85×
- Total profit
- $-6,565
- Equity at exit
- $23,707
- IRR
- 9.3%
- Equity multiple
- 1.82×
- Total profit
- $36,435
- Equity at exit
- $13,747
Cash invested: $44,520 (down + closing). Projections, not guarantees.
Landlord ↔ Tenant lean methodology
- Overall (STATE)
- 43 Moderately Tenant-Leaning
- State Illinois
- 43 Moderately Tenant-Leaning · D+7
- County
- — inherits STATE
- City
- — inherits STATE
ZIP-level market 60409
- Home prices YoY
- -27.6%
- Rents YoY
- 6.2%
- Active inventory
- 198
- Price-to-rent
- 7.8×
Monthly cashflow live
- Estimated rent
- $1,700 high interval (Pro) →
- Mortgage (P&I)
- −$834
- Tax from tax record
- −$230 /mo · $2,765/yr
- Insurance
- −$66
- HOA
- −$0
- Vacancy / Maint / Mgmt
- −$357
- Net cashflow
- $213
Break-even live
UW: 25.0% down · 7.5% · 30yr · 1.5% tax · 5.0% vac · 8.0% maint · 8.0% mgmt
Financing live
Cash to close
- Down payment
- $39,750
- Closing costs
- $4,770
- Reserves months
- —
- Total cash needed
- —
Loan-product check · same deal, 3 products live
Conventional
25% down · 7.5% · 30yr
- Down + closing
- —
- Monthly P&I
- —
- Monthly cashflow
- —
- DSCR
- —
- Eligible?
- —
Personal DTI + credit; lowest rate.
DSCR
20% down · 8.5% · 30yr
- Down + closing
- —
- Monthly P&I
- —
- Monthly cashflow
- —
- DSCR
- —
- Eligible?
- —
No personal income docs; deal must DSCR.
Hard money
10% down · 12.0% · 12mo
- Down + closing
- —
- Monthly P&I
- —
- Monthly cashflow
- —
- DSCR
- —
- Eligible?
- —
Short-term bridge; refi at stabilization.
Rent comps 15 comps
| Address | Beds | Baths | Sqft | Rent | $/sqft | DOM | Units | Dist |
|---|---|---|---|---|---|---|---|---|
| 115 157th St Unit 3 Calumet City, IL | 3.0 | 1.0 | 800 | $1,350 | $1.69 | 24d | 1 | 0.32mi |
| 323 Memorial Dr Unit 2 Calumet City, IL | 2.0 | 1.0 | 1000 | $1,600 | $1.60 | 24d | 1 | 0.41mi |
| 3 Ruth St Hammond, IN | 2.0 | 1.0 | 900 | $1,250 | $1.39 | 24d | 1 | 0.58mi |
| 5 Ruth St Unit 2W Hammond, IN | 2.0 | 1.0 | 900 | $1,250 | $1.39 | 12d | 1 | 0.58mi |
| 34 Elizabeth St Calumet City, IL | 3.0 | 1.0 | 1246 | $2,400 | $1.93 | 1d | 1 | 0.62mi |
| 3 Waltham St Hammond, IN | 3.0 | 1.0 | 1200 | $1,095 | $0.91 | 24d | 1 | 0.62mi |
| 634 Sibley Blvd Calumet City, IL | 1.0–2.0 | 1.0 | 710 | $1,450 | $2.04 | 4d | 2 | 0.69mi |
| 1312 Gordon Ave Calumet City, IL | 2.0 | 1.0 | 1134 | $1,600 | $1.41 | 7d | 1 | 1.13mi |
| 1338 Wentworth Ave Unit 1338 Calumet City, IL | 2.0 | 1.0 | 800 | $1,430 | $1.79 | 24d | 1 | 1.20mi |
| 407 Kenwood St Hammond, IN | 2.0 | 1.0 | 920 | $1,495 | $1.62 | 24d | 1 | 1.22mi |
| 407 Kenwood St Hammond, IN | 2.0 | 1.0 | 920 | $1,495 | $1.62 | 16d | 1 | 1.22mi |
| 671 Saginaw Ave Calumet City, IL | 3.0 | 2.0 | 1250 | $2,276 | $1.82 | 10d | 1 | 1.29mi |
| 4624 Towle Ave Hammond, IN | 4.0 | 2.0 | 1500 | $2,500 | $1.67 | 2d | 1 | 1.42mi |
| 4624 Towle Ave Hammond, IN | 4.0 | 2.0 | 1500 | $2,500 | $1.67 | 1d | 1 | 1.42mi |
| 2790 E State St Apt 2E Burnham, IL | 3.0 | 2.0 | 1100 | $1,695 | $1.54 | 24d | 1 | 1.46mi |
Listing history 50 events
-
2026-06-18days on market $159,000 Active 7 DOM
-
2026-06-17days on market $159,000 Active 6 DOM
-
2026-06-16days on market $159,000 Active 5 DOM
-
2026-06-15days on market $159,000 Active 4 DOM
-
2026-06-13days on market $159,000 Active 2 DOM
-
2026-06-09days on market $159,000 Active 215 DOM
-
2026-06-08days on market $159,000 Active 214 DOM
-
2026-06-07days on market $159,000 Active 213 DOM
-
2026-06-04days on market $159,000 Active 210 DOM
-
2026-06-03days on market $159,000 Active 209 DOM
-
2026-06-02days on market $159,000 Active 208 DOM
-
2026-06-01days on market $159,000 Active 207 DOM
-
2026-05-31days on market $159,000 Active 206 DOM
-
2026-04-24price $161,000
-
2026-03-27price $163,000
-
2026-02-27price $166,000
-
2026-01-20price $168,000
-
2026-01-20price $163,000
-
2025-12-19price $168,000
-
2025-11-21price $173,000
-
2025-11-06$177,000 Active
-
2025-11-06historical
-
2025-10-03price
-
2025-09-19price
-
2025-09-12price
-
2025-08-28Active
-
2024-07-12historical $1,645
-
2024-07-11historical $1,645
-
2024-06-15$1,645
-
2024-06-11historical $1,645
-
2024-05-30price $1,645
-
2024-05-30$1,645
-
2024-05-30$1,705
-
2024-05-10historical $1,705
-
2024-05-09historical $1,705
-
2024-05-04$1,705
-
2024-05-04$1,705
-
2023-11-11historical $1,675
-
2023-11-09historical $1,675
-
2023-11-08price $1,675
-
2023-11-08price $1,675
-
2023-11-04price $1,685
-
2023-11-03price $1,685
-
2023-11-03$1,695
-
2023-11-02$1,695
-
2023-07-21historical $1,705
-
2023-07-19historical $1,705
-
2023-07-17price $1,705
-
2023-07-14price $1,705
-
2013-06-03soldstatus $38,000
ⓘ Source: listings_history table (triggers on properties + properties_extension) + one-shot
backfill from property_details.listing_events for pre-trigger history.
Tax reassessment forecast IL · Partial reset (capped growth)
- Current annual tax
- $2,765 · $230/mo
- Projected year-2 tax
- $3,187 · $266/mo
- Expected delta
- +$422/yr (+$35/mo · 15.3%)
ⓘ Screening estimate from a state-policy table — verify with the county assessor before closing.
Climate risk First Street
- Flood 4/10 Moderate FEMA zone X (unshaded) · 22% chance over 30 yrs
- Wildfire 1/10 Low
- Heat 3/10 Moderate 7 d/yr ≥102°F today · 15 d/yr by 30 yrs out
- Wind 2/10 Low 0% chance of damaging wind over 30 yrs
- Air quality 4/10 Moderate 5 unhealthy d/yr today · 6 by 30 yrs out
Nearby sold comps map
Loading sold comps map…
Walkable amenities ~0.75 mi
Loading nearby amenities…
Taxation est. · year 1
- Rental income
- $20,405
- − Mortgage interest
- −$8,906
- − Property taxes
- −$2,765
- − Insurance
- −$795
- − Repairs & maintenance
- −$1,632
- − Management
- −$1,632
- − Depreciation
- −$4,625
- Taxable income
- $49
- Est. tax owed @ 24.0%
- −$12
- After-tax cash flow
- $2,543/yr
For passive investors: Depreciation is non-cash, so a rental often shows a tax loss while cash-flowing — sheltering income. Rental losses are passive: they offset passive income freely, and up to $25,000/yr can offset ordinary (W-2) income if you actively participate and your MAGI is under $100k (phasing out to $0 by $150k); unused losses carry forward. On sale, claimed depreciation is recaptured at up to 25%, and gains may owe capital-gains tax (a 1031 exchange can defer both). Figures are a year-1 estimate at your 24.0% rate — not tax advice; consult a CPA.
Schools (NCES district)
- District
- Thornton Fractional Twp Hsd 215
- NCES district ID
- 1738940
- Math proficiency
- 9% ▼ -3.00%
- Reading proficiency
- 13% ▼ -3.00%
- Median HH income
- $48,207
- Composite
- 10.27/100
- National rank
- #9793
- State rank
- #563 of 620 in IL
Livability — Calumet City
- Score
- 71/100
- State rank
- #330
- US rank
- #6552
Category grades
Schools grade is shown separately in the Schools card above.
Census & demographics
- Census place
- Calumet City, IL
- County
- Cook County · 4,486,803 people
- City population
- 35,100
- Metro
- Chicago-Naperville-Elgin, IL-IN-WI
- Population (ZIP)
- 35,100
- Household income
- $55,369
- Rent vs Own
- Severe rent burden
- 2415.0
Population outlook (Cook County) Hauer SSP2
- Today (2025)
- 5,347,519 people
- By 2030
- 5,357,703 · +0.2%
- By 2040
- 5,324,924 · -0.4%
- By 2050
- 5,230,762 · -2.2%
- By 2075
- 4,785,735 · -10.5%
- By 2100
- 4,188,836 · -21.7%
Race, ethnicity, and origin ACS 2023
- Neighborhood character
- Predominantly Black (74%)
- Race & ethnicity
- Black 74% Hispanic / Latino 15% White 7% Two or more races 4%
- Hispanic origin (detail)
- Mexican 14%
- Common ancestry
- Romanian 2%
- Foreign-born
- 9% · Canada
- Languages at home
- 83% English-only · Spanish 14%
Political lean MEDSL · Cook
- 2024 margin
- Solid D (+42.0) · D 70.4% · R 28.4% · Other 1.2%
- 2008→2024 swing
- -11.4pp toward R · 2008: 53.4pp · 2024: 42.0pp
- All cycles
- 2024: D+42.0 2020: D+50.3 2016: D+53.0 2012: D+49.4 2008: D+53.4
Not yet ingested
- Civics
- —
Market trends
- HPI YoY
- ▼ -75.01%
- Current HPI
- 197.2137
- Rent YoY
- ▲ 6.17%
- Metro
- Chicago-Naperville-Elgin, IL-IN-WI
- State GDP YoY
- ▲ 1.59%
- F500 in state
- 60
Industry mix (Fortune 500 HQ in IL)
| Industry | F500 HQs | Revenue |
|---|---|---|
| Insurance | 4 | $201B |
|
||
| Consumer Goods | 4 | $87B |
|
||
| Industrial Machinery | 3 | $64B |
|
||
| Healthcare | 2 | $55B |
|
||
| Retail / Pharmacy | 1 | $148B |
|
||
| Agriculture / Food | 1 | $86B |
|
||
Price history
-7.5% since first listed54 events — show timeline
- 2026-04-24 Price Changed $161,000 MRED as Distributed by MLS Grid
- 2026-03-27 Price Changed $163,000 MRED as Distributed by MLS Grid
- 2026-02-27 Price Changed $166,000 MRED as Distributed by MLS Grid
- 2026-01-20 Price Changed $168,000 MRED as Distributed by MLS Grid
- 2026-01-20 Price Changed $163,000 MRED as Distributed by MLS Grid
- 2025-12-19 Price Changed $168,000 MRED as Distributed by MLS Grid
- 2025-11-21 Price Changed $173,000 MRED as Distributed by MLS Grid
- 2025-11-06 Listing Removed — MRED as Distributed by MLS Grid
- 2025-11-06 Listed $177,000 MRED as Distributed by MLS Grid
- 2025-10-03 Price Changed — MRED as Distributed by MLS Grid
- 2025-09-19 Price Changed — MRED as Distributed by MLS Grid
- 2025-09-12 Price Changed — MRED as Distributed by MLS Grid
- 2025-08-28 Listed — MRED as Distributed by MLS Grid
- 2024-07-12 Rental Removed $1,645 RENTLY
- 2024-07-11 Rental Removed $1,645 RENT.
- 2024-06-15 Listed for Rent $1,645 RENT.
- 2024-06-11 Rental Removed $1,645 RENT.
- 2024-05-30 Price Changed $1,645 RENTLY
- 2024-05-30 Listed for Rent $1,645 RENT.
- 2024-05-30 Listed for Rent $1,705 RENTLY
- 2024-05-10 Rental Removed $1,705 RENTLY
- 2024-05-09 Rental Removed $1,705 RENT.
- 2024-05-04 Listed for Rent $1,705 RENT.
- 2024-05-04 Listed for Rent $1,705 RENTLY
- 2023-11-11 Rental Removed $1,675 RENTLY
- 2023-11-09 Rental Removed $1,675 RENT.
- 2023-11-08 Price Changed $1,675 RENTLY
- 2023-11-08 Price Changed $1,675 RENT.
- 2023-11-04 Price Changed $1,685 RENTLY
- 2023-11-03 Price Changed $1,685 RENT.
- 2023-11-03 Listed for Rent $1,695 RENTLY
- 2023-11-02 Listed for Rent $1,695 RENT.
- 2023-07-21 Rental Removed $1,705 RENTLY
- 2023-07-19 Rental Removed $1,705 RENT.
- 2023-07-17 Price Changed $1,705 RENTLY
- 2023-07-14 Price Changed $1,705 RENT.
- 2013-06-03 Sold (Public Records) $38,000 Public Records
- 2013-05-21 Sold (MLS) $38,000 MRED as Distributed by MLS Grid
- 2013-04-24 Pending — MRED as Distributed by MLS Grid
- 2013-03-20 Listed $42,000 MRED as Distributed by MLS Grid
- 2012-09-18 Listing Removed — MRED as Distributed by MLS Grid
- 2012-07-01 Relisted — MRED as Distributed by MLS Grid
- 2012-06-30 Listing Removed — MRED as Distributed by MLS Grid
- 2012-06-19 Listed — MRED as Distributed by MLS Grid
- 2012-03-14 Listing Removed — MRED as Distributed by MLS Grid
- 2011-11-18 Price Changed — MRED as Distributed by MLS Grid
- 2011-05-12 Listed — MRED as Distributed by MLS Grid
- 2004-11-24 Sold (Public Records) $81,000 Public Records
- 1998-12-31 Sold (Public Records) $120,000 Public Records
- 1998-12-31 Sold (Public Records) $80,000 Public Records
- 1996-04-26 Sold (Public Records) $12,000 Public Records
- 1994-01-14 Sold (Public Records) $55,514 Public Records
- 1988-05-17 Sold (Public Records) $57,000 Public Records
- 1979-06-14 Sold (Public Records) $174,000 Public Records
Property tax history
+1.3%/yrLatest (2023): $2,765 · -12.1% YoY. Source: county tax records.
Cash-flow waterfall
monthlySold comps — $/sqft
last 12 mo · ≤1 miLoading sold comps…