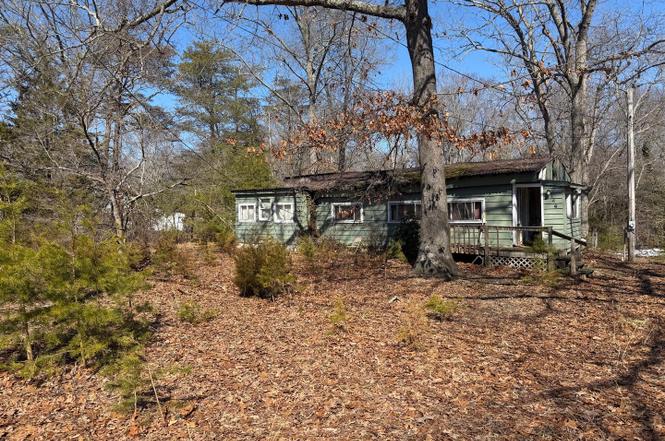
144 Alloway Friesburg Rd · Alloway, NJ
Flood risk 1/10 · Minimal
- FEMA flood zone
- X (unshaded)
- Chance of flooding over 30 yrs
- 0.0%
- Est. flood insurance / yr
- $507 – $1,088
Fire risk 6/10 · Moderate
- Est. fire insurance / yr
- $526 – $976
Heat risk 7/10 · Major
- Hot days now (above 102°F)
- 7 days/yr
- Hot days in 30 yrs
- 15 days/yr
Wind risk 6/10 · Moderate
- Chance of severe wind over 30 yrs
- 27.0%
Air-quality risk 3/10 · Minor
- Unhealthy air days now
- 2 days/yr
- Unhealthy air days in 30 yrs
- 4 days/yr
Risk factors via First Street. Map © Google.
Why this score? — see what drove the B grade
The composite is a weighted blend of 9 inputs, each scored 0–100. Each bar is that input's sub-score; the figure is the points it added to the 100-point composite (weight × sub-score).
- Cash flow +25.8/30.0
- 1% rule +9.3/10.0
- DSCR +8.6/10.0
- ARV discount +7.5/15.0
- Appreciation +5.8/10.0
- Schools +4.7/10.0
- Livability +3.3/5.0
- Rent growth +2.5/5.0
- Condition / age +2.5/5.0
$80,000
🖨 Deal sheet 📄 Offer letter ✓ Due diligence
Listing remarks MLS
Wooded lot in a very nice area in Alloway. There is a trailor on property with tenants but they have no lease. Seller is selling as ground and makes no warrants on the trailor. It is the buyer respon. to remove or fix the trailor. It is strictly AS IS
Key facts
- Salem county
- 1.5 acre lot
- Space and privacy
Tags
Property features AI
Finance
- Financial info: Improvement assessed at $30,400; Land assessed at $55,000; Tax assessed value $85,400 (tax year 2025)
Exterior
- Parking: Driveway
- Utilities: Other water source; Power and utility details not specified
- Home design: Manufactured structure; Fee simple ownership
- Construction: Above-grade finished area 796 (assessor); Year built source: assessor
- Exterior features: Lot dimensions listed by assessor
Interior
- Bedrooms: 2 bedrooms on the main level
- Bathrooms: 1 full bathroom on the main level; 1 full bathroom total
- Heating & cooling: Other heating; Other cooling; Other hot water
- Interior features: No basement
Neighborhood map
What this means for you Summary
Snapshot
- This is a 2-bed/1.0-bath single-family listed at $80k.
Deal economics
- At list price, monthly cash flow is $195 ($2k/yr) — positive.
- The deal already cash-flows at list — no discount required.
- Meets the 1% rule at list price ($1k rent vs $80k).
- Recommended offer: $73k (9.0% below list) — sets the bar for market timing.
Location & tenants
- Location reads 66/100 on livability (#368 in NJ) — a middle-class / working-renter tenant base. Strengths: crime A+, employment A+, housing A+; Watch: amenities F, commute F, health & safety F.
- Alloway Twp School District (rural): math 48% / reading 52% proficiency, ranked #350 of 612 in NJ (top 57%) — acceptable for families but not a draw, mixed tenant base, ~2y average lease; only 12% free/reduced lunch — higher-income household profile.
- Market conditions: 8 active listings in the ZIP; 95 units permitted in Salem County in 2024 (0 in 5+ unit buildings).
Forward outlook
- In year one you build about $2k of equity ($553 loan paydown + $1k appreciation (1.6% local appreciation)).
- Salem County population projected at -23% by 2050 — secular population decline; favor cash flow + early exit over multi-decade hold.
- At projected returns (1.6% appreciation + 3.0% rent growth), your $22k cash investment doubles in ~5 years — after that, you're playing with house money.
Negotiation context
- It's been on market 105 days — a 9% lower offer ($73k) is reasonable based on typical stale-listing flexibility.
- 3 sale attempts since 22y ago with the ask held roughly flat each time — persistent listings suggest the price (not the market) is what's stuck; bring a comps-based counter.
- Current owner paid $50k; list at $80k implies a 60% gain — meaningful room to come down on a strong offer.
Risks & watch-outs
- Watch-outs: property tax is 3.9% of price; built in 1950 — expect roof / HVAC / electrical / plumbing capex.
- Climate carrying-cost: major wind risk, 27% chance of damaging wind over 30y; major wildfire risk; extreme-heat days projected 7→15/yr by 2055 (HVAC capex compounding) — expect insurance premiums to compound above CPI over the hold.
Questions for the listing agent
- It's been on market 105 days. Have you received any prior offers? Is the seller open to a 9% concession, seller financing, or rate buy-down credit?
- Built in 1950 — when were the roof, HVAC, electrical panel, plumbing, and water heater last replaced?
- Property tax is high relative to price — has the assessment been appealed recently, and will the sale trigger a re-assessment?
- Why hasn't it sold? Are there any deal-killer items the seller is aware of (foundation, flood, title, zoning, code violations)?
- Is there a deadline driving the sale (1031 exchange, divorce, estate, relocation)? That informs how much negotiation room exists.
- Schools are B-rated — typically a magnet for longer-tenancy family renters. What's the average tenant stay here, and is there a school-zone premium baked into asking?
- What's the average days-on-market for RENTAL listings here right now (not sales)? A rising rental-DOM trend means longer vacancies and softer asking-rent achievability than the comps imply.
- What's the recent tenant-quality profile in this submarket — average credit score on applications, eviction rate, late-payment / NSF rate, and stable-employment percentage? A property-management company in the area should have these aggregated.
- How much new for-sale + rental construction is in the pipeline within 1–3 miles? Heavy new supply typically softens prices + rents 12–24 months out; constrained supply supports both.
Investment metrics
- 1% rule
- 1.43% ✓
- Cap rate
- 9.21%
- Cash-on-cash
- 10.43%
- DSCR
- 1.46
- GRM
- 5.8
CMA / ARV
No comps found within radius.
Projected returns pro-forma
1.6% appreciation · 3.0% rent growth · sell at horizon
- IRR
- 13.9%
- Equity multiple
- 1.73×
- Total profit
- $16,407
- Equity at exit
- $29,859
- IRR
- 16.9%
- Equity multiple
- 3.18×
- Total profit
- $48,768
- Equity at exit
- $41,731
Cash invested: $22,400 (down + closing). Projections, not guarantees.
Landlord ↔ Tenant lean methodology
- Overall (STATE)
- 21 Tenant-Leaning
- State New Jersey
- 21 Tenant-Leaning · D+6
- County
- — inherits STATE
- City
- — inherits STATE
ZIP-level market 08001
- Home prices YoY
- 0.9%
- Active inventory
- 8
- Price-to-rent
- 5.8×
Monthly cashflow live
- Estimated rent
- $1,146 medium interval (Pro) →
- Mortgage (P&I)
- −$420
- Tax from tax record
- −$258 /mo · $3,097/yr
- Insurance
- −$33
- HOA
- −$0
- Vacancy / Maint / Mgmt
- −$241
- Net cashflow
- $195
Break-even live
UW: 25.0% down · 7.5% · 30yr · 1.5% tax · 5.0% vac · 8.0% maint · 8.0% mgmt
Financing live
Cash to close
- Down payment
- $20,000
- Closing costs
- $2,400
- Reserves months
- —
- Total cash needed
- —
Loan-product check · same deal, 3 products live
Conventional
25% down · 7.5% · 30yr
- Down + closing
- —
- Monthly P&I
- —
- Monthly cashflow
- —
- DSCR
- —
- Eligible?
- —
Personal DTI + credit; lowest rate.
DSCR
20% down · 8.5% · 30yr
- Down + closing
- —
- Monthly P&I
- —
- Monthly cashflow
- —
- DSCR
- —
- Eligible?
- —
No personal income docs; deal must DSCR.
Hard money
10% down · 12.0% · 12mo
- Down + closing
- —
- Monthly P&I
- —
- Monthly cashflow
- —
- DSCR
- —
- Eligible?
- —
Short-term bridge; refi at stabilization.
Listing history 21 events
-
2026-06-18days on market $80,000 Active 105 DOM
-
2026-06-17days on market $80,000 Active 104 DOM
-
2026-06-16days on market $80,000 Active 103 DOM
-
2026-06-15days on market $80,000 Active 102 DOM
-
2026-06-13days on market $80,000 Active 100 DOM
-
2026-06-09days on market $80,000 Active 96 DOM
-
2026-06-08days on market $80,000 Active 95 DOM
-
2026-06-07days on market $80,000 Active 94 DOM
-
2026-06-04days on market $80,000 Active 91 DOM
-
2026-06-03days on market $80,000 Active 90 DOM
-
2026-06-02days on market $80,000 Active 89 DOM
-
2026-06-01days on market $80,000 Active 88 DOM
-
2026-05-31days on market $80,000 Active 87 DOM
-
2026-03-05$80,000 Active
-
2025-11-26historical
-
2025-11-15$65,000 Active
-
2005-02-09soldstatus $50,000
-
2005-01-29soldstatus $50,000 251-char remark
Show marketing remark (251 chars)
Wooded lot in a very nice area in Alloway. There is a trailor on property with tenants but they have no lease. Seller is selling as ground and makes no warrants on the trailor. It is the buyer respon. to remove or fix the trailor. It is strictly AS IS
-
2004-10-03$50,000 251-char remark
Show marketing remark (251 chars)
Wooded lot in a very nice area in Alloway. There is a trailor on property with tenants but they have no lease. Seller is selling as ground and makes no warrants on the trailor. It is the buyer respon. to remove or fix the trailor. It is strictly AS IS
-
2004-10-03historical 251-char remark
Show marketing remark (251 chars)
Wooded lot in a very nice area in Alloway. There is a trailor on property with tenants but they have no lease. Seller is selling as ground and makes no warrants on the trailor. It is the buyer respon. to remove or fix the trailor. It is strictly AS IS
-
2002-12-10soldstatus $1
ⓘ Source: listings_history table (triggers on properties + properties_extension) + one-shot
backfill from property_details.listing_events for pre-trigger history.
Tax reassessment forecast NJ · Partial reset (capped growth)
- Current annual tax
- $3,097 · $258/mo
- Projected year-2 tax
- $3,097 · $258/mo
- Expected delta
- $0/yr ($0/mo · 0.0%)
ⓘ Screening estimate from a state-policy table — verify with the county assessor before closing.
Climate risk First Street
- Flood 1/10 Low FEMA zone X (unshaded) · 0% chance over 30 yrs
- Wildfire 6/10 Major
- Heat 7/10 Severe 7 d/yr ≥102°F today · 15 d/yr by 30 yrs out
- Wind 6/10 Major 27% chance of damaging wind over 30 yrs
- Air quality 3/10 Moderate 2 unhealthy d/yr today · 4 by 30 yrs out
Nearby sold comps map
Loading sold comps map…
Walkable amenities ~0.75 mi
Loading nearby amenities…
Taxation est. · year 1
- Rental income
- $13,757
- − Mortgage interest
- −$4,481
- − Property taxes
- −$3,097
- − Insurance
- −$400
- − Repairs & maintenance
- −$1,101
- − Management
- −$1,101
- − Depreciation
- −$2,327
- Taxable income
- $1,250
- Est. tax owed @ 24.0%
- −$300
- After-tax cash flow
- $2,036/yr
For passive investors: Depreciation is non-cash, so a rental often shows a tax loss while cash-flowing — sheltering income. Rental losses are passive: they offset passive income freely, and up to $25,000/yr can offset ordinary (W-2) income if you actively participate and your MAGI is under $100k (phasing out to $0 by $150k); unused losses carry forward. On sale, claimed depreciation is recaptured at up to 25%, and gains may owe capital-gains tax (a 1031 exchange can defer both). Figures are a year-1 estimate at your 24.0% rate — not tax advice; consult a CPA.
Schools (NCES district)
- District
- Alloway Twp School District
- NCES district ID
- 3400810
- Math proficiency
- 48% ▼ -1.00%
- Reading proficiency
- 52% ▼ -7.00%
- Median HH income
- $75,696
- Composite
- 47.25/100
- National rank
- #5073
- State rank
- #350 of 612 in NJ
Livability — Alloway
- Score
- 66/100
- State rank
- #368
- US rank
- #12334
Category grades
Schools grade is shown separately in the Schools card above.
Census & demographics
- Census place
- Alloway, NJ
- City population
- 931
- Population (ZIP)
- 931
Population outlook (Salem County) Hauer SSP2
- Today (2025)
- 59,905 people
- By 2030
- 57,351 · -4.3%
- By 2040
- 51,837 · -13.5%
- By 2050
- 46,356 · -22.6%
- By 2075
- 36,452 · -39.2%
- By 2100
- 28,907 · -51.7%
Race, ethnicity, and origin ACS 2023
- Neighborhood character
- Predominantly White (89%)
- Race & ethnicity
- White 89% Hispanic / Latino 7% Two or more races 5% Black 3%
- Hispanic origin (detail)
- Puerto Rican 4% Cuban 3%
- Common ancestry
- Lithuanian 5% Slovak 4% Romanian 1%
- Foreign-born
- 0%
- Languages at home
- 97% English-only · Spanish 3%
Political lean MEDSL · Salem
- 2024 margin
- R (+19.2) · D 39.6% · R 58.8% · Other 1.6%
- 2008→2024 swing
- -23.1pp toward R · 2008: 3.9pp · 2024: -19.2pp
- All cycles
- 2024: R+19.2 2020: R+12.8 2016: R+15.4 2012: D+0.8 2008: D+3.9
Not yet ingested
- Civics
- —
Market trends
- HPI YoY
- ▲ 1.60%
- Current HPI
- 179.181
- Rent YoY
- —
- Metro
- —
- State GDP YoY
- ▲ 2.05%
- F500 in state
- 34
Industry mix (Fortune 500 HQ in NJ)
| Industry | F500 HQs | Revenue |
|---|---|---|
| Consumer Goods | 3 | $31B |
|
||
| Pharmaceuticals | 2 | $153B |
|
||
| Technology | 2 | $21B |
|
||
| Insurance | 2 | $20B |
|
||
| Healthcare | 2 | $19B |
|
||
| Financial Services | 1 | $70B |
|
||
Price history
+60.0% since first listed8 events — show timeline
- 2026-03-05 Listed $80,000 BRIGHT MLS
- 2025-11-26 Listing Removed — BRIGHT MLS
- 2025-11-15 Listed $65,000 BRIGHT MLS
- 2005-02-09 Sold (Public Records) $50,000 Public Records
- 2005-01-29 Sold (MLS) $50,000 BRIGHT MLS
- 2004-10-03 Listing Removed — BRIGHT MLS
- 2004-10-03 Listed $50,000 BRIGHT MLS
- 2002-12-10 Sold (Public Records) $1 Public Records
Property tax history
+3.3%/yrLatest (2025): $3,097 · +4.0% YoY. Source: county tax records.
Cash-flow waterfall
monthlySold comps — $/sqft
last 12 mo · ≤1 miLoading sold comps…