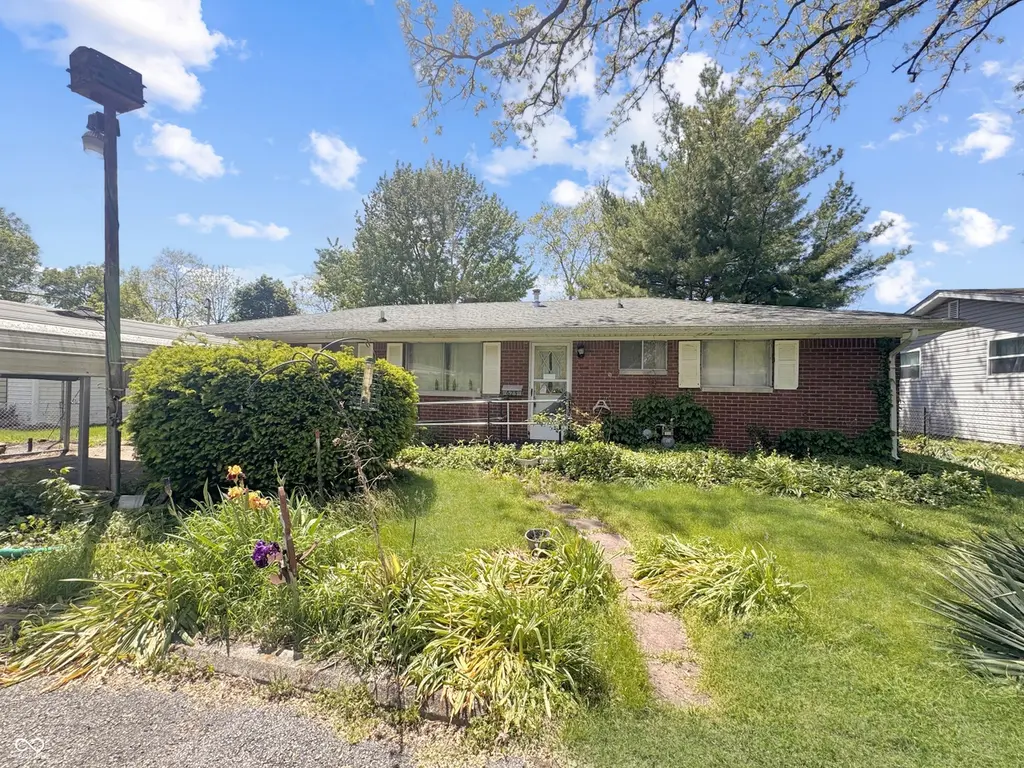
623 N Willow Dr · Marion, IN
Flood risk 9/10 · Severe
- FEMA flood zone
- AE
- Chance of flooding over 30 yrs
- 0.99%
- Est. flood insurance / yr
- $1,737 – $8,500
Fire risk 1/10 · Minimal
- Est. fire insurance / yr
- $717 – $1,331
Heat risk 3/10 · Minor
- Hot days now (above 101°F)
- 7 days/yr
- Hot days in 30 yrs
- 18 days/yr
Wind risk 2/10 · Minimal
- Chance of severe wind over 30 yrs
- —
Air-quality risk 2/10 · Minimal
- Unhealthy air days now
- 1 days/yr
- Unhealthy air days in 30 yrs
- 3 days/yr
Risk factors via First Street. Map © Google.
Why this score? — see what drove the B grade
The composite is a weighted blend of 9 inputs, each scored 0–100. Each bar is that input's sub-score; the figure is the points it added to the 100-point composite (weight × sub-score).
- Cash flow +30.0/30.0
- ARV discount +15.0/15.0
- 1% rule +10.0/10.0
- DSCR +10.0/10.0
- Livability +3.2/5.0
- Rent growth +2.5/5.0
- Condition / age +2.5/5.0
- Schools +1.7/10.0
- Appreciation +0.0/10.0
$59,000
🖨 Deal sheet 📄 Offer letter ✓ Due diligence
Key facts
- 7,788 sq ft lot
- Garage
- Built 1962
Property features AI
Exterior
- Parking: Attached garage (1-car)
- Utilities: Public water; Municipal sewer connected; Solid waste service available
- Home design: Single-family residence; One-level (single story)
- Construction: Vinyl siding; Crawl space foundation
- Exterior features: Lot under 1/4 acre (approximately 0.18 acre)
Interior
- Kitchen: No appliances included
- Bedrooms: Three bedrooms on the main level
- Bathrooms: One full bathroom; One half bathroom
- Heating & cooling: Forced air heating; Central air conditioning
- Interior features: Living room fireplace; Five main-level rooms
- Laundry & utility: No specific laundry or utility features listed
Neighborhood map
What this means for you Summary
Snapshot
- This is a 3-bed/1.5-bath single-family listed at $59k.
Deal economics
- At list price, monthly cash flow is $47 ($568/yr) — positive.
- The deal already cash-flows at list — no discount required.
- Meets the 1% rule at list price ($1k rent vs $59k).
- Cap rate 15.9% vs local median 8.7% in Marion — top-decile yield for the area; either an underpriced asset or a hidden risk that comps aren't pricing in. Stress-test before assuming the spread holds.
Location & tenants
- Location reads 65/100 on livability (#337 in IN) — a middle-class / working-renter tenant base. Strengths: crime A+, cost of living A+, housing A+; Watch: amenities F, commute F, employment F.
- Marion Community Schools (town): math 18% / reading 24% proficiency, ranked #277 of 301 in IN (top 92%) — low school quality limits family demand, transient renter base, plan for 1-2y turnover; 67% free/reduced lunch — lower-income household profile, screen leases tightly.
- Zoned schools: Marion High School (math 12% / reading 47%, grade F, #308 of 369 statewide, top 84%, 1,050 students, 66% FRL) — zoned schools at 66% FRL track the district average.
- Market conditions: 124 active listings in the ZIP; 1 comparable units currently listed for rent nearby; 52 units permitted in Grant County in 2024 (8 in 5+ unit buildings).
Forward outlook
- Local home prices are declining (-3.0%/yr); year-one equity from $408 of loan paydown is wiped out by about $2k of value loss. Plan a longer hold.
- Grant County population projected at -18% by 2050 — secular population decline; favor cash flow + early exit over multi-decade hold.
Negotiation context
- Only 3 days on market — expect competitive offers; lowballing is unlikely to land.
Risks & watch-outs
- Watch-outs: flood insurance adds $427/mo.
- Climate carrying-cost: in FEMA flood zone AE (mandatory federal flood insurance) — expect insurance premiums to compound above CPI over the hold.
Questions for the listing agent
- Built in 1962 — when were the roof, HVAC, electrical panel, plumbing, and water heater last replaced?
- What's the actual annual flood-insurance premium (NFIP or private), and is the property in a SFHA with mandatory coverage?
- Is there a deadline driving the sale (1031 exchange, divorce, estate, relocation)? That informs how much negotiation room exists.
- Schools are F-rated, which usually means shorter tenancies and higher turnover. Who's the typical renter profile here, and what's been the actual vacancy rate?
- What's the average days-on-market for RENTAL listings here right now (not sales)? A rising rental-DOM trend means longer vacancies and softer asking-rent achievability than the comps imply.
- What's the recent tenant-quality profile in this submarket — average credit score on applications, eviction rate, late-payment / NSF rate, and stable-employment percentage? A property-management company in the area should have these aggregated.
- How much new for-sale + rental construction is in the pipeline within 1–3 miles? Heavy new supply typically softens prices + rents 12–24 months out; constrained supply supports both.
Investment metrics
- 1% rule
- 1.89% ✓
- Cap rate
- 15.93%
- Cash-on-cash
- 34.42%
- DSCR
- 2.53
- GRM
- 4.4
CMA / ARV
- ARV (median comp)
- $83,223
- List price
- $59,000
- Delta
- -29.11%
- Verdict
- UNDERPRICED
- Comps
- 20 within 1.0 mi
Show comp detail 12 sales within ~0.75 mi
| Address | Dist | Beds/Ba | Sqft | Sold | Price | $/sf | Match |
|---|---|---|---|---|---|---|---|
| 623 N Willow Dr | 0.00mi | 3/1.5 | 1,025 (0%) | 0mo | $55,000 | $54 | 100 |
| 211 W Wharton Dr | 0.40mi | 3/2.0 | 1,040 (+2%) | 12mo | $143,000 | $138 | 67 |
| 535 E Bradford St | 0.50mi | 3/1.0 | 1,036 (+1%) | 11mo | $137,900 | $133 | 64 |
| 508 W Kem Rd | 0.39mi | 3/1.0 | 1,073 (+5%) | 10mo | $156,000 | $145 | 63 |
| 610 W Buckingham Dr | 0.27mi | 2/1.0 (-1) | 960 (-6%) | 9mo | $125,000 | $130 | 62 |
| 526 E Marshall St | 0.53mi | 2/1.0 (-1) | 1,008 (-2%) | 7mo | $128,000 | $127 | 59 |
| 323 W Highland Ave | 0.48mi | 3/1.5 | 1,152 (+12%) | 3mo | $133,797 | $116 | 55 |
| 707 Crestview Dr | 0.64mi | 3/1.0 | 960 (-6%) | 6mo | $108,500 | $113 | 53 |
| 1212 N Quarry Rd | 0.44mi | 2/1.0 (-1) | 972 (-5%) | 13mo | $134,000 | $138 | 53 |
| 116 E Stephenson St | 0.58mi | 2/1.0 (-1) | 1,090 (+6%) | 4mo | $93,500 | $86 | 52 |
| 626 E Swayzee St | 0.71mi | 2/1.0 (-1) | 1,056 (+3%) | 4mo | $109,000 | $103 | 51 |
| 1026 N Branson St | 0.39mi | 3/1.0 | 940 (-8%) | 17mo | $48,000 | $51 | 51 |
Match score weights: distance 35% · size 25% · config 20% · recency 20%. Top-matched comps best support the ARV.
Projected returns pro-forma
-3.0% appreciation · 3.0% rent growth · sell at horizon
- IRR
- -10.4%
- Equity multiple
- 0.62×
- Total profit
- $-6,264
- Equity at exit
- $8,797
- IRR
- -0.4%
- Equity multiple
- 0.97×
- Total profit
- $-437
- Equity at exit
- $5,101
Cash invested: $16,520 (down + closing). Projections, not guarantees.
Landlord ↔ Tenant lean methodology
- Overall (STATE)
- 90 Strongly Landlord-Friendly
- State Indiana
- 90 Strongly Landlord-Friendly · R+11
- County
- — inherits STATE
- City
- — inherits STATE
ZIP-level market 46952
- Home prices YoY
- -29.9%
- Active inventory
- 124
- Price-to-rent
- 4.4×
Monthly cashflow live
- Estimated rent
- $1,116 medium interval (Pro) →
- Mortgage (P&I)
- −$309
- Tax est. 1.5%
- −$74 /mo · $885/yr
- Insurance
- −$25
- Flood insurance flood zone
- −$427 /mo · $5,118/yr
- HOA
- −$0
- Vacancy / Maint / Mgmt
- −$234
- Net cashflow
- $47
Break-even live
UW: 25.0% down · 7.5% · 30yr · 1.5% tax · 5.0% vac · 8.0% maint · 8.0% mgmt
Financing live
Cash to close
- Down payment
- $14,750
- Closing costs
- $1,770
- Reserves months
- —
- Total cash needed
- —
Loan-product check · same deal, 3 products live
Conventional
25% down · 7.5% · 30yr
- Down + closing
- —
- Monthly P&I
- —
- Monthly cashflow
- —
- DSCR
- —
- Eligible?
- —
Personal DTI + credit; lowest rate.
DSCR
20% down · 8.5% · 30yr
- Down + closing
- —
- Monthly P&I
- —
- Monthly cashflow
- —
- DSCR
- —
- Eligible?
- —
No personal income docs; deal must DSCR.
Hard money
10% down · 12.0% · 12mo
- Down + closing
- —
- Monthly P&I
- —
- Monthly cashflow
- —
- DSCR
- —
- Eligible?
- —
Short-term bridge; refi at stabilization.
Rent comps 1 comps
| Address | Beds | Baths | Sqft | Rent | $/sqft | DOM | Units | Dist |
|---|---|---|---|---|---|---|---|---|
| 715 E Sherman St Marion, IN | 2.0 | 1.0 | 1085 | $1,050 | $0.97 | 44d | 1 | 0.78mi |
Listing history 2 events
-
2026-05-16status Pending 764-char remark
-
2026-04-09$59,000 Active 764-char remark
ⓘ Source: listings_history table (triggers on properties + properties_extension) + one-shot
backfill from property_details.listing_events for pre-trigger history.
Climate risk First Street
- Flood 9/10 Extreme FEMA zone AE · 99% chance over 30 yrs
- Wildfire 1/10 Low
- Heat 3/10 Moderate 7 d/yr ≥101°F today · 18 d/yr by 30 yrs out
- Wind 2/10 Low
- Air quality 2/10 Low 1 unhealthy d/yr today · 3 by 30 yrs out
Nearby sold comps map
Loading sold comps map…
Walkable amenities ~0.75 mi
Loading nearby amenities…
Taxation est. · year 1
- Rental income
- $13,392
- − Mortgage interest
- −$3,305
- − Property taxes
- −$885
- − Insurance
- −$5,414
- − Repairs & maintenance
- −$1,071
- − Management
- −$1,071
- − Depreciation
- −$1,716
- Taxable loss
- −$70
- Est. tax savings @ 24.0%
- +$17
- After-tax cash flow
- $585/yr
For passive investors: Depreciation is non-cash, so a rental often shows a tax loss while cash-flowing — sheltering income. Rental losses are passive: they offset passive income freely, and up to $25,000/yr can offset ordinary (W-2) income if you actively participate and your MAGI is under $100k (phasing out to $0 by $150k); unused losses carry forward. On sale, claimed depreciation is recaptured at up to 25%, and gains may owe capital-gains tax (a 1031 exchange can defer both). Figures are a year-1 estimate at your 24.0% rate — not tax advice; consult a CPA.
Schools (NCES district)
- District
- Marion Community Schools
- NCES district ID
- 1806390
- Math proficiency
- 18% ▼ -9.00%
- Reading proficiency
- 24% ▼ -6.00%
- Median HH income
- $33,415
- Composite
- 17.13/100
- National rank
- #9115
- State rank
- #277 of 301 in IN
Livability — Marion
- Score
- 65/100
- State rank
- #337
- US rank
- #13006
Category grades
Schools grade is shown separately in the Schools card above.
Census & demographics
- Census place
- Marion, IN
- County
- Grant County · 41,561 people
- City population
- 41,561
- Metro
- Marion, IN
- Population (ZIP)
- 18,189
- Household income
- $52,880
- Rent vs Own
- Severe rent burden
- 662.0
Population outlook (Grant County) Hauer SSP2
- Today (2025)
- 64,394 people
- By 2030
- 62,145 · -3.5%
- By 2040
- 57,252 · -11.1%
- By 2050
- 52,968 · -17.7%
- By 2075
- 45,986 · -28.6%
- By 2100
- 39,400 · -38.8%
Race, ethnicity, and origin ACS 2023
- Neighborhood character
- Predominantly White (84%)
- Race & ethnicity
- White 84% Two or more races 7% Hispanic / Latino 5% Black 4% Asian 1%
- Hispanic origin (detail)
- Mexican 4%
- Common ancestry
- Italian 3% Romanian 1% Iranian 1%
- Foreign-born
- 4% · Canada
- Languages at home
- 96% English-only · Spanish 3%
Political lean MEDSL · Grant
- 2024 margin
- Solid R (+41.8) · D 28.2% · R 70.0% · Other 1.9%
- 2008→2024 swing
- -28.7pp toward R · 2008: -13.1pp · 2024: -41.8pp
- All cycles
- 2024: R+41.8 2020: R+38.8 2016: R+39.5 2012: R+22.0 2008: R+13.1
Not yet ingested
- Civics
- —
Market trends
- HPI YoY
- ▼ -76.69%
- Current HPI
- 180.1174
- Rent YoY
- —
- Metro
- Marion, IN
- State GDP YoY
- ▲ 2.90%
- F500 in state
- 18
Industry mix (Fortune 500 HQ in IN)
| Industry | F500 HQs | Revenue |
|---|---|---|
| Industrial Machinery | 2 | $37B |
|
||
| Healthcare | 1 | $177B |
|
||
| Pharmaceuticals | 1 | $45B |
|
||
| Metals / Steel | 1 | $18B |
|
||
| Agriculture | 1 | $17B |
|
||
| Packaging | 1 | $12B |
|
||
Price history
-6.8% since first listed3 events — show timeline
- 2026-06-12 Sold (MLS) $55,000 MIBOR as Distributed by MLS Grid
- 2026-05-16 Pending — MIBOR as Distributed by MLS Grid
- 2026-04-09 Listed $59,000 MIBOR as Distributed by MLS Grid
Property tax history
-14.1%/yrLatest (2025): $48 · +2.0% YoY. Source: county tax records.
Cash-flow waterfall
monthlySold comps — $/sqft
last 12 mo · ≤1 miLoading sold comps…