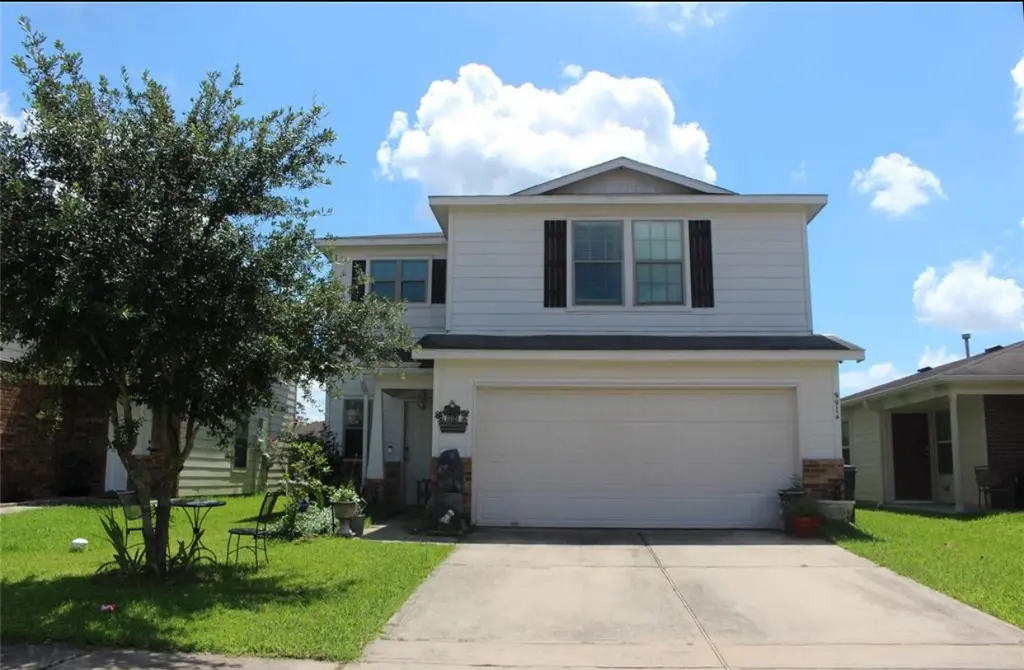
9914 Waldens Pond Ct · Houston, TX
Flood risk 4/10 · Minor
- FEMA flood zone
- X (unshaded)
- Chance of flooding over 30 yrs
- 0.27%
- Est. flood insurance / yr
- $507 – $1,088
Fire risk 5/10 · Moderate
- Est. fire insurance / yr
- $1,222 – $2,270
Heat risk 9/10 · Severe
- Hot days now (above 110°F)
- 7 days/yr
- Hot days in 30 yrs
- 26 days/yr
Wind risk 9/10 · Severe
- Chance of severe wind over 30 yrs
- 99.0%
Air-quality risk 3/10 · Minor
- Unhealthy air days now
- 2 days/yr
- Unhealthy air days in 30 yrs
- 3 days/yr
Risk factors via First Street. Map © Google.
Why this score? — see what drove the D grade
The composite is a weighted blend of 9 inputs, each scored 0–100. Each bar is that input's sub-score; the figure is the points it added to the 100-point composite (weight × sub-score).
- ARV discount +9.7/15.0
- Cash flow +8.6/30.0
- 1% rule +4.5/10.0
- Appreciation +4.2/10.0
- Livability +3.7/5.0
- Rent growth +2.7/5.0
- Condition / age +2.5/5.0
- DSCR +2.4/10.0
- Schools +2.0/10.0
$238,000
🖨 Deal sheet (PDF) 📄 Offer letter ✓ Due diligence
Listing remarks MLS
View this 3 bedroom, 3 full bath, two-story home near the beltway and HWY 90. Open floor plan, home boasts lots of natural light. An open concept kitchen is neighbored with a dining room and a living room that comes with a fireplace. A space that is welcoming to family gatherings. Schedule your showing today and come see a house ready to be a home.
Key facts
- Open floor plan
- Open concept kitchen
- Living room
Tags
Neighborhood map
What this means for you Summary
Snapshot
- This is a 4-bed/2.0-bath single-family listed at $238k.
Deal economics
- At list price, monthly cash flow is $-204 ($-2k/yr) — negative.
- To cash-flow at today's rent, offer at most $202k (15.2% below list).
- To meet the 1% rule (rent ≥ 1% of price), the offer needs to be $226k (5.2% below list).
- Recommended offer: $202k (15.2% below list) — sets the bar for cash-flow.
- Cap rate 5.3% vs local median 3.2% in Houston — top-decile yield for the area; either an underpriced asset or a hidden risk that comps aren't pricing in. Stress-test before assuming the spread holds.
Location & tenants
- Location reads 74/100 on livability (#184 in TX, #4,771 nationally) — a middle-class / working-renter tenant base. Strengths: amenities A+, cost of living A+, housing A+; Watch: crime F.
- Sheldon ISD (suburban): math 19% / reading 25% proficiency, ranked #746 of 826 in TX (top 90%) — low school quality limits family demand, transient renter base, plan for 1-2y turnover; 72% free/reduced lunch — lower-income household profile, screen leases tightly.
- Zoned schools: Sheldon Early Childhood Academy (589 students, 87% FRL); Michael R Null Middle (math 15% / reading 23%, grade F, #1,466 of 1,662 statewide, top 89%, 1,164 students, 89% FRL); C E King H S (math 19% / reading 30%, grade F, #1,264 of 1,632 statewide, top 82%, 3,473 students, 82% FRL).
- Market conditions: Rents flat; 340 active listings in the ZIP; 12 comparable units currently listed for rent nearby; rentals at typical pace (median 24d on market — plan ~3-4 weeks tenant-placement turnaround); solid renter incomes; 29,883 units permitted in Harris County in 2024 (8,621 in 5+ unit buildings).
Forward outlook
- Local home prices are declining (-1.6%/yr); year-one equity from $2k of loan paydown is wiped out by about $4k of value loss. Plan a longer hold.
- Harris County population projected at +47% by 2050 — long-run rental-demand tailwind backs the buy-and-hold thesis.
Negotiation context
- It's been on market 329 days — a 12% lower offer ($209k) is reasonable based on typical stale-listing flexibility.
- 3 sale attempts since 8y ago with the ask held roughly flat each time — persistent listings suggest the price (not the market) is what's stuck; bring a comps-based counter.
Risks & watch-outs
- Watch-outs: property tax is 3.1% of price.
- Climate carrying-cost: severe wind risk, 99% chance of damaging wind over 30y; moderate wildfire risk; extreme-heat days projected 7→26/yr by 2055 (HVAC capex compounding) — expect insurance premiums to compound above CPI over the hold.
Questions for the listing agent
- What do current leases actually rent for vs. the listed asking? Can we see a recent rent roll and the last 12 months of T-12 income?
- It's been on market 329 days. Have you received any prior offers? Is the seller open to a 15% concession, seller financing, or rate buy-down credit?
- Property tax is high relative to price — has the assessment been appealed recently, and will the sale trigger a re-assessment?
- What does the HOA fee cover, when was the last increase, and are there any pending special assessments or reserve-fund shortfalls?
- Why hasn't it sold? Are there any deal-killer items the seller is aware of (foundation, flood, title, zoning, code violations)?
- Is there a deadline driving the sale (1031 exchange, divorce, estate, relocation)? That informs how much negotiation room exists.
- Schools are D-rated, which usually means shorter tenancies and higher turnover. Who's the typical renter profile here, and what's been the actual vacancy rate?
- Crime grade is F in this area — have there been break-ins, vandalism, or insurance claims at this property in the last 3 years? What carrier currently insures it and at what premium?
- The area grade is low — what's the realistic commute time and amenity access for the typical tenant pool here? Any planned neighborhood developments (good or bad) we should know about?
- What's the average days-on-market for RENTAL listings here right now (not sales)? A rising rental-DOM trend means longer vacancies and softer asking-rent achievability than the comps imply.
- What's the recent tenant-quality profile in this submarket — average credit score on applications, eviction rate, late-payment / NSF rate, and stable-employment percentage? A property-management company in the area should have these aggregated.
- How much new for-sale + rental construction is in the pipeline within 1–3 miles? Heavy new supply typically softens prices + rents 12–24 months out; constrained supply supports both.
Investment metrics
- 1% rule
- 0.95% ✗
- Cap rate
- 5.26%
- Cash-on-cash
- -3.68%
- DSCR
- 0.84
- GRM
- 8.8
CMA / ARV
- ARV (median comp)
- $250,362
- List price
- $238,000
- Delta
- -4.94%
- Verdict
- FAIR
- Comps
- 20 within 1.0 mi
Show comp detail 12 sales within ~0.75 mi
| Address | Dist | Beds/Ba | Sqft | Sold | Price | $/sf | Match |
|---|---|---|---|---|---|---|---|
| 9902 Waldens Pond Ct | 0.02mi | 4/3.0 | 2,127 (0%) | 9mo | $243,990 | $115 | 88 |
| 9523 Brandon Rock Ln | 0.25mi | 3/2.5 (-1) | 2,088 (-2%) | 4mo | $235,000 | $113 | 75 |
| 10011 Orchid Spring Ln | 0.10mi | 3/2.5 (-1) | 1,951 (-8%) | 4mo | $250,000 | $128 | 71 |
| 10023 Yanet Grove Ln | 0.26mi | 4/2.5 | 1,960 (-8%) | 2mo | $270,000 | $138 | 71 |
| 9511 Alex Springs Ln | 0.24mi | 3/2.5 (-1) | 2,270 (+7%) | 1mo | $254,900 | $112 | 70 |
| 9826 Orchid Spring Ln | 0.11mi | 3/3.0 (-1) | 1,960 (-8%) | 6mo | $244,900 | $125 | 67 |
| 10126 Churchill Oaks Ln | 0.19mi | 4/2.5 | 2,372 (+12%) | 4mo | $265,000 | $112 | 66 |
| 10002 Sally Grove Ct | 0.40mi | 4/2.5 | 2,222 (+4%) | 8mo | $269,999 | $122 | 65 |
| 13138 Cherryglade Ct | 0.59mi | 4/2.5 | 2,200 (+3%) | 8mo | $243,500 | $111 | 58 |
| 13230 Montane Manor Ln | 0.47mi | 3/2.5 (-1) | 1,876 (-12%) | 6mo | $234,500 | $125 | 46 |
| 9127 Georgio Dr | 0.74mi | 3/2.5 (-1) | 2,260 (+6%) | 11mo | $290,000 | $128 | 39 |
| 12838 Windy Summer Ln | 0.69mi | 3/2.0 (-1) | 1,829 (-14%) | 11mo | $255,000 | $139 | 30 |
Match score weights: distance 35% · size 25% · config 20% · recency 20%. Top-matched comps best support the ARV.
Projected returns pro-forma
-1.59% appreciation · 0.92% rent growth · sell at horizon
- IRR
- -15.7%
- Equity multiple
- 0.38×
- Total profit
- $-41,544
- Equity at exit
- $50,829
- IRR
- -11.6%
- Equity multiple
- 0.14×
- Total profit
- $-57,009
- Equity at exit
- $47,918
Cash invested: $66,640 (down + closing). Projections, not guarantees.
Landlord ↔ Tenant lean methodology
- Overall (STATE)
- 87 Strongly Landlord-Friendly
- State Texas
- 87 Strongly Landlord-Friendly · R+5
- County
- — inherits STATE
- City
- — inherits STATE
ZIP-level market 77044
- Home prices YoY
- -0.7%
- Rents YoY
- 0.9%
- Active inventory
- 340
- Price-to-rent
- 8.8×
Monthly cashflow live
- Estimated rent
- $2,255 high interval (Pro) →
- Mortgage (P&I)
- −$1,248
- Tax from tax record
- −$609 /mo · $7,306/yr
- Insurance
- −$99
- HOA
- −$30
- Vacancy / Maint / Mgmt
- −$474
- Net cashflow
- $-204
Break-even live
Sensitivity live
| Price | -10% $-70 | -5% $-137 | +0% $-204 | +5% $-272 | +10% $-339 |
|---|---|---|---|---|---|
| Rent | -10% $-383 | -5% $-294 | +0% $-204 | +5% $-115 | +10% $-26 |
| Rate | -1.0pp $-85 | -0.5pp $-144 | base $-204 | +0.5pp $-266 | +1.0pp $-329 |
UW: 25.0% down · 7.5% · 30yr · 1.5% tax · 5.0% vac · 8.0% maint · 8.0% mgmt
Financing live
Cash to close
- Down payment
- $59,500
- Closing costs
- $7,140
- Reserves months
- —
- Total cash needed
- —
Loan-product check · same deal, 3 products live
Conventional
25% down · 7.5% · 30yr
- Down + closing
- —
- Monthly P&I
- —
- Monthly cashflow
- —
- DSCR
- —
- Eligible?
- —
Personal DTI + credit; lowest rate.
DSCR
20% down · 8.5% · 30yr
- Down + closing
- —
- Monthly P&I
- —
- Monthly cashflow
- —
- DSCR
- —
- Eligible?
- —
No personal income docs; deal must DSCR.
Hard money
10% down · 12.0% · 12mo
- Down + closing
- —
- Monthly P&I
- —
- Monthly cashflow
- —
- DSCR
- —
- Eligible?
- —
Short-term bridge; refi at stabilization.
Rent comps 12 comps
| Address | Beds | Baths | Sqft | Rent | $/sqft | DOM | Units | Dist |
|---|---|---|---|---|---|---|---|---|
| 10103 Dawson Hill Ln Houston, TX | 3.0 | 2.5 | 2021 | $2,249 | $1.11 | 23d | 1 | 0.16mi |
| 10306 White Fir Villa Ave Houston, TX | 3.0 | 2.0 | 1560 | $2,100 | $1.35 | 45d | 1 | 0.49mi |
| 13206 Clifton Hill Ln Houston, TX | 3.0 | 2.0 | 1632 | $2,500 | $1.53 | 19d | 1 | 0.52mi |
| 10007 Copper Hollow Ln Houston, TX | 4.0 | 2.0 | 1773 | $1,700 | $0.96 | 46d | 1 | 0.69mi |
| 10410 Solitude Way Houston, TX | 3.0 | 2.5 | 2174 | $2,100 | $0.97 | 4d | 1 | 0.74mi |
| 13030 Sandhill Park Ln Houston, TX | 4.0 | 2.0 | 2402 | $2,120 | $0.88 | 3d | 1 | 0.84mi |
| 9418 Belleclaire Ln Houston, TX | 3.0 | 2.0 | 1424 | $1,950 | $1.37 | 26d | 1 | 0.87mi |
| 13150 Cutler Ridge Ln Houston, TX | 4.0 | 2.5 | 2264 | $2,195 | $0.97 | 7d | 1 | 0.95mi |
| 12319 Garden Gale Ln Houston, TX | 3.0 | 2.0 | 1716 | $1,766 | $1.03 | 7d | 1 | 1.06mi |
| 12315 Roy Mix Bohn Ln Houston, TX | 3.0 | 2.0 | 1433 | $1,750 | $1.22 | 45d | 1 | 1.31mi |
| 12703 Enchanted Path Dr Houston, TX | 3.0 | 2.0 | 1432 | $1,701 | $1.19 | 14d | 1 | 1.31mi |
| 12227 Ghita Ln Houston, TX | 3.0 | 2.0 | 1433 | $1,750 | $1.22 | 45d | 1 | 1.42mi |
HOA detail
- Monthly dues
- $30 · $360/yr
Listing history 22 events
-
2026-06-21days on market $238,000 Active 329 DOM
-
2026-06-18days on market $238,000 Active 326 DOM
-
2026-06-17days on market $238,000 Active 325 DOM
-
2026-06-16days on market $238,000 Active 324 DOM
-
2026-06-15days on market $238,000 Active 323 DOM
-
2026-06-13days on market $238,000 Active 321 DOM
-
2026-06-09days on market $238,000 Active 317 DOM
-
2026-06-08days on market $238,000 Active 316 DOM
-
2026-06-07days on market $238,000 Active 315 DOM
-
2026-06-04days on market $238,000 Active 312 DOM
-
2026-06-03days on market $238,000 Active 311 DOM
-
2026-06-02days on market $238,000 Active 310 DOM
-
2026-06-01days on market $238,000 Active 309 DOM
-
2026-05-31days on market $238,000 Active 308 DOM
-
2026-03-18price $238,000 351-char remark
Show marketing remark (351 chars)
View this 3 bedroom, 3 full bath, two-story home near the beltway and HWY 90. Open floor plan, home boasts lots of natural light. An open concept kitchen is neighbored with a dining room and a living room that comes with a fireplace. A space that is welcoming to family gatherings. Schedule your showing today and come see a house ready to be a home.
-
2025-07-27$240,000 Active 351-char remark
Show marketing remark (351 chars)
View this 3 bedroom, 3 full bath, two-story home near the beltway and HWY 90. Open floor plan, home boasts lots of natural light. An open concept kitchen is neighbored with a dining room and a living room that comes with a fireplace. A space that is welcoming to family gatherings. Schedule your showing today and come see a house ready to be a home.
-
2025-07-27historical
Show marketing remark (351 chars)
View this 3 bedroom, 3 full bath, two-story home near the beltway and HWY 90. Open floor plan, home boasts lots of natural light. An open concept kitchen is neighbored with a dining room and a living room that comes with a fireplace. A space that is welcoming to family gatherings. Schedule your showing today and come see a house ready to be a home.
-
2025-06-26$255,000 Active
-
2018-09-24soldstatus
-
2018-09-21soldstatus Sold
-
2018-08-15status Pending
-
2018-07-27$169,000 Active
ⓘ Source: listings_history table (triggers on properties + properties_extension) + one-shot
backfill from property_details.listing_events for pre-trigger history.
Tax reassessment forecast TX · Resets to sale price
- Current annual tax
- $7,306 · $609/mo
- Projected year-2 tax
- $7,306 · $609/mo
- Expected delta
- $0/yr ($0/mo · 0.0%)
ⓘ Screening estimate from a state-policy table — verify with the county assessor before closing.
Climate risk First Street
- Flood 4/10 Moderate FEMA zone X (unshaded) · 27% chance over 30 yrs
- Wildfire 5/10 Major
- Heat 9/10 Extreme 7 d/yr ≥110°F today · 26 d/yr by 30 yrs out
- Wind 9/10 Extreme 99% chance of damaging wind over 30 yrs
- Air quality 3/10 Moderate 2 unhealthy d/yr today · 3 by 30 yrs out
Nearby sold comps map
Loading sold comps map…
Walkable amenities ~0.75 mi
Loading nearby amenities…
Taxation est. · year 1
- Rental income
- $27,063
- − Mortgage interest
- −$13,332
- − Property taxes
- −$7,306
- − Insurance
- −$1,190
- − Repairs & maintenance
- −$2,165
- − Management
- −$2,165
- − HOA
- −$360
- − Depreciation
- −$6,924
- Taxable loss
- −$6,378
- Est. tax savings @ 24.0%
- +$1,531
- After-tax cash flow
- $-922/yr
For passive investors: Depreciation is non-cash, so a rental often shows a tax loss while cash-flowing — sheltering income. Rental losses are passive: they offset passive income freely, and up to $25,000/yr can offset ordinary (W-2) income if you actively participate and your MAGI is under $100k (phasing out to $0 by $150k); unused losses carry forward. On sale, claimed depreciation is recaptured at up to 25%, and gains may owe capital-gains tax (a 1031 exchange can defer both). Figures are a year-1 estimate at your 24.0% rate — not tax advice; consult a CPA.
Schools (NCES district)
- District
- Sheldon ISD
- NCES district ID
- 4839990
- Math proficiency
- 19% ▼ -18.00%
- Reading proficiency
- 25% ▼ -10.00%
- Median HH income
- $49,443
- Composite
- 19.5/100
- National rank
- #8772
- State rank
- #746 of 826 in TX
Livability — Houston
- Score
- 74/100
- State rank
- #184
- US rank
- #4771
Category grades
Schools grade is shown separately in the Schools card above.
Census & demographics
- County
- Harris County · 4,702,590 people
- City population
- 3,226,434
- Metro
- Houston-The Woodlands-Sugar Land, TX
- Population (ZIP)
- 58,347
- Household income
- $95,000
- Rent vs Own
- Severe rent burden
- 1332.0
Population outlook (Harris County) Hauer SSP2
- Today (2025)
- 5,571,493 people
- By 2030
- 6,089,821 · +9.3%
- By 2040
- 7,142,806 · +28.2%
- By 2050
- 8,185,864 · +46.9%
- By 2075
- 10,574,329 · +89.8%
- By 2100
- 12,109,958 · +117.4%
Race, ethnicity, and origin ACS 2023
- Neighborhood character
- Diverse neighborhood (Simpson 0.66)
- Race & ethnicity
- Hispanic / Latino 44% Black 32% White 19% Two or more races 18% Native American 2% Asian 1%
- Hispanic origin (detail)
- Mexican 36%
- Common ancestry
- Lithuanian 1% Romanian 1% Iranian 1%
- Foreign-born
- 18% · Canada
- Languages at home
- 61% English-only · Spanish 35% French/Haitian/Cajun 1% Other Indo-European 1%
Political lean MEDSL · Harris
- 2024 margin
- Lean D (+5.5) · D 52.0% · R 46.4% · Other 1.6%
- 2008→2024 swing
- +3.9pp toward D · 2008: 1.6pp · 2024: 5.5pp
- All cycles
- 2024: D+5.5 2020: D+13.3 2016: D+12.4 2012: D+0.1 2008: D+1.6
Not yet ingested
- Civics
- —
Market trends
- HPI YoY
- ▼ -1.59%
- Current HPI
- 215.5736
- Rent YoY
- ▲ 0.92%
- Metro
- Houston-The Woodlands-Sugar Land, TX
- State GDP YoY
- ▲ 3.95%
- F500 in state
- 110
Industry mix (Fortune 500 HQ in TX)
| Industry | F500 HQs | Revenue |
|---|---|---|
| Energy | 16 | $1,198B |
|
||
| Technology | 5 | $198B |
|
||
| Engineering / Construction | 4 | $72B |
|
||
| Energy Services | 3 | $60B |
|
||
| Utilities | 3 | $41B |
|
||
| Healthcare | 2 | $330B |
|
||
Price history
+40.8% since first listed8 events — show timeline
- 2026-03-18 Price Changed $238,000 HARMLS
- 2025-07-27 Listing Removed — HARMLS
- 2025-07-27 Listed $240,000 HARMLS
- 2025-06-26 Listed $255,000 HARMLS
- 2018-09-24 Sold (Public Records) — Public Records
- 2018-09-21 Sold (MLS) — HARMLS
- 2018-08-15 Pending — HARMLS
- 2018-07-27 Listed $169,000 HARMLS
Property tax history
+5.1%/yrLatest (2025): $7,306 · +2.6% YoY. Source: county tax records.
Cash-flow waterfall
monthlySold comps — $/sqft
last 12 mo · ≤1 miLoading sold comps…