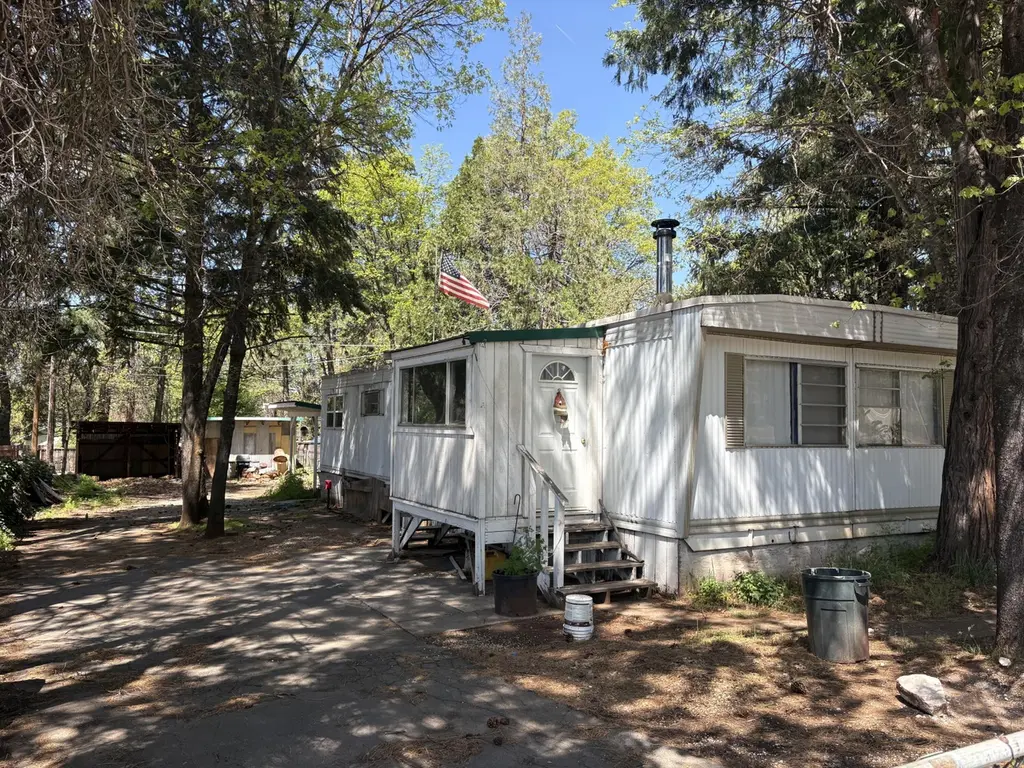
38288 Highway 299 E · Johnson Park, CA
Flood risk 1/10 · Minimal
- FEMA flood zone
- X (unshaded)
- Chance of flooding over 30 yrs
- 0.0%
- Est. flood insurance / yr
- $507 – $1,088
Fire risk 8/10 · Major
- Est. fire insurance / yr
- $659 – $1,223
Heat risk 4/10 · Minor
- Hot days now (above 95°F)
- 6 days/yr
- Hot days in 30 yrs
- 15 days/yr
Wind risk 1/10 · Minimal
- Chance of severe wind over 30 yrs
- —
Air-quality risk 10/10 · Severe
- Unhealthy air days now
- 34 days/yr
- Unhealthy air days in 30 yrs
- 37 days/yr
Risk factors via First Street. Map © Google.
Why this score? — see what drove the C grade
The composite is a weighted blend of 9 inputs, each scored 0–100. Each bar is that input's sub-score; the figure is the points it added to the 100-point composite (weight × sub-score).
- Cash flow +29.4/30.0
- DSCR +10.0/10.0
- 1% rule +7.1/10.0
- Schools +2.7/10.0
- Rent growth +2.5/5.0
- Livability +2.5/5.0
- Condition / age +2.5/5.0
- ARV discount +0.0/15.0
- Appreciation +0.0/10.0
$89,000
🖨 Deal sheet (PDF) 📄 Offer letter ✓ Due diligence
Listing remarks MLS
Why rent when you can buy ? OWN WILL CARRY Small down cheap payment This older mobile home site on a 6970 ft^2 lot and is 1000 ft^2 home
Key facts
- Parking
- Listed 56 days
Property features AI
Exterior
- Parking: Carport (1 space); On-street parking
- Home design: Manufactured in park (mobile home); Flat roof; United States model
- Construction: Aluminum siding; Other foundation
- Exterior features: Fenced yard; Level topography; Gravel road access; Highway frontage
Interior
- Kitchen: Range; Oven; Refrigerator
- Flooring: Laminate flooring
- Interior features: Free-standing fireplace
Neighborhood map
What this means for you Summary
Snapshot
- This is a 2-bed/2.0-bath manufactured listed at $89k.
Deal economics
- At list price, monthly cash flow is $315 ($4k/yr) — positive.
- The deal already cash-flows at list — no discount required.
- Meets the 1% rule at list price ($1k rent vs $89k).
- Recommended offer: $86k (3.0% below list) — sets the bar for market timing.
Location & tenants
- Location reads: area grade C — affects rentability + tenant quality, not the cash-flow math above.
- Fall River Joint Unified (rural): math 28% / reading 35% proficiency, ranked #335 of 517 in CA (top 65%) — families likely to look elsewhere, expect single-tenant / working-renter base with shorter leases.
- Zoned schools: Burney Elementary (math 22% / reading 22%, grade F, #1,179 of 1,571 statewide, top 78%, 345 students, 65% FRL); Burney Junior-Senior High (math 22% / reading 32%, grade F, #788 of 1,170 statewide, top 69%, 238 students, 51% FRL).
- Market conditions: 67 active listings in the ZIP; 246 units permitted in Shasta County in 2024 (0 in 5+ unit buildings).
Forward outlook
- Local home prices are declining (-3.0%/yr); year-one equity from $615 of loan paydown is wiped out by about $3k of value loss. Plan a longer hold.
- Shasta County population projected to shrink 9% by 2050 — rents likely to lag national; underwrite the cash flow, not the appreciation.
- At projected returns (-3.0% appreciation + 3.0% rent growth), your $25k cash investment doubles in ~8 years — after that, you're playing with house money.
Negotiation context
- It's been on market 56 days — a 3% lower offer ($86k) is reasonable based on typical stale-listing flexibility.
- 5 sale attempts since 6y ago with the ask held roughly flat each time — persistent listings suggest the price (not the market) is what's stuck; bring a comps-based counter.
Risks & watch-outs
- Climate carrying-cost: severe wildfire risk — expect insurance premiums to compound above CPI over the hold.
Questions for the listing agent
- It's been on market 56 days. Have you received any prior offers? Is the seller open to a 3% concession, seller financing, or rate buy-down credit?
- Is there a deadline driving the sale (1031 exchange, divorce, estate, relocation)? That informs how much negotiation room exists.
- What's the average days-on-market for RENTAL listings here right now (not sales)? A rising rental-DOM trend means longer vacancies and softer asking-rent achievability than the comps imply.
- What's the recent tenant-quality profile in this submarket — average credit score on applications, eviction rate, late-payment / NSF rate, and stable-employment percentage? A property-management company in the area should have these aggregated.
- How much new for-sale + rental construction is in the pipeline within 1–3 miles? Heavy new supply typically softens prices + rents 12–24 months out; constrained supply supports both.
Investment metrics
- 1% rule
- 1.21% ✓
- Cap rate
- 10.54%
- Cash-on-cash
- 15.15%
- DSCR
- 1.67
- GRM
- 6.9
CMA / ARV
- ARV (median comp)
- $71,920
- List price
- $89,000
- Delta
- 23.75%
- Verdict
- OVERPRICED
- Comps
- 1 within 2.0 mi
Show comp detail 2 sales within ~0.75 mi
| Address | Dist | Beds/Ba | Sqft | Sold | Price | $/sf | Match |
|---|---|---|---|---|---|---|---|
| 21630 S Cottonwood St. St | 0.34mi | 3/2.0 (+1) | 1,200 (+9%) | 15mo | $153,000 | $128 | 52 |
| 21590 Viola St | 0.64mi | 2/2.0 | 1,200 (+9%) | 8mo | $73,000 | $61 | 48 |
Match score weights: distance 35% · size 25% · config 20% · recency 20%. Top-matched comps best support the ARV.
Projected returns pro-forma
-3.0% appreciation · 3.0% rent growth · sell at horizon
- IRR
- 5.8%
- Equity multiple
- 1.22×
- Total profit
- $5,589
- Equity at exit
- $13,270
- IRR
- 15.1%
- Equity multiple
- 2.23×
- Total profit
- $30,546
- Equity at exit
- $7,695
Cash invested: $24,920 (down + closing). Projections, not guarantees.
Landlord ↔ Tenant lean methodology
- Overall (STATE)
- 18 Strongly Tenant-Friendly
- State California
- 18 Strongly Tenant-Friendly · D+13
- County
- — inherits STATE
- City
- — inherits STATE
ZIP-level market 96013
- Home prices YoY
- -32.2%
- Active inventory
- 67
- Price-to-rent
- 6.9×
Monthly cashflow live
- Estimated rent
- $1,077 medium interval (Pro) →
- Mortgage (P&I)
- −$467
- Tax from tax record
- −$33 /mo · $391/yr
- Insurance
- −$37
- HOA
- −$0
- Lot rent leased land?
- −$0
- Vacancy / Maint / Mgmt
- −$226
- Net cashflow
- $315
Break-even live
Sensitivity live
| Price | -10% $365 | -5% $340 | +0% $315 | +5% $290 | +10% $264 |
|---|---|---|---|---|---|
| Rent | -10% $230 | -5% $272 | +0% $315 | +5% $357 | +10% $400 |
| Rate | -1.0pp $360 | -0.5pp $337 | base $315 | +0.5pp $292 | +1.0pp $268 |
UW: 25.0% down · 7.5% · 30yr · 1.5% tax · 5.0% vac · 8.0% maint · 8.0% mgmt
Financing live
Cash to close
- Down payment
- $22,250
- Closing costs
- $2,670
- Reserves months
- —
- Total cash needed
- —
Loan-product check · same deal, 3 products live
Conventional
25% down · 7.5% · 30yr
- Down + closing
- —
- Monthly P&I
- —
- Monthly cashflow
- —
- DSCR
- —
- Eligible?
- —
Personal DTI + credit; lowest rate.
DSCR
20% down · 8.5% · 30yr
- Down + closing
- —
- Monthly P&I
- —
- Monthly cashflow
- —
- DSCR
- —
- Eligible?
- —
No personal income docs; deal must DSCR.
Hard money
10% down · 12.0% · 12mo
- Down + closing
- —
- Monthly P&I
- —
- Monthly cashflow
- —
- DSCR
- —
- Eligible?
- —
Short-term bridge; refi at stabilization.
Listing history 32 events
-
2026-06-22days on market $89,000 Active 56 DOM
-
2026-06-21days on market $89,000 Active 55 DOM
-
2026-06-19days on market $89,000 Active 53 DOM
-
2026-06-18days on market $89,000 Active 52 DOM
-
2026-06-17days on market $89,000 Active 51 DOM
-
2026-06-16days on market $89,000 Active 50 DOM
-
2026-06-15days on market $89,000 Active 49 DOM
-
2026-06-14days on market $89,000 Active 47 DOM
-
2026-06-12days on market $89,000 Active 46 DOM
-
2026-06-09days on market $89,000 Active 43 DOM
-
2026-06-08days on market $89,000 Active 42 DOM
-
2026-06-07days on market $89,000 Active 41 DOM
-
2026-06-07days on market $89,000 Active 40 DOM
-
2026-06-04days on market $89,000 Active 37 DOM
-
2026-06-02days on market $89,000 Active 36 DOM
-
2026-06-01days on market $89,000 Active 35 DOM
-
2026-05-31days on market $89,000 Active 34 DOM
-
2026-05-31days on market $89,000 Active 33 DOM
-
2026-04-27$89,000 Active 135-char remark
-
2026-01-14price $80,000
-
2025-12-08price $85,000
-
2025-11-19price $98,900
-
2025-10-28$99,000 Active
-
2023-10-06soldstatus $89,000 Closed
Show marketing remark (139 chars)
Why rent when you can buy ? OWN WILL CARRY Small down cheap payment This older mobile home site on a 6970 ft^2 lot and is 1000 ft^2 home
-
2023-08-07soldstatus $86,000
-
2023-07-17status Pending
Show marketing remark (139 chars)
Why rent when you can buy ? OWN WILL CARRY Small down cheap payment This older mobile home site on a 6970 ft^2 lot and is 1000 ft^2 home
-
2023-02-02$92,500 Active
Show marketing remark (139 chars)
Why rent when you can buy ? OWN WILL CARRY Small down cheap payment This older mobile home site on a 6970 ft^2 lot and is 1000 ft^2 home
-
2020-07-21soldstatus $86,900
-
2020-07-17soldstatus $87,000
-
2020-06-27$86,900
-
2020-06-25soldstatus $30,000
-
2020-03-11$35,000
ⓘ Source: listings_history table (triggers on properties + properties_extension) + one-shot
backfill from property_details.listing_events for pre-trigger history.
Tax reassessment forecast CA · Resets to sale price
- Current annual tax
- $391 · $33/mo
- Projected year-2 tax
- $676 · $56/mo
- Expected delta
- +$285/yr (+$24/mo · 72.9%)
ⓘ Screening estimate from a state-policy table — verify with the county assessor before closing.
Climate risk First Street
- Flood 1/10 Low FEMA zone X (unshaded) · 0% chance over 30 yrs
- Wildfire 8/10 Severe
- Heat 4/10 Moderate 6 d/yr ≥95°F today · 15 d/yr by 30 yrs out
- Wind 1/10 Low
- Air quality 10/10 Extreme 34 unhealthy d/yr today · 37 by 30 yrs out
Nearby sold comps map
Loading sold comps map…
Walkable amenities ~0.75 mi
Loading nearby amenities…
Taxation est. · year 1
- Rental income
- $12,928
- − Mortgage interest
- −$4,985
- − Property taxes
- −$391
- − Insurance
- −$445
- − Repairs & maintenance
- −$1,034
- − Management
- −$1,034
- − Depreciation
- −$2,589
- Taxable income
- $2,449
- Est. tax owed @ 24.0%
- −$588
- After-tax cash flow
- $3,189/yr
For passive investors: Depreciation is non-cash, so a rental often shows a tax loss while cash-flowing — sheltering income. Rental losses are passive: they offset passive income freely, and up to $25,000/yr can offset ordinary (W-2) income if you actively participate and your MAGI is under $100k (phasing out to $0 by $150k); unused losses carry forward. On sale, claimed depreciation is recaptured at up to 25%, and gains may owe capital-gains tax (a 1031 exchange can defer both). Figures are a year-1 estimate at your 24.0% rate — not tax advice; consult a CPA.
Schools (NCES district)
- District
- Fall River Joint Unified
- NCES district ID
- 0613470
- Math proficiency
- 28% ▼ -9.00%
- Reading proficiency
- 35% ▼ -3.00%
- Median HH income
- $40,991
- Composite
- 26.57/100
- National rank
- #7186
- State rank
- #335 of 517 in CA
Livability — Johnson Park
No livability data for this city. (Only ~50 U.S. cities are tracked.)
Census & demographics
- Census place
- Johnson Park, CA
- Population (ZIP)
- 3,929
Population outlook (Shasta County) Hauer SSP2
- Today (2025)
- 179,231 people
- By 2030
- 176,953 · -1.3%
- By 2040
- 169,982 · -5.2%
- By 2050
- 162,547 · -9.3%
- By 2075
- 145,649 · -18.7%
- By 2100
- 123,025 · -31.4%
Race, ethnicity, and origin ACS 2023
- Neighborhood character
- Predominantly White (84%)
- Race & ethnicity
- White 84% Two or more races 8% Hispanic / Latino 6% Native American 3% Black 2%
- Hispanic origin (detail)
- Mexican 3% Puerto Rican 1%
- Common ancestry
- Slovak 6% Serbian 3% Russian 3%
- Foreign-born
- 2% · Canada
- Languages at home
- 98% English-only · Other Indo-European 1% Spanish 1%
Political lean MEDSL · Shasta
- 2024 margin
- Solid R (+36.5) · D 30.5% · R 67.0% · Other 2.5%
- 2008→2024 swing
- -10.7pp toward R · 2008: -25.8pp · 2024: -36.5pp
- All cycles
- 2024: R+36.5 2020: R+33.1 2016: R+37.4 2012: R+30.3 2008: R+25.8
Not yet ingested
- Civics
- —
Market trends
- HPI YoY
- ▼ -78.44%
- Current HPI
- 165.4515
- Rent YoY
- —
- Metro
- —
- State GDP YoY
- ▲ 3.21%
- F500 in state
- 116
Industry mix (Fortune 500 HQ in CA)
| Industry | F500 HQs | Revenue |
|---|---|---|
| Technology | 27 | $1,492B |
|
||
| Financial Services | 3 | $174B |
|
||
| Retail | 3 | $44B |
|
||
| Insurance | 3 | $26B |
|
||
| Media / Entertainment | 2 | $115B |
|
||
| Pharmaceuticals / Biotech | 2 | $62B |
|
||
Price history
+154.3% since first listed14 events — show timeline
- 2026-04-27 Listed $89,000 SAOR
- 2026-01-14 Price Changed $80,000 SAOR
- 2025-12-08 Price Changed $85,000 SAOR
- 2025-11-19 Price Changed $98,900 SAOR
- 2025-10-28 Listed $99,000 SAOR
- 2023-10-06 Sold (MLS) $89,000 SAOR
- 2023-08-07 Sold (Public Records) $86,000 Public Records
- 2023-07-17 Pending — SAOR
- 2023-02-02 Listed $92,500 SAOR
- 2020-07-21 Sold (MLS) $86,900 SAOR
- 2020-07-17 Sold (Public Records) $87,000 Public Records
- 2020-06-27 Listed $86,900 SAOR
- 2020-06-25 Sold (MLS) $30,000 SAOR
- 2020-03-11 Listed $35,000 SAOR
Property tax history
+19.8%/yrLatest (2025): $391 · +101.6% YoY. Source: county tax records.
Cash-flow waterfall
monthlySold comps — $/sqft
last 12 mo · ≤1 miLoading sold comps…