 🏷️ Likely Rental
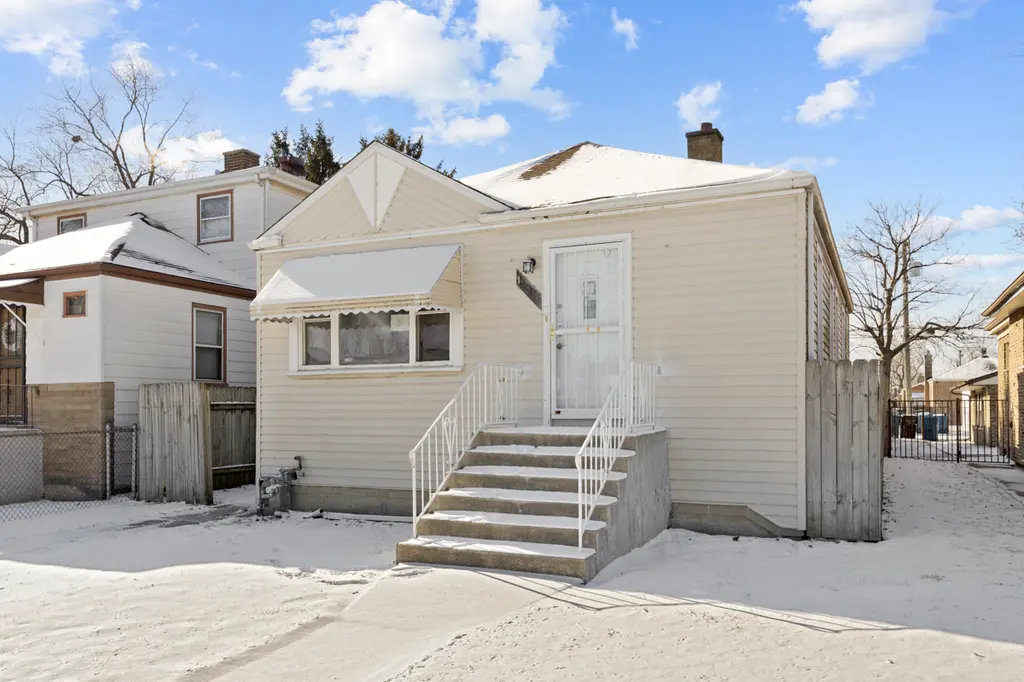
12338 S Elizabeth St · Calumet Park, IL
Flood risk 1/10 · Minimal
- FEMA flood zone
- X (unshaded)
- Chance of flooding over 30 yrs
- 0.0%
- Est. flood insurance / yr
- $473 – $860
Fire risk 1/10 · Minimal
- Est. fire insurance / yr
- $804 – $1,492
Heat risk 3/10 · Minor
- Hot days now (above 101°F)
- 7 days/yr
- Hot days in 30 yrs
- 15 days/yr
Wind risk 2/10 · Minimal
- Chance of severe wind over 30 yrs
- —
Air-quality risk 4/10 · Minor
- Unhealthy air days now
- 4 days/yr
- Unhealthy air days in 30 yrs
- 6 days/yr
Risk factors via First Street. Map © Google.
Why this score? — see what drove the C- grade
The composite is a weighted blend of 9 inputs, each scored 0–100. Each bar is that input's sub-score; the figure is the points it added to the 100-point composite (weight × sub-score).
- ARV discount +15.0/15.0
- Cash flow +14.6/30.0
- 1% rule +7.1/10.0
- Rent growth +4.5/5.0
- DSCR +4.4/10.0
- Livability +3.6/5.0
- Condition / age +2.5/5.0
- Schools +1.6/10.0
- Appreciation +0.0/10.0
$124,900
🖨 Deal sheet 📄 Offer letter ✓ Due diligence
Listing remarks MLS
Gain instant sweat equity with this charming 2-bed, 1-bath home in the heart of Calumet Park! This home offers a bright, sun-filled living room, a formal dining room, stylish galley kitchen, spacious bedrooms, a full basement, and detached garage. Prime location close to shopping, restaurants, and entertainment. Sold strictly as-is. No survey will be provided. Buyer must take subject to any municipal/code compliance requirement. *This property is not for rent. Beware of rental scams.*
Key facts
- Formal dining room
- Full basement
- Prime location
Tags
Neighborhood map
What this means for you Summary
Snapshot
- This is a 2-bed/1.5-bath single-family listed at $125k.
Deal economics
- At list price, monthly cash flow is $29 ($347/yr) — positive.
- The deal already cash-flows at list — no discount required.
- Meets the 1% rule at list price ($2k rent vs $125k).
- Recommended offer: $110k (12.0% below list) — sets the bar for market timing.
Location & tenants
- Location reads 72/100 on livability (#308 in IL) — a middle-class / working-renter tenant base. Strengths: commute A+, cost of living A+, housing A+; Watch: employment C-, schools F, crime F.
- Chsd 218 (suburban): math 14% / reading 20% proficiency, ranked #454 of 620 in IL (top 73%) — low school quality limits family demand, transient renter base, plan for 1-2y turnover.
- Market conditions: Rents rising fast (+7.8%/yr); 76 active listings in the ZIP; 15 comparable units currently listed for rent nearby; rentals leasing fast (median 3d on market — plan ~1-2 weeks tenant-placement turnaround); lower-income renter base — watch delinquency; 6,272 units permitted in Cook County in 2024 (4,658 in 5+ unit buildings).
- At $1,515/mo this rent would consume 49% of the median local household income ($37k/yr) (locally 1868% of renters already pay >50% of income on rent) — very limited rent-growth headroom before tenants either downsize or default.
Forward outlook
- Local home prices are declining (-3.0%/yr); year-one equity from $864 of loan paydown is wiped out by about $4k of value loss. Plan a longer hold.
- At projected returns (-3.0% appreciation + 7.8% rent growth), your $35k cash investment doubles in ~10 years — after that, you're playing with house money.
Negotiation context
- It's been on market 129 days — a 12% lower offer ($110k) is reasonable based on typical stale-listing flexibility.
- 2 sale attempts since 4y ago; this cycle's ask has dropped $30k (19%) from the opening price — seller is motivated, your offer sets the floor, not the list.
- Current owner paid $74k; list at $125k implies a 69% gain — meaningful room to come down on a strong offer.
Risks & watch-outs
- Watch-outs: property tax is 4.4% of price; built in 1951 — expect roof / HVAC / electrical / plumbing capex.
Questions for the listing agent
- It's been on market 129 days. Have you received any prior offers? Is the seller open to a 12% concession, seller financing, or rate buy-down credit?
- Built in 1951 — when were the roof, HVAC, electrical panel, plumbing, and water heater last replaced?
- Property tax is high relative to price — has the assessment been appealed recently, and will the sale trigger a re-assessment?
- Why hasn't it sold? Are there any deal-killer items the seller is aware of (foundation, flood, title, zoning, code violations)?
- Is there a deadline driving the sale (1031 exchange, divorce, estate, relocation)? That informs how much negotiation room exists.
- Schools are F-rated, which usually means shorter tenancies and higher turnover. Who's the typical renter profile here, and what's been the actual vacancy rate?
- Crime grade is F in this area — have there been break-ins, vandalism, or insurance claims at this property in the last 3 years? What carrier currently insures it and at what premium?
- What's the average days-on-market for RENTAL listings here right now (not sales)? A rising rental-DOM trend means longer vacancies and softer asking-rent achievability than the comps imply.
- What's the recent tenant-quality profile in this submarket — average credit score on applications, eviction rate, late-payment / NSF rate, and stable-employment percentage? A property-management company in the area should have these aggregated.
- How much new for-sale + rental construction is in the pipeline within 1–3 miles? Heavy new supply typically softens prices + rents 12–24 months out; constrained supply supports both.
Investment metrics
- 1% rule
- 1.21% ✓
- Cap rate
- 6.57%
- Cash-on-cash
- 0.99%
- DSCR
- 1.04
- GRM
- 6.9
CMA / ARV
- ARV (median comp)
- $169,375
- List price
- $124,900
- Delta
- -26.26%
- Verdict
- UNDERPRICED
- Comps
- 20 within 1.0 mi
Show comp detail 12 sales within ~0.75 mi
| Address | Dist | Beds/Ba | Sqft | Sold | Price | $/sf | Match |
|---|---|---|---|---|---|---|---|
| 12219 S Throop St | 0.18mi | 3/1.0 (+1) | 880 (-8%) | 0mo | $120,000 | $136 | 70 |
| 12356 S Carpenter St | 0.25mi | 3/1.0 (+1) | 1,008 (+5%) | 4mo | $158,894 | $158 | 70 |
| 12613 S Bishop St | 0.39mi | 2/1.0 | 876 (-9%) | 4mo | $154,500 | $176 | 62 |
| 12636 S Loomis St | 0.42mi | 3/1.0 (+1) | 900 (-6%) | 8mo | $138,500 | $154 | 56 |
| 12613 S Marshfield Ave | 0.57mi | 3/1.0 (+1) | 1,008 (+5%) | 3mo | $120,000 | $119 | 56 |
| 12334 Sangamon St | 0.38mi | 2/1.0 | 1,087 (+13%) | 4mo | $90,000 | $83 | 55 |
| 12629 S Throop St | 0.36mi | 3/1.0 (+1) | 861 (-10%) | 8mo | $169,000 | $196 | 53 |
| 12036 S Justine St | 0.55mi | 3/2.5 (+1) | 1,025 (+7%) | 2mo | $245,000 | $239 | 52 |
| 12811 S Elizabeth St | 0.57mi | 3/1.0 (+1) | 1,028 (+7%) | 3mo | $117,900 | $115 | 52 |
| 12154 S Justine St | 0.45mi | 3/1.5 (+1) | 1,092 (+14%) | 1mo | $160,053 | $147 | 50 |
| 843 W Vermont Ave | 0.73mi | 2/1.0 | 864 (-10%) | 3mo | $58,000 | $67 | 44 |
| 12820 S Sangamon St | 0.71mi | 3/1.0 (+1) | 1,077 (+12%) | 4mo | $157,500 | $146 | 36 |
Match score weights: distance 35% · size 25% · config 20% · recency 20%. Top-matched comps best support the ARV.
Projected returns pro-forma
-3.0% appreciation · 7.82% rent growth · sell at horizon
- IRR
- -7.6%
- Equity multiple
- 0.70×
- Total profit
- $-10,484
- Equity at exit
- $18,623
- IRR
- 8.5%
- Equity multiple
- 1.83×
- Total profit
- $29,026
- Equity at exit
- $10,799
Cash invested: $34,972 (down + closing). Projections, not guarantees.
Landlord ↔ Tenant lean methodology
- Overall (STATE)
- 43 Moderately Tenant-Leaning
- State Illinois
- 43 Moderately Tenant-Leaning · D+7
- County
- — inherits STATE
- City
- — inherits STATE
ZIP-level market 60827
- Home prices YoY
- -31.8%
- Rents YoY
- 7.8%
- Active inventory
- 76
- Price-to-rent
- 6.9×
Monthly cashflow live
- Estimated rent
- $1,515 high interval (Pro) →
- Mortgage (P&I)
- −$655
- Tax from tax record
- −$461 /mo · $5,531/yr
- Insurance
- −$52
- HOA
- −$0
- Vacancy / Maint / Mgmt
- −$318
- Net cashflow
- $29
Break-even live
UW: 25.0% down · 7.5% · 30yr · 1.5% tax · 5.0% vac · 8.0% maint · 8.0% mgmt
Financing live
Cash to close
- Down payment
- $31,225
- Closing costs
- $3,747
- Reserves months
- —
- Total cash needed
- —
Loan-product check · same deal, 3 products live
Conventional
25% down · 7.5% · 30yr
- Down + closing
- —
- Monthly P&I
- —
- Monthly cashflow
- —
- DSCR
- —
- Eligible?
- —
Personal DTI + credit; lowest rate.
DSCR
20% down · 8.5% · 30yr
- Down + closing
- —
- Monthly P&I
- —
- Monthly cashflow
- —
- DSCR
- —
- Eligible?
- —
No personal income docs; deal must DSCR.
Hard money
10% down · 12.0% · 12mo
- Down + closing
- —
- Monthly P&I
- —
- Monthly cashflow
- —
- DSCR
- —
- Eligible?
- —
Short-term bridge; refi at stabilization.
Rent comps 15 comps
| Address | Beds | Baths | Sqft | Rent | $/sqft | DOM | Units | Dist |
|---|---|---|---|---|---|---|---|---|
| 843 W 123rd St Unit V5 Calumet Park, IL | 2.0 | 1.0 | 900 | $1,500 | $1.67 | 12d | 1 | 0.51mi |
| 843 W 123rd St Unit T2 Calumet Park, IL | 2.0 | 1.0 | 750 | $1,400 | $1.87 | 12d | 1 | 0.51mi |
| 12358 S Lowe Ave Chicago, IL | 3.0 | 2.0 | 1050 | $2,400 | $2.29 | 24d | 1 | 0.76mi |
| 13025 S Wood St Apt 2B Blue Island, IL | 1.0 | 1.0 | 633 | $1,195 | $1.89 | 21d | 1 | 1.05mi |
| 11547 S Ashland Ave Chicago, IL | 3.0 | 1.5 | 1000 | $2,700 | $2.70 | 2d | 1 | 1.08mi |
| 13034 Honore St Unit 1 Blue Island, IL | 2.0 | 1.0 | 700 | $1,350 | $1.93 | 12d | 1 | 1.12mi |
| 13034 Honore St Unit 7 Blue Island, IL | 1.0 | 1.0 | 650 | $1,195 | $1.84 | 3d | 1 | 1.12mi |
| 13034 Honore St Unit 3 Blue Island, IL | 1.0 | 1.0 | 650 | $1,195 | $1.84 | 1d | 1 | 1.12mi |
| 2130 122nd St Blue Island, IL | 2.0 | 1.0 | 558 | $1,450 | $2.60 | 1d | 1 | 1.13mi |
| 1908 Vermont St Unit 1914-4 Blue Island, IL | 1.0 | 1.0 | 700 | $1,350 | $1.93 | 24d | 1 | 1.18mi |
| 1908 Vermont St Unit 1916-4 Blue Island, IL | 2.0 | 1.0 | 800 | $1,395 | $1.74 | 1d | 1 | 1.18mi |
| 1908 Vermont St Unit 1908-1 Blue Island, IL | 1.0 | 1.0 | 700 | $1,250 | $1.79 | 1d | 1 | 1.18mi |
| 1923 Vermont St Blue Island, IL | 2.0 | 1.0 | 1087 | $1,550 | $1.43 | 24d | 1 | 1.20mi |
| 12151 S Western Ave Unit 4 Blue Island, IL | 1.0 | 1.0 | 800 | $1,350 | $1.69 | 1d | 1 | 1.42mi |
| 12151 S Western Ave Unit 3 Blue Island, IL | 1.0 | 1.0 | 800 | $1,450 | $1.81 | 1d | 1 | 1.43mi |
Listing history 20 events
-
2026-06-18days on market $124,900 Active 129 DOM
-
2026-06-17days on market $124,900 Active 128 DOM
-
2026-06-16days on market $124,900 Active 127 DOM
-
2026-06-15days on market $124,900 Active 126 DOM
-
2026-06-13days on market $124,900 Active 124 DOM
-
2026-06-09days on market $124,900 Active 120 DOM
-
2026-06-08pricedays on market $124,900 Active 119 DOM
-
2026-06-07days on market $134,900 Active 118 DOM
-
2026-06-04days on market $134,900 Active 115 DOM
-
2026-06-03days on market $134,900 Active 114 DOM
-
2026-06-02days on market $134,900 Active 113 DOM
-
2026-06-01days on market $134,900 Active 112 DOM
-
2026-05-31days on market $134,900 Active 111 DOM
-
2026-03-30price $139,900 497-char remark
Show marketing remark (497 chars)
Gain instant sweat equity with this charming 2-bed, 1-bath home in the heart of Calumet Park! This home offers a bright, sun-filled living room, a formal dining room, stylish galley kitchen, spacious bedrooms, a full basement, and detached garage. Prime location close to shopping, restaurants, and entertainment. Sold strictly as-is. No survey will be provided. Buyer must take subject to any municipal/code compliance requirement. *This property is not for rent. Beware of rental scams.*
-
2026-02-26price $149,900 497-char remark
Show marketing remark (497 chars)
Gain instant sweat equity with this charming 2-bed, 1-bath home in the heart of Calumet Park! This home offers a bright, sun-filled living room, a formal dining room, stylish galley kitchen, spacious bedrooms, a full basement, and detached garage. Prime location close to shopping, restaurants, and entertainment. Sold strictly as-is. No survey will be provided. Buyer must take subject to any municipal/code compliance requirement. *This property is not for rent. Beware of rental scams.*
-
2026-02-09$154,900 Active 497-char remark
Show marketing remark (497 chars)
Gain instant sweat equity with this charming 2-bed, 1-bath home in the heart of Calumet Park! This home offers a bright, sun-filled living room, a formal dining room, stylish galley kitchen, spacious bedrooms, a full basement, and detached garage. Prime location close to shopping, restaurants, and entertainment. Sold strictly as-is. No survey will be provided. Buyer must take subject to any municipal/code compliance requirement. *This property is not for rent. Beware of rental scams.*
-
2022-12-28soldstatus $74,000
-
2022-10-14historical
-
2022-09-25price
-
2022-09-09Active
ⓘ Source: listings_history table (triggers on properties + properties_extension) + one-shot
backfill from property_details.listing_events for pre-trigger history.
Tax reassessment forecast IL · Partial reset (capped growth)
- Current annual tax
- $5,531 · $461/mo
- Projected year-2 tax
- $5,531 · $461/mo
- Expected delta
- $0/yr ($0/mo · 0.0%)
ⓘ Screening estimate from a state-policy table — verify with the county assessor before closing.
Climate risk First Street
- Flood 1/10 Low FEMA zone X (unshaded) · 0% chance over 30 yrs
- Wildfire 1/10 Low
- Heat 3/10 Moderate 7 d/yr ≥101°F today · 15 d/yr by 30 yrs out
- Wind 2/10 Low
- Air quality 4/10 Moderate 4 unhealthy d/yr today · 6 by 30 yrs out
Nearby sold comps map
Loading sold comps map…
Walkable amenities ~0.75 mi
Loading nearby amenities…
Taxation est. · year 1
- Rental income
- $18,179
- − Mortgage interest
- −$6,996
- − Property taxes
- −$5,531
- − Insurance
- −$624
- − Repairs & maintenance
- −$1,454
- − Management
- −$1,454
- − Depreciation
- −$3,633
- Taxable loss
- −$1,514
- Est. tax savings @ 24.0%
- +$363
- After-tax cash flow
- $710/yr
For passive investors: Depreciation is non-cash, so a rental often shows a tax loss while cash-flowing — sheltering income. Rental losses are passive: they offset passive income freely, and up to $25,000/yr can offset ordinary (W-2) income if you actively participate and your MAGI is under $100k (phasing out to $0 by $150k); unused losses carry forward. On sale, claimed depreciation is recaptured at up to 25%, and gains may owe capital-gains tax (a 1031 exchange can defer both). Figures are a year-1 estimate at your 24.0% rate — not tax advice; consult a CPA.
Schools (NCES district)
- District
- Chsd 218
- NCES district ID
- 1706540
- Math proficiency
- 14% ▼ -4.00%
- Reading proficiency
- 20% ▼ -1.00%
- Median HH income
- $57,166
- Composite
- 16.09/100
- National rank
- #9235
- State rank
- #454 of 620 in IL
Livability — Calumet Park
- Score
- 72/100
- State rank
- #308
- US rank
- #6048
Category grades
Schools grade is shown separately in the Schools card above.
Census & demographics
- Census place
- Calumet Park, IL
- County
- Cook County · 4,486,803 people
- Metro
- Chicago-Naperville-Elgin, IL-IN-WI
- Population (ZIP)
- 24,713
- Household income
- $37,217
- Rent vs Own
- Severe rent burden
- 1868.0
Population outlook (Cook County) Hauer SSP2
- Today (2025)
- 5,347,519 people
- By 2030
- 5,357,703 · +0.2%
- By 2040
- 5,324,924 · -0.4%
- By 2050
- 5,230,762 · -2.2%
- By 2075
- 4,785,735 · -10.5%
- By 2100
- 4,188,836 · -21.7%
Race, ethnicity, and origin ACS 2023
- Neighborhood character
- Predominantly Black (88%)
- Race & ethnicity
- Black 88% Two or more races 5% Hispanic / Latino 5% White 2%
- Common ancestry
- Iranian 1%
- Foreign-born
- 2% · Canada
- Languages at home
- 96% English-only · Spanish 3%
Political lean MEDSL · Cook
- 2024 margin
- Solid D (+42.0) · D 70.4% · R 28.4% · Other 1.2%
- 2008→2024 swing
- -11.4pp toward R · 2008: 53.4pp · 2024: 42.0pp
- All cycles
- 2024: D+42.0 2020: D+50.3 2016: D+53.0 2012: D+49.4 2008: D+53.4
Not yet ingested
- Civics
- —
Market trends
- HPI YoY
- ▼ -76.39%
- Current HPI
- 163.7725
- Rent YoY
- ▲ 7.82%
- Metro
- Chicago-Naperville-Elgin, IL-IN-WI
- State GDP YoY
- ▲ 1.59%
- F500 in state
- 60
Industry mix (Fortune 500 HQ in IL)
| Industry | F500 HQs | Revenue |
|---|---|---|
| Insurance | 4 | $201B |
|
||
| Consumer Goods | 4 | $87B |
|
||
| Industrial Machinery | 3 | $64B |
|
||
| Healthcare | 2 | $55B |
|
||
| Retail / Pharmacy | 1 | $148B |
|
||
| Agriculture / Food | 1 | $86B |
|
||
Price history
+89.1% since first listed7 events — show timeline
- 2026-03-30 Price Changed $139,900 MRED as Distributed by MLS Grid
- 2026-02-26 Price Changed $149,900 MRED as Distributed by MLS Grid
- 2026-02-09 Listed $154,900 MRED as Distributed by MLS Grid
- 2022-12-28 Sold (Public Records) $74,000 Public Records
- 2022-10-14 Listing Removed — MRED as Distributed by MLS Grid
- 2022-09-25 Price Changed — MRED as Distributed by MLS Grid
- 2022-09-09 Listed — MRED as Distributed by MLS Grid
Property tax history
+14.1%/yrLatest (2023): $5,531 · +104.9% YoY. Source: county tax records.
Cash-flow waterfall
monthlySold comps — $/sqft
last 12 mo · ≤1 miLoading sold comps…