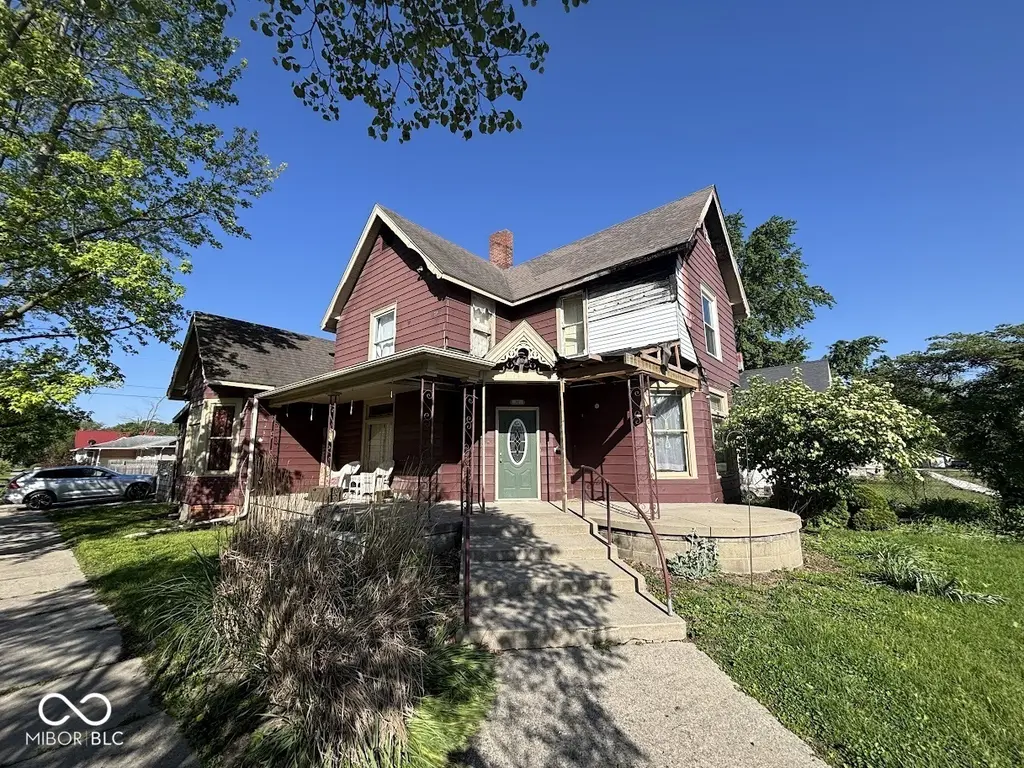
100 N College St · Colfax, IN
Flood risk 1/10 · Minimal
- FEMA flood zone
- X (unshaded)
- Chance of flooding over 30 yrs
- 0.0%
- Est. flood insurance / yr
- $473 – $860
Fire risk 1/10 · Minimal
- Est. fire insurance / yr
- $717 – $1,331
Heat risk 3/10 · Minor
- Hot days now (above 101°F)
- 7 days/yr
- Hot days in 30 yrs
- 18 days/yr
Wind risk 2/10 · Minimal
- Chance of severe wind over 30 yrs
- —
Air-quality risk 3/10 · Minor
- Unhealthy air days now
- 2 days/yr
- Unhealthy air days in 30 yrs
- 3 days/yr
Risk factors via First Street. Map © Google.
Why this score? — see what drove the B grade
The composite is a weighted blend of 9 inputs, each scored 0–100. Each bar is that input's sub-score; the figure is the points it added to the 100-point composite (weight × sub-score).
- Cash flow +27.2/30.0
- Appreciation +10.0/10.0
- DSCR +9.5/10.0
- 1% rule +7.9/10.0
- ARV discount +7.5/15.0
- Livability +3.6/5.0
- Schools +3.4/10.0
- Rent growth +2.5/5.0
- Condition / age +2.5/5.0
$112,500
🖨 Deal sheet (PDF) 📄 Offer letter ✓ Due diligence
Listing remarks MLS
PRICED TO SELL QUICKLY IN URBAN COLFAX COMMUNITY!!!...Covered wood porch, 2 car block garage and bonus room which could be 4th bedroom...Newer Propane fired furnace with CA...GREAT BUY!!!...........SPECIAL DETAILS...........
Key facts
- 7,200 sq ft lot
- 2 garage spots
- Built 1950
Property features AI
Exterior
- Parking: Detached 2-car garage (approximately 624 sq ft)
- Utilities: Public water; Municipal sewer connection; Solid waste service available
- Home design: Single-family residence; Two levels
- Construction: Wood siding; Brick/mortar foundation
- Exterior features: Property on approximately 0.17 acre
Interior
- Kitchen: Dishwasher; Electric oven
- Bedrooms: Three bedrooms on the upper level
- Bathrooms: Two full bathrooms (one on main level, one on upper level)
- Heating & cooling: Forced air heating; Central air conditioning
- Interior features: Attic access; Finished basement
- Laundry & utility: Main level laundry room
Neighborhood map
What this means for you Summary
Snapshot
- This is a 4-bed/2.0-bath single-family listed at $112k.
Deal economics
- At list price, monthly cash flow is $323 ($4k/yr) — positive.
- The deal already cash-flows at list — no discount required.
- Meets the 1% rule at list price ($1k rent vs $112k).
- Recommended offer: $109k (3.0% below list) — sets the bar for market timing.
Location & tenants
- Location reads 71/100 on livability (#128 in IN) — a middle-class / working-renter tenant base. Strengths: cost of living A+, housing A+, health & safety A+; Watch: crime C-, amenities F, commute F.
- Clinton Prairie School Corporation (rural): math 35% / reading 41% proficiency, ranked #149 of 301 in IN (top 50%) — families likely to look elsewhere, expect single-tenant / working-renter base with shorter leases.
- Zoned schools: Clinton Prairie Elementary School (math 47% / reading 39%, grade F, #417 of 994 statewide, top 43%, 663 students, 50% FRL); Clinton Prairie Jr-Sr High School (math 19% / reading 42%, grade F, #305 of 369 statewide, top 83%, 530 students, 42% FRL) — zoned schools average 46% FRL vs 31% district-wide (15 pts higher); higher-poverty schools than district average — tighter screening recommended.
- Market conditions: 7 active listings in the ZIP; 59 units permitted in Clinton County in 2024 (0 in 5+ unit buildings).
Forward outlook
- In year one you build about $12k of equity ($778 loan paydown + $11k appreciation (10.0% local appreciation)).
- Clinton County population projected at -15% by 2050 — secular population decline; favor cash flow + early exit over multi-decade hold.
- At projected returns (10.0% appreciation + 3.0% rent growth), your $32k cash investment doubles in ~2 years — after that, you're playing with house money.
- By year 3, paydown + projected appreciation supports a ~$30k cash-out refi (75% LTV) — recoverable capital for the next deal without selling this one.
Negotiation context
- It's been on market 32 days — a 3% lower offer ($109k) is reasonable based on typical stale-listing flexibility.
- 2 sale attempts since 18y ago; this cycle's ask has dropped $12k (10%) from the opening price — seller is motivated, your offer sets the floor, not the list.
- Current owner paid $26k; list at $112k implies a 337% gain — meaningful room to come down on a strong offer.
Risks & watch-outs
- Watch-outs: built in 1950 — expect roof / HVAC / electrical / plumbing capex.
Questions for the listing agent
- It's been on market 32 days. Have you received any prior offers? Is the seller open to a 3% concession, seller financing, or rate buy-down credit?
- Built in 1950 — when were the roof, HVAC, electrical panel, plumbing, and water heater last replaced?
- Is there a deadline driving the sale (1031 exchange, divorce, estate, relocation)? That informs how much negotiation room exists.
- Schools are F-rated, which usually means shorter tenancies and higher turnover. Who's the typical renter profile here, and what's been the actual vacancy rate?
- What's the average days-on-market for RENTAL listings here right now (not sales)? A rising rental-DOM trend means longer vacancies and softer asking-rent achievability than the comps imply.
- What's the recent tenant-quality profile in this submarket — average credit score on applications, eviction rate, late-payment / NSF rate, and stable-employment percentage? A property-management company in the area should have these aggregated.
- How much new for-sale + rental construction is in the pipeline within 1–3 miles? Heavy new supply typically softens prices + rents 12–24 months out; constrained supply supports both.
Investment metrics
- 1% rule
- 1.29% ✓
- Cap rate
- 9.74%
- Cash-on-cash
- 12.31%
- DSCR
- 1.55
- GRM
- 6.5
CMA / ARV
- ARV (on-the-fly)
- $310,123
- Comps found
- 2
Show comp detail 2 sales within ~0.75 mi
| Address | Dist | Beds/Ba | Sqft | Sold | Price | $/sf | Match |
|---|---|---|---|---|---|---|---|
| 604 W Franklin St | 0.15mi | 4/3.0 | 2,428 (-5%) | 9mo | $295,000 | $121 | 73 |
| 209 N Oakland St | 0.19mi | 3/1.5 (-1) | 2,778 (+8%) | 13mo | $220,000 | $79 | 60 |
Match score weights: distance 35% · size 25% · config 20% · recency 20%. Top-matched comps best support the ARV.
Projected returns pro-forma
10.0% appreciation · 3.0% rent growth · sell at horizon
- IRR
- 33.3%
- Equity multiple
- 3.60×
- Total profit
- $81,899
- Equity at exit
- $101,349
- IRR
- 28.8%
- Equity multiple
- 8.15×
- Total profit
- $225,096
- Equity at exit
- $218,563
Cash invested: $31,500 (down + closing). Projections, not guarantees.
Landlord ↔ Tenant lean methodology
- Overall (STATE)
- 90 Strongly Landlord-Friendly
- State Indiana
- 90 Strongly Landlord-Friendly · R+11
- County
- — inherits STATE
- City
- — inherits STATE
ZIP-level market 46035
- Home prices YoY
- 7.1%
- Active inventory
- 7
- Price-to-rent
- 6.5×
Monthly cashflow live
- Estimated rent
- $1,451 medium interval (Pro) →
- Mortgage (P&I)
- −$590
- Tax from tax record
- −$186 /mo · $2,237/yr
- Insurance
- −$47
- HOA
- −$0
- Vacancy / Maint / Mgmt
- −$305
- Net cashflow
- $323
Break-even live
Sensitivity live
| Price | -10% $387 | -5% $355 | +0% $323 | +5% $291 | +10% $259 |
|---|---|---|---|---|---|
| Rent | -10% $208 | -5% $266 | +0% $323 | +5% $380 | +10% $438 |
| Rate | -1.0pp $380 | -0.5pp $352 | base $323 | +0.5pp $294 | +1.0pp $264 |
UW: 25.0% down · 7.5% · 30yr · 1.5% tax · 5.0% vac · 8.0% maint · 8.0% mgmt
Financing live
Cash to close
- Down payment
- $28,125
- Closing costs
- $3,375
- Reserves months
- —
- Total cash needed
- —
Loan-product check · same deal, 3 products live
Conventional
25% down · 7.5% · 30yr
- Down + closing
- —
- Monthly P&I
- —
- Monthly cashflow
- —
- DSCR
- —
- Eligible?
- —
Personal DTI + credit; lowest rate.
DSCR
20% down · 8.5% · 30yr
- Down + closing
- —
- Monthly P&I
- —
- Monthly cashflow
- —
- DSCR
- —
- Eligible?
- —
No personal income docs; deal must DSCR.
Hard money
10% down · 12.0% · 12mo
- Down + closing
- —
- Monthly P&I
- —
- Monthly cashflow
- —
- DSCR
- —
- Eligible?
- —
Short-term bridge; refi at stabilization.
Listing history 21 events
-
2026-06-21days on market $112,500 Active 32 DOM
-
2026-06-19days on market $112,500 Active 30 DOM
-
2026-06-18price $112,500 Active 29 DOM
-
2026-06-18days on market $118,900 Active 29 DOM
-
2026-06-17days on market $118,900 Active 28 DOM
-
2026-06-16days on market $118,900 Active 27 DOM
-
2026-06-15days on market $118,900 Active 26 DOM
-
2026-06-14days on market $118,900 Active 24 DOM
-
2026-06-13days on market $118,900 Active 23 DOM
-
2026-06-10days on market $118,900 Active 21 DOM
-
2026-06-09days on market $118,900 Active 20 DOM
-
2026-06-08days on market $118,900 Active 19 DOM
-
2026-06-07pricedays on market $118,900 Active 18 DOM
-
2026-06-03days on market $124,900 Active 14 DOM
-
2026-06-02days on market $124,900 Active 13 DOM
-
2026-06-01days on market $124,900 Active 12 DOM
-
2026-05-31days on market $124,900 Active 11 DOM
-
2026-05-30days on market $124,900 Active 10 DOM
-
2026-05-20$124,900 Active
-
2008-05-16soldstatus $25,750 224-char remark
Show marketing remark (224 chars)
PRICED TO SELL QUICKLY IN URBAN COLFAX COMMUNITY!!!...Covered wood porch, 2 car block garage and bonus room which could be 4th bedroom...Newer Propane fired furnace with CA...GREAT BUY!!!...........SPECIAL DETAILS...........
-
2008-02-14$29,900 224-char remark
Show marketing remark (224 chars)
PRICED TO SELL QUICKLY IN URBAN COLFAX COMMUNITY!!!...Covered wood porch, 2 car block garage and bonus room which could be 4th bedroom...Newer Propane fired furnace with CA...GREAT BUY!!!...........SPECIAL DETAILS...........
ⓘ Source: listings_history table (triggers on properties + properties_extension) + one-shot
backfill from property_details.listing_events for pre-trigger history.
Tax reassessment forecast IN · Partial reset (capped growth)
- Current annual tax
- $2,237 · $186/mo
- Projected year-2 tax
- $2,237 · $186/mo
- Expected delta
- $0/yr ($0/mo · 0.0%)
ⓘ Screening estimate from a state-policy table — verify with the county assessor before closing.
Climate risk First Street
- Flood 1/10 Low FEMA zone X (unshaded) · 0% chance over 30 yrs
- Wildfire 1/10 Low
- Heat 3/10 Moderate 7 d/yr ≥101°F today · 18 d/yr by 30 yrs out
- Wind 2/10 Low
- Air quality 3/10 Moderate 2 unhealthy d/yr today · 3 by 30 yrs out
Nearby sold comps map
Loading sold comps map…
Walkable amenities ~0.75 mi
Loading nearby amenities…
Taxation est. · year 1
- Rental income
- $17,413
- − Mortgage interest
- −$6,302
- − Property taxes
- −$2,237
- − Insurance
- −$562
- − Repairs & maintenance
- −$1,393
- − Management
- −$1,393
- − Depreciation
- −$3,273
- Taxable income
- $2,253
- Est. tax owed @ 24.0%
- −$541
- After-tax cash flow
- $3,336/yr
For passive investors: Depreciation is non-cash, so a rental often shows a tax loss while cash-flowing — sheltering income. Rental losses are passive: they offset passive income freely, and up to $25,000/yr can offset ordinary (W-2) income if you actively participate and your MAGI is under $100k (phasing out to $0 by $150k); unused losses carry forward. On sale, claimed depreciation is recaptured at up to 25%, and gains may owe capital-gains tax (a 1031 exchange can defer both). Figures are a year-1 estimate at your 24.0% rate — not tax advice; consult a CPA.
Schools (NCES district)
- District
- Clinton Prairie School Corporation
- NCES district ID
- 1802160
- Math proficiency
- 35% ▼ -5.00%
- Reading proficiency
- 41% ▬ 0.00%
- Median HH income
- $58,334
- Composite
- 33.61/100
- National rank
- #5408
- State rank
- #149 of 301 in IN
Livability — Colfax
- Score
- 71/100
- State rank
- #128
- US rank
- #6701
Category grades
Schools grade is shown separately in the Schools card above.
Census & demographics
- Census place
- Colfax, IN
- Population (ZIP)
- 1,317
Population outlook (Clinton County) Hauer SSP2
- Today (2025)
- 31,197 people
- By 2030
- 30,257 · -3.0%
- By 2040
- 28,383 · -9.0%
- By 2050
- 26,644 · -14.6%
- By 2075
- 23,858 · -23.5%
- By 2100
- 22,236 · -28.7%
Race, ethnicity, and origin ACS 2023
- Neighborhood character
- Predominantly White (98%)
- Race & ethnicity
- White 98% Two or more races 2%
- Common ancestry
- Romanian 8% Slovak 3% Iranian 1%
Political lean MEDSL · Clinton
- 2024 margin
- Solid R (+48.0) · D 25.2% · R 73.2% · Other 1.6%
- 2008→2024 swing
- -35.0pp toward R · 2008: -13.0pp · 2024: -48.0pp
- All cycles
- 2024: R+48.0 2020: R+46.1 2016: R+48.0 2012: R+30.7 2008: R+13.0
Not yet ingested
- Civics
- —
Market trends
- HPI YoY
- ▲ 19.26%
- Current HPI
- 292.0896
- Rent YoY
- —
- Metro
- —
- State GDP YoY
- ▲ 2.90%
- F500 in state
- 18
Industry mix (Fortune 500 HQ in IN)
| Industry | F500 HQs | Revenue |
|---|---|---|
| Industrial Machinery | 2 | $37B |
|
||
| Healthcare | 1 | $177B |
|
||
| Pharmaceuticals | 1 | $45B |
|
||
| Metals / Steel | 1 | $18B |
|
||
| Agriculture | 1 | $17B |
|
||
| Packaging | 1 | $12B |
|
||
Price history
+276.3% since first listed5 events — show timeline
- 2026-06-18 Price Changed $112,500 MIBOR as Distributed by MLS Grid
- 2026-06-04 Price Changed $118,900 MIBOR as Distributed by MLS Grid
- 2026-05-20 Listed $124,900 MIBOR as Distributed by MLS Grid
- 2008-05-16 Sold (MLS) $25,750 MIBOR as Distributed by MLS Grid
- 2008-02-14 Listed $29,900 MIBOR as Distributed by MLS Grid
Property tax history
+50.8%/yrLatest (2024): $2,237 · +0.0% YoY. Source: county tax records.
Cash-flow waterfall
monthlySold comps — $/sqft
last 12 mo · ≤1 miLoading sold comps…