 🌊 Lakefront
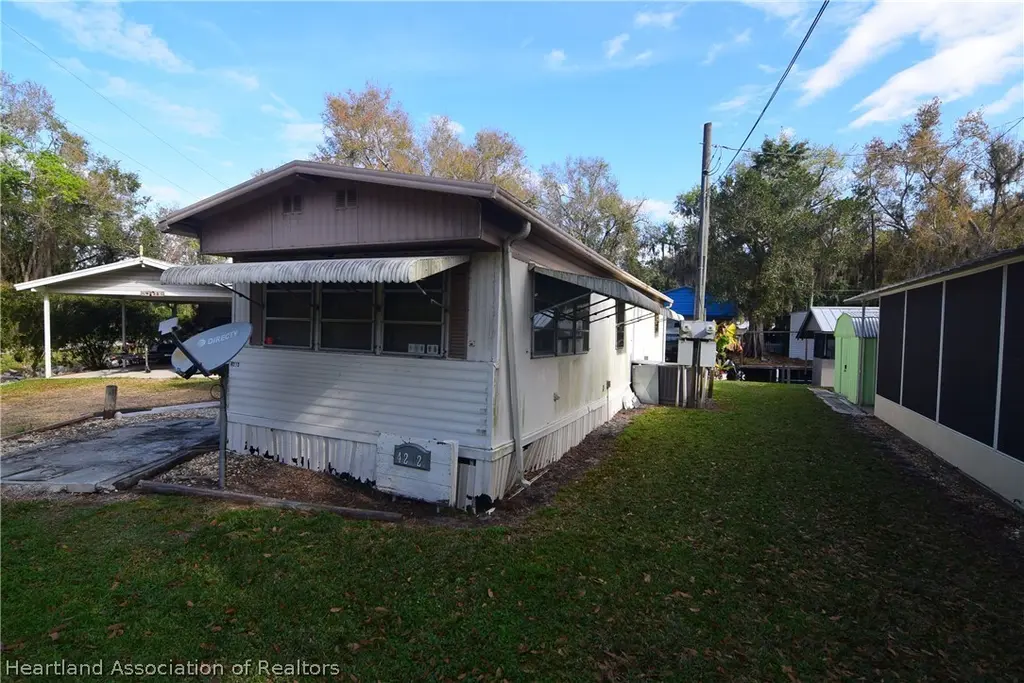
4212 Trails End Rd · Lake Placid, FL
Flood risk 4/10 · Minor
- FEMA flood zone
- AE
- Chance of flooding over 30 yrs
- 0.24%
- Est. flood insurance / yr
- $1,737 – $8,500
Fire risk 4/10 · Minor
- Est. fire insurance / yr
- $947 – $1,759
Heat risk 8/10 · Major
- Hot days now (above 108°F)
- 7 days/yr
- Hot days in 30 yrs
- 24 days/yr
Wind risk 10/10 · Severe
- Chance of severe wind over 30 yrs
- 99.0%
Air-quality risk 2/10 · Minimal
- Unhealthy air days now
- 1 days/yr
- Unhealthy air days in 30 yrs
- 1 days/yr
Risk factors via First Street. Map © Google.
Why this score? — see what drove the D+ grade
The composite is a weighted blend of 9 inputs, each scored 0–100. Each bar is that input's sub-score; the figure is the points it added to the 100-point composite (weight × sub-score).
- Cash flow +15.0/30.0
- ARV discount +7.5/15.0
- Appreciation +5.4/10.0
- 1% rule +5.0/10.0
- DSCR +5.0/10.0
- Schools +3.6/10.0
- Livability +3.4/5.0
- Rent growth +2.5/5.0
- Condition / age +2.0/5.0
$17,500
🖨 Deal sheet (PDF) 📄 Offer letter ✓ Due diligence
Listing remarks
An extremely rare opportunity to have a mobile home on a canal this is in Trails end Resort on the north shore of 29,000-acre Lake Istokpoga. The home has been vacant and needs TLC. Do not walk on the dock. outside there is a shed, fish cleaning station, deck, and carport on the left side of the home.
Key facts
- Shed
- Canal
- Carport
Tags
Property features AI
Finance
- Other: Zoning: MH1
- HOA & community: Community clubhouse; Land is leased (land lease of $500)
Exterior
- Parking: Carport (1 carport space)
- Utilities: Public water; Septic tank sewer
- Home design: Manufactured in park (mobile home); Single-wide mobile home; One level
- Construction: Frame construction with aluminum siding; Metal roof
- Exterior features: Enclosed patio/porch; Front porch; Canal-front waterfront; Gravel road access; Pets allowed; In-ground pool
Interior
- Flooring: Carpet; Linoleum
- Bathrooms: One full bathroom
- Heating & cooling: Central electric heating; Central electric cooling (central air)
- Interior features: Carpet and linoleum flooring; Four total rooms
Neighborhood map
What this means for you Summary
Snapshot
- This is a 1-bed/1.0-bath manufactured listed at $18k. Condition is rated fair.
Deal economics
- At list price, monthly cash flow is $116 ($1k/yr) — positive.
- The deal already cash-flows at list — no discount required.
- Meets the 1% rule at list price ($840 rent vs $18k).
- Recommended offer: $17k (3.0% below list) — sets the bar for market timing.
- Cap rate 43.5% vs local median 3.8% in Lake Placid — top-decile yield for the area; either an underpriced asset or a hidden risk that comps aren't pricing in. Stress-test before assuming the spread holds.
Location & tenants
- Location reads 68/100 on livability (#525 in FL) — a middle-class / working-renter tenant base. Strengths: crime A+, cost of living A+, health & safety A+; Watch: amenities F, commute F, employment F.
- Highlands (other): math 45% / reading 43% proficiency, ranked #54 of 73 in FL (top 74%) — families likely to look elsewhere, expect single-tenant / working-renter base with shorter leases; 68% free/reduced lunch — lower-income household profile, screen leases tightly.
- Zoned schools: Fred Wild Elementary School (math 49% / reading 41%, grade D-, #1,271 of 2,144 statewide, top 60%, 563 students, 87% FRL); Sebring Middle School (math 52% / reading 40%, grade D+, #300 of 571 statewide, top 53%, 815 students, 64% FRL); Sebring High School (math 32% / reading 48%, grade F, #296 of 667 statewide, top 45%, 1,809 students, 56% FRL) — zoned schools at 69% FRL track the district average.
- Market conditions: 58 active listings in the ZIP; 980 units permitted in Highlands County in 2024 (80 in 5+ unit buildings).
Forward outlook
- In year one you build about $265 of equity ($121 loan paydown + $144 appreciation (0.8% local appreciation)).
- At projected returns (0.8% appreciation + 3.0% rent growth), your $5k cash investment doubles in ~3 years — after that, you're playing with house money.
Negotiation context
- It's been on market 52 days — a 3% lower offer ($17k) is reasonable based on typical stale-listing flexibility.
Risks & watch-outs
- Watch-outs: flood insurance adds $427/mo.
- Climate carrying-cost: in FEMA flood zone AE (mandatory federal flood insurance); severe wind risk, 99% chance of damaging wind over 30y; extreme-heat days projected 7→24/yr by 2055 (HVAC capex compounding) — expect insurance premiums to compound above CPI over the hold.
Questions for the listing agent
- It's been on market 52 days. Have you received any prior offers? Is the seller open to a 3% concession, seller financing, or rate buy-down credit?
- Have any recent inspections been done? Can we get a copy of the seller's disclosures and any deferred-maintenance estimates?
- Built in 1971 — when were the roof, HVAC, electrical panel, plumbing, and water heater last replaced?
- What's the actual annual flood-insurance premium (NFIP or private), and is the property in a SFHA with mandatory coverage?
- Is there a deadline driving the sale (1031 exchange, divorce, estate, relocation)? That informs how much negotiation room exists.
- Schools are D-rated, which usually means shorter tenancies and higher turnover. Who's the typical renter profile here, and what's been the actual vacancy rate?
- The area grade is low — what's the realistic commute time and amenity access for the typical tenant pool here? Any planned neighborhood developments (good or bad) we should know about?
- This sits on a lake — are riparian / water-frontage rights deeded with the parcel? Any dock permits, shoreline easements, or HOA water-use restrictions?
- What's the documented flood / surge / shoreline-erosion history here (FEMA AND non-FEMA — e.g., storm surge, creek backup, septic-field saturation)?
- Any water-quality or seasonal algae-bloom issues that affect tenant satisfaction or short-term-rental demand?
- What's the average days-on-market for RENTAL listings here right now (not sales)? A rising rental-DOM trend means longer vacancies and softer asking-rent achievability than the comps imply.
- What's the recent tenant-quality profile in this submarket — average credit score on applications, eviction rate, late-payment / NSF rate, and stable-employment percentage? A property-management company in the area should have these aggregated.
- How much new for-sale + rental construction is in the pipeline within 1–3 miles? Heavy new supply typically softens prices + rents 12–24 months out; constrained supply supports both.
Investment metrics
- 1% rule
- 4.80% ✓
- Cap rate
- 43.48%
- Cash-on-cash
- 132.82%
- DSCR
- 6.91
- GRM
- 1.7
CMA / ARV
No comps found within radius.
Projected returns pro-forma
0.82% appreciation · 3.0% rent growth · sell at horizon
- IRR
- 31.1%
- Equity multiple
- 2.60×
- Total profit
- $7,827
- Equity at exit
- $5,813
- IRR
- 34.2%
- Equity multiple
- 5.19×
- Total profit
- $20,532
- Equity at exit
- $7,603
Cash invested: $4,900 (down + closing). Projections, not guarantees.
Landlord ↔ Tenant lean methodology
- Overall (STATE)
- 87 Strongly Landlord-Friendly
- State Florida
- 87 Strongly Landlord-Friendly · R+3
- County
- — inherits STATE
- City
- — inherits STATE
ZIP-level market 33857
- Home prices YoY
- 0.3%
- Active inventory
- 58
- Price-to-rent
- 1.7×
Monthly cashflow live
- Estimated rent
- $840 medium interval (Pro) →
- Mortgage (P&I)
- −$92
- Tax est. 1.5%
- −$22 /mo · $262/yr
- Insurance
- −$7
- Flood insurance flood zone
- −$427 /mo · $5,118/yr
- HOA
- −$0
- Vacancy / Maint / Mgmt
- −$176
- Net cashflow
- $116
Break-even live
Sensitivity live
| Price | -10% $128 | -5% $122 | +0% $116 | +5% $110 | +10% $104 |
|---|---|---|---|---|---|
| Rent | -10% $49 | -5% $83 | +0% $116 | +5% $149 | +10% $182 |
| Rate | -1.0pp $125 | -0.5pp $120 | base $116 | +0.5pp $111 | +1.0pp $107 |
UW: 25.0% down · 7.5% · 30yr · 1.5% tax · 5.0% vac · 8.0% maint · 8.0% mgmt
Financing live
Cash to close
- Down payment
- $4,375
- Closing costs
- $525
- Reserves months
- —
- Total cash needed
- —
Loan-product check · same deal, 3 products live
Conventional
25% down · 7.5% · 30yr
- Down + closing
- —
- Monthly P&I
- —
- Monthly cashflow
- —
- DSCR
- —
- Eligible?
- —
Personal DTI + credit; lowest rate.
DSCR
20% down · 8.5% · 30yr
- Down + closing
- —
- Monthly P&I
- —
- Monthly cashflow
- —
- DSCR
- —
- Eligible?
- —
No personal income docs; deal must DSCR.
Hard money
10% down · 12.0% · 12mo
- Down + closing
- —
- Monthly P&I
- —
- Monthly cashflow
- —
- DSCR
- —
- Eligible?
- —
Short-term bridge; refi at stabilization.
Listing history 16 events
-
2026-06-21days on market $17,500 Active 52 DOM
-
2026-06-19days on market $17,500 Active 50 DOM
-
2026-06-18days on market $17,500 Active 49 DOM
-
2026-06-17days on market $17,500 Active 48 DOM
-
2026-06-16days on market $17,500 Active 47 DOM
-
2026-06-15days on market $17,500 Active 46 DOM
-
2026-06-14days on market $17,500 Active 44 DOM
-
2026-06-10days on market $17,500 Active 41 DOM
-
2026-06-09days on market $17,500 Active 40 DOM
-
2026-06-08days on market $17,500 Active 39 DOM
-
2026-06-07days on market $17,500 Active 38 DOM
-
2026-06-02days on market $17,500 Active 33 DOM
-
2026-06-01days on market $17,500 Active 32 DOM
-
2026-05-31days on market $17,500 Active 31 DOM
-
2026-05-30days on market $17,500 Active 30 DOM
-
2026-02-02$17,500 Active
ⓘ Source: listings_history table (triggers on properties + properties_extension) + one-shot
backfill from property_details.listing_events for pre-trigger history.
Climate risk First Street
- Flood 4/10 Moderate FEMA zone AE · 24% chance over 30 yrs
- Wildfire 4/10 Moderate
- Heat 8/10 Severe 7 d/yr ≥108°F today · 24 d/yr by 30 yrs out
- Wind 10/10 Extreme 99% chance of damaging wind over 30 yrs
- Air quality 2/10 Low 1 unhealthy d/yr today · 1 by 30 yrs out
Nearby sold comps map
Loading sold comps map…
Walkable amenities ~0.75 mi
Loading nearby amenities…
Taxation est. · year 1
- Rental income
- $10,075
- − Mortgage interest
- −$980
- − Property taxes
- −$262
- − Insurance
- −$5,206
- − Repairs & maintenance
- −$806
- − Management
- −$806
- − Depreciation
- −$509
- Taxable income
- $1,505
- Est. tax owed @ 24.0%
- −$361
- After-tax cash flow
- $1,028/yr
For passive investors: Depreciation is non-cash, so a rental often shows a tax loss while cash-flowing — sheltering income. Rental losses are passive: they offset passive income freely, and up to $25,000/yr can offset ordinary (W-2) income if you actively participate and your MAGI is under $100k (phasing out to $0 by $150k); unused losses carry forward. On sale, claimed depreciation is recaptured at up to 25%, and gains may owe capital-gains tax (a 1031 exchange can defer both). Figures are a year-1 estimate at your 24.0% rate — not tax advice; consult a CPA.
Condition & rehab AI · 13 photos
This mobile home requires extensive repairs and updates to its roof, exterior, flooring, and interior systems. Significant improvements in these areas will greatly enhance its value and marketability.
Repairs flagged
- Major roof — The rusted metal roof is in poor condition and needs replacement.
- Major exterior siding — The siding is peeling and in poor condition, indicating structural issues.
- Major flooring — The concrete driveway is cracked and worn, requiring repair or replacement.
- Major interior walls — The peeling paint and dated aesthetic indicate a need for a fresh coat of paint and possibly new finishes.
- Major HVAC — The mobile home likely requires updates to its HVAC system for energy efficiency and comfort.
- Major electrical — The electrical system may need updates for safety and energy efficiency.
Value-add opportunities
- Resale New roof — A new roof will significantly improve the home's curb appeal and marketability.
- Resale Exterior siding repair/replacement — Repairing or replacing the siding will improve the home's appearance and increase its value.
- Resale Flooring replacement — Replacing the worn concrete driveway will improve the home's curb appeal and increase its marketability.
- Resale Paint and interior updates — Updating the interior walls and adding new finishes will improve the home's aesthetic and increase its value.
- Both HVAC and electrical updates — Updating the HVAC and electrical systems will improve the home's comfort and energy efficiency, benefiting both resale and rental value.
Renovation cost estimate screening
| Repair item | Severity | Est. cost |
|---|---|---|
| roof · The rusted metal roof is in poor condition and needs replacement. | Major | $15,000–50,000 |
| exterior siding · The siding is peeling and in poor condition, indicating structural issues. | Major | $15,000–50,000 |
| flooring · The concrete driveway is cracked and worn, requiring repair or replacement. | Major | $15,000–50,000 |
| interior walls · The peeling paint and dated aesthetic indicate a need for a fresh coat of paint and possibly new finishes. | Major | $15,000–50,000 |
| HVAC · The mobile home likely requires updates to its HVAC system for energy efficiency and comfort. | Major | $15,000–50,000 |
| electrical · The electrical system may need updates for safety and energy efficiency. | Major | $15,000–50,000 |
| Total estimated repair cost · 6 items | $90,000–300,000 |
Value-add ROI direction
- Resale New roof — A new roof will significantly improve the home's curb appeal and marketability. ↑
- Resale Exterior siding repair/replacement — Repairing or replacing the siding will improve the home's appearance and increase its value. ↑
- Resale Flooring replacement — Replacing the worn concrete driveway will improve the home's curb appeal and increase its marketability. ↑
- Resale Paint and interior updates — Updating the interior walls and adding new finishes will improve the home's aesthetic and increase its value. ↑
- Both HVAC and electrical updates — Updating the HVAC and electrical systems will improve the home's comfort and energy efficiency, benefiting both resale and rental value. ↑
ⓘ Cost ranges are severity-bucket heuristics (US national rule-of-thumb). Get contractor quotes + a written scope before underwriting a rehab budget.
Schools (NCES district)
- District
- Highlands
- NCES district ID
- 1200840
- Math proficiency
- 45% ▼ -7.00%
- Reading proficiency
- 43% ▼ -3.00%
- Median HH income
- $35,276
- Composite
- 36.42/100
- National rank
- #4672
- State rank
- #54 of 73 in FL
Livability — Lake Placid
- Score
- 68/100
- State rank
- #525
- US rank
- #9813
Category grades
Schools grade is shown separately in the Schools card above.
Census & demographics
- City population
- 22,600
- Population (ZIP)
- 935
Population outlook (Highlands County) Hauer SSP2
- Today (2025)
- 99,674 people
- By 2030
- 99,615 · -0.1%
- By 2040
- 99,342 · -0.3%
- By 2050
- 98,242 · -1.4%
- By 2075
- 93,291 · -6.4%
- By 2100
- 79,894 · -19.8%
Race, ethnicity, and origin ACS 2023
- Neighborhood character
- Predominantly White (97%)
- Race & ethnicity
- White 97% Two or more races 3% Hispanic / Latino 1%
- Common ancestry
- Lithuanian 6% Slovak 5% Iranian 2%
- Foreign-born
- 8% · Canada
- Languages at home
- 99% English-only · Spanish 1%
Political lean MEDSL · Highlands
- 2024 margin
- Solid R (+40.8) · D 29.3% · R 70.1%
- 2008→2024 swing
- -22.7pp toward R · 2008: -18.1pp · 2024: -40.8pp
- All cycles
- 2024: R+40.8 2020: R+34.4 2016: R+32.0 2012: R+23.0 2008: R+18.1
Not yet ingested
- Civics
- —
Market trends
- HPI YoY
- ▲ 0.82%
- Current HPI
- 274.7204
- Rent YoY
- —
- Metro
- —
- State GDP YoY
- ▲ 3.28%
- F500 in state
- 36
Industry mix (Fortune 500 HQ in FL)
| Industry | F500 HQs | Revenue |
|---|---|---|
| Industrial Technology | 2 | $29B |
|
||
| Insurance | 2 | $17B |
|
||
| Retail | 1 | $60B |
|
||
| Technology Distribution | 1 | $58B |
|
||
| Homebuilding | 1 | $35B |
|
||
| Technology Manufacturing | 1 | $35B |
|
||
Price history
1 event — show timeline
- 2026-02-02 Listed $17,500 HAOR as distributed by MLS GRID
Cash-flow waterfall
monthlySold comps — $/sqft
last 12 mo · ≤1 miLoading sold comps…