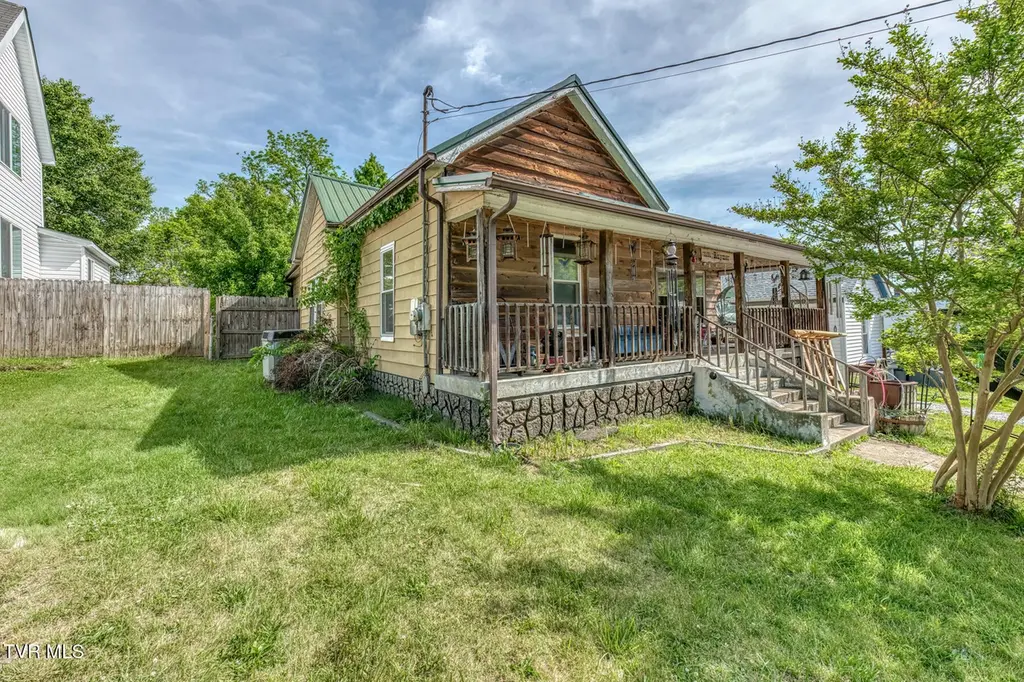
1131 Hill St · Bristol, TN
Flood risk 1/10 · Minimal
- FEMA flood zone
- X (unshaded)
- Chance of flooding over 30 yrs
- 0.0%
- Est. flood insurance / yr
- $507 – $1,088
Fire risk 4/10 · Minor
- Est. fire insurance / yr
- $949 – $1,763
Heat risk 4/10 · Minor
- Hot days now (above 98°F)
- 7 days/yr
- Hot days in 30 yrs
- 22 days/yr
Wind risk 2/10 · Minimal
- Chance of severe wind over 30 yrs
- —
Air-quality risk 2/10 · Minimal
- Unhealthy air days now
- 1 days/yr
- Unhealthy air days in 30 yrs
- 2 days/yr
Risk factors via First Street. Map © Google.
Why this score? — see what drove the B+ grade
The composite is a weighted blend of 9 inputs, each scored 0–100. Each bar is that input's sub-score; the figure is the points it added to the 100-point composite (weight × sub-score).
- Cash flow +30.0/30.0
- ARV discount +15.0/15.0
- 1% rule +10.0/10.0
- DSCR +10.0/10.0
- Livability +3.7/5.0
- Schools +3.0/10.0
- Rent growth +2.5/5.0
- Condition / age +2.5/5.0
- Appreciation +0.0/10.0
$115,000
🖨 Deal sheet (PDF) 📄 Offer letter ✓ Due diligence
Listing remarks MLS
In MLS for Comp Purposes
Key facts
- Solid bones
- Great roof
- Walking distance
Tags
Property features AI
Exterior
- Parking: Shared driveway
- Utilities: Public water; Public sewer; Electricity connected; Water connected
- Home design: Single-family house; One story; Residential property in fixer condition
- Construction: Wood siding; Metal roof
- Exterior features: Front porch; Level topography
Interior
- Kitchen: Refrigerator
- Flooring: Hardwood floors
- Bathrooms: 1 full bathroom
- Heating & cooling: Heat pump for heating and cooling
- Interior features: Fireplace (1); Basement with dirt floor and sump pump; 7 total rooms
Neighborhood map
What this means for you Summary
Snapshot
- This is a 3-bed/1.0-bath single-family listed at $115k.
Deal economics
- At list price, monthly cash flow is $655 ($8k/yr) — positive.
- The deal already cash-flows at list — no discount required.
- Meets the 1% rule at list price ($2k rent vs $115k).
- Recommended offer: $112k (3.0% below list) — sets the bar for market timing.
- Cap rate 13.1% vs local median 3.8% in Bristol — top-decile yield for the area; either an underpriced asset or a hidden risk that comps aren't pricing in. Stress-test before assuming the spread holds.
Location & tenants
- Location reads 73/100 on livability (#24 in TN) — a middle-class / working-renter tenant base. Strengths: cost of living A+, housing A+, health & safety A+; Watch: crime D+, commute F, employment F.
- Bristol (urban): math 37% / reading 35% proficiency, ranked #29 of 139 in TN (top 21%) — families likely to look elsewhere, expect single-tenant / working-renter base with shorter leases.
- Zoned schools: Anderson Elementary (math 22% / reading 27%, grade F, #546 of 952 statewide, top 61%, 308 students, 0% FRL); Bristol Tennessee Middle School (math 37% / reading 29%, grade F, #77 of 333 statewide, top 24%, 883 students, 0% FRL); Tennessee High School (math 20% / reading 41%, grade F, #75 of 332 statewide, top 24%, 1,154 students, 0% FRL) — zoned schools average 0% FRL vs 46% district-wide (46 pts lower); this property's tenant base skews higher-income than the district average.
- Market conditions: 259 active listings in the ZIP; 13 comparable units currently listed for rent nearby; rentals at typical pace (median 24d on market — plan ~3-4 weeks tenant-placement turnaround); 453 units permitted in Sullivan County in 2024 (6 in 5+ unit buildings).
- This rent runs 37% of the median local income ($56k/yr) — at the standard rent-burdened threshold; future hikes will face affordability resistance.
Forward outlook
- Local home prices are declining (-3.0%/yr); year-one equity from $795 of loan paydown is wiped out by about $3k of value loss. Plan a longer hold.
- Sullivan County population projected to shrink 5% by 2050 — rents likely to lag national; underwrite the cash flow, not the appreciation.
- At projected returns (-3.0% appreciation + 3.0% rent growth), your $32k cash investment doubles in ~5 years — after that, you're playing with house money.
Negotiation context
- It's been on market 32 days — a 3% lower offer ($112k) is reasonable based on typical stale-listing flexibility.
- 2 sale attempts since 4y ago; this cycle's ask has dropped $10k (8%) from the opening price — seller is motivated, your offer sets the floor, not the list.
- Current owner paid $67k; list at $115k implies a 72% gain — meaningful room to come down on a strong offer.
Risks & watch-outs
- Watch-outs: built in 1918 — expect roof / HVAC / electrical / plumbing capex.
Questions for the listing agent
- It's been on market 32 days. Have you received any prior offers? Is the seller open to a 3% concession, seller financing, or rate buy-down credit?
- Built in 1918 — when were the roof, HVAC, electrical panel, plumbing, and water heater last replaced?
- Is there a deadline driving the sale (1031 exchange, divorce, estate, relocation)? That informs how much negotiation room exists.
- Schools are D-rated, which usually means shorter tenancies and higher turnover. Who's the typical renter profile here, and what's been the actual vacancy rate?
- Crime grade is D in this area — have there been break-ins, vandalism, or insurance claims at this property in the last 3 years? What carrier currently insures it and at what premium?
- What's the average days-on-market for RENTAL listings here right now (not sales)? A rising rental-DOM trend means longer vacancies and softer asking-rent achievability than the comps imply.
- What's the recent tenant-quality profile in this submarket — average credit score on applications, eviction rate, late-payment / NSF rate, and stable-employment percentage? A property-management company in the area should have these aggregated.
- How much new for-sale + rental construction is in the pipeline within 1–3 miles? Heavy new supply typically softens prices + rents 12–24 months out; constrained supply supports both.
Investment metrics
- 1% rule
- 1.52% ✓
- Cap rate
- 13.13%
- Cash-on-cash
- 24.40%
- DSCR
- 2.09
- GRM
- 5.5
CMA / ARV
- ARV (on-the-fly)
- $179,792
- Comps found
- 12
Show comp detail 12 sales within ~0.75 mi
| Address | Dist | Beds/Ba | Sqft | Sold | Price | $/sf | Match |
|---|---|---|---|---|---|---|---|
| 909 Wilson Ave | 0.29mi | 2/1.0 (-1) | 1,328 (+0%) | 7mo | $90,000 | $68 | 75 |
| 1412 Anderson St | 0.29mi | 2/2.0 (-1) | 1,382 (+4%) | 2mo | $235,000 | $170 | 68 |
| 943 Shelby St | 0.33mi | 3/1.0 | 1,201 (-9%) | 5mo | $115,000 | $96 | 66 |
| 813 Haynes St | 0.42mi | 3/1.0 | 1,215 (-8%) | 4mo | $151,500 | $125 | 63 |
| 1405 Newton St | 0.47mi | 3/1.0 | 1,200 (-9%) | 4mo | $160,000 | $133 | 59 |
| 1836 Anderson St | 0.49mi | 3/2.0 | 1,425 (+8%) | 4mo | $235,000 | $165 | 56 |
| 1728 Windsor Ave | 0.44mi | 3/1.0 | 1,132 (-14%) | 3mo | $205,000 | $181 | 53 |
| 1106 Cedar St | 0.67mi | 3/1.0 | 1,224 (-7%) | 7mo | $199,900 | $163 | 51 |
| 1443 Windsor Ave | 0.34mi | 2/1.5 (-1) | 1,144 (-14%) | 8mo | $142,800 | $125 | 48 |
| 1112 Cedar St | 0.66mi | 3/1.0 | 1,440 (+9%) | 9mo | $140,000 | $97 | 47 |
| 461 Douglas St | 0.64mi | 4/2.0 (+1) | 1,418 (+7%) | 5mo | $193,500 | $136 | 45 |
| 1914 Windsor Ave | 0.52mi | 2/1.0 (-1) | 1,128 (-15%) | 2mo | $198,000 | $176 | 44 |
Match score weights: distance 35% · size 25% · config 20% · recency 20%. Top-matched comps best support the ARV.
Projected returns pro-forma
-3.0% appreciation · 3.0% rent growth · sell at horizon
- IRR
- 17.7%
- Equity multiple
- 1.72×
- Total profit
- $23,058
- Equity at exit
- $17,147
- IRR
- 26.2%
- Equity multiple
- 3.29×
- Total profit
- $73,726
- Equity at exit
- $9,943
Cash invested: $32,200 (down + closing). Projections, not guarantees.
Landlord ↔ Tenant lean methodology
- Overall (STATE)
- 87 Strongly Landlord-Friendly
- State Tennessee
- 87 Strongly Landlord-Friendly · R+13
- County
- — inherits STATE
- City
- — inherits STATE
ZIP-level market 37620
- Active inventory
- 259
- Price-to-rent
- 5.5×
Monthly cashflow live
- Estimated rent
- $1,751 high interval (Pro) →
- Mortgage (P&I)
- −$603
- Tax from tax record
- −$77 /mo · $928/yr
- Insurance
- −$48
- HOA
- −$0
- Lot rent
- −$0
- Vacancy / Maint / Mgmt
- −$368
- Net cashflow
- $655
Break-even live
Sensitivity live
| Price | -10% $720 | -5% $687 | +0% $655 | +5% $622 | +10% $590 |
|---|---|---|---|---|---|
| Rent | -10% $517 | -5% $586 | +0% $655 | +5% $724 | +10% $793 |
| Rate | -1.0pp $713 | -0.5pp $684 | base $655 | +0.5pp $625 | +1.0pp $595 |
UW: 25.0% down · 7.5% · 30yr · 1.5% tax · 5.0% vac · 8.0% maint · 8.0% mgmt
Financing live
Cash to close
- Down payment
- $28,750
- Closing costs
- $3,450
- Reserves months
- —
- Total cash needed
- —
Loan-product check · same deal, 3 products live
Conventional
25% down · 7.5% · 30yr
- Down + closing
- —
- Monthly P&I
- —
- Monthly cashflow
- —
- DSCR
- —
- Eligible?
- —
Personal DTI + credit; lowest rate.
DSCR
20% down · 8.5% · 30yr
- Down + closing
- —
- Monthly P&I
- —
- Monthly cashflow
- —
- DSCR
- —
- Eligible?
- —
No personal income docs; deal must DSCR.
Hard money
10% down · 12.0% · 12mo
- Down + closing
- —
- Monthly P&I
- —
- Monthly cashflow
- —
- DSCR
- —
- Eligible?
- —
Short-term bridge; refi at stabilization.
Rent comps 13 comps
| Address | Beds | Baths | Sqft | Rent | $/sqft | DOM | Units | Dist |
|---|---|---|---|---|---|---|---|---|
| 1718 Clifton Rd Bristol, TN | 3.0 | 1.5 | 1672 | $1,900 | $1.14 | 46d | 1 | 0.36mi |
| 1216 Norway St Unit 102 Bristol, VA | 2.0 | 1.0 | 1215 | $1,600 | $1.32 | 15d | 1 | 0.42mi |
| 1216 Norway St Unit 101 Bristol, VA | 4.0 | 2.0 | 1615 | $2,100 | $1.30 | 15d | 1 | 0.42mi |
| 1405 Newton St Bristol, VA | 3.0 | 1.0 | 1200 | $1,600 | $1.33 | 15d | 1 | 0.43mi |
| 2114 Broad St Bristol, TN | 2.0 | 1.0 | 1000 | $1,600 | $1.60 | 15d | 1 | 0.64mi |
| 1136 Moorland Ave Bristol, VA | 2.0 | 1.0 | 936 | $1,250 | $1.34 | 46d | 1 | 0.78mi |
| 700 W Cedar St Bristol, TN | 2.0 | 1.0 | 921 | $1,600 | $1.74 | 23d | 1 | 0.86mi |
| 145 Midway St Unit 1397968P Bristol, VA | 3.0 | 2.0 | 1388 | $5,335 | $3.84 | 23d | 1 | 1.09mi |
| 2510 Catherine St Bristol, VA | 3.0 | 2.0 | 1418 | $2,500 | $1.76 | 15d | 1 | 1.20mi |
| 308 Emerald Dr Unit 308 Bristol, VA | 2.0 | 1.5 | 970 | $1,200 | $1.24 | 46d | 1 | 1.28mi |
| 203 Opal Ln Unit 4 Bristol, VA | 2.0 | 1.5 | 1200 | $1,500 | $1.25 | 23d | 1 | 1.28mi |
| 1156 Bristol View Dr Bristol, VA | 2.0 | 2.5 | 1152 | $1,650 | $1.43 | 15d | 2 | 1.37mi |
| 60 Maple Tree Dr Bristol, TN | 2.0 | 1.0 | 944 | $1,350 | $1.43 | 23d | 1 | 1.38mi |
Listing history 18 events
-
2026-06-22days on market $115,000 Active 32 DOM
-
2026-06-19days on market $115,000 Active 30 DOM
-
2026-06-18days on market $115,000 Active 29 DOM
-
2026-06-17days on market $115,000 Active 28 DOM
-
2026-06-16days on market $115,000 Active 27 DOM
-
2026-06-15days on market $115,000 Active 26 DOM
-
2026-06-14days on market $115,000 Active 24 DOM
-
2026-06-13days on market $115,000 Active 23 DOM
-
2026-06-10days on market $115,000 Active 21 DOM
-
2026-06-09days on market $115,000 Active 20 DOM
-
2026-06-09status $115,000 Active 19 DOM
-
2026-05-21status Pending
-
2026-05-12price $115,000
-
2026-05-01$125,000 Active
-
2022-07-08soldstatus $67,000 24-char remark
Show marketing remark (24 chars)
In MLS for Comp Purposes
-
2022-07-08$69,100 24-char remark
Show marketing remark (24 chars)
In MLS for Comp Purposes
-
2022-07-08soldstatus $67,000
Show marketing remark (24 chars)
In MLS for Comp Purposes
-
1981-02-02soldstatus $32,500
ⓘ Source: listings_history table (triggers on properties + properties_extension) + one-shot
backfill from property_details.listing_events for pre-trigger history.
Tax reassessment forecast TN · Resets to sale price
- Current annual tax
- $928 · $77/mo
- Projected year-2 tax
- $928 · $77/mo
- Expected delta
- $0/yr ($0/mo · -0.0%)
ⓘ Screening estimate from a state-policy table — verify with the county assessor before closing.
Climate risk First Street
- Flood 1/10 Low FEMA zone X (unshaded) · 0% chance over 30 yrs
- Wildfire 4/10 Moderate
- Heat 4/10 Moderate 7 d/yr ≥98°F today · 22 d/yr by 30 yrs out
- Wind 2/10 Low
- Air quality 2/10 Low 1 unhealthy d/yr today · 2 by 30 yrs out
Nearby sold comps map
Loading sold comps map…
Walkable amenities ~0.75 mi
Loading nearby amenities…
Taxation est. · year 1
- Rental income
- $21,010
- − Mortgage interest
- −$6,442
- − Property taxes
- −$928
- − Insurance
- −$575
- − Repairs & maintenance
- −$1,681
- − Management
- −$1,681
- − Depreciation
- −$3,345
- Taxable income
- $6,358
- Est. tax owed @ 24.0%
- −$1,526
- After-tax cash flow
- $6,332/yr
For passive investors: Depreciation is non-cash, so a rental often shows a tax loss while cash-flowing — sheltering income. Rental losses are passive: they offset passive income freely, and up to $25,000/yr can offset ordinary (W-2) income if you actively participate and your MAGI is under $100k (phasing out to $0 by $150k); unused losses carry forward. On sale, claimed depreciation is recaptured at up to 25%, and gains may owe capital-gains tax (a 1031 exchange can defer both). Figures are a year-1 estimate at your 24.0% rate — not tax advice; consult a CPA.
Schools (NCES district)
- District
- Bristol
- NCES district ID
- 4700360
- Math proficiency
- 37% ▼ -7.00%
- Reading proficiency
- 35% ▼ -8.00%
- Median HH income
- $37,018
- Composite
- 29.95/100
- National rank
- #6376
- State rank
- #29 of 139 in TN
Livability — Bristol
- Score
- 73/100
- State rank
- #24
- US rank
- #5413
Category grades
Schools grade is shown separately in the Schools card above.
Census & demographics
- Census place
- Bristol, TN
- County
- Sullivan County · 121,987 people
- City population
- 38,494
- Metro
- Kingsport-Bristol, TN-VA
- Population (ZIP)
- 38,494
- Household income
- $56,128
- Rent vs Own
- Severe rent burden
- 724.0
Population outlook (Sullivan County) Hauer SSP2
- Today (2025)
- 157,030 people
- By 2030
- 156,415 · -0.4%
- By 2040
- 153,778 · -2.1%
- By 2050
- 149,018 · -5.1%
- By 2075
- 138,068 · -12.1%
- By 2100
- 119,927 · -23.6%
Race, ethnicity, and origin ACS 2023
- Neighborhood character
- Predominantly White (91%)
- Race & ethnicity
- White 91% Two or more races 5% Hispanic / Latino 3% Black 2%
- Common ancestry
- Serbian 3% Slovak 3% Italian 1%
- Foreign-born
- 2% · Canada
- Languages at home
- 97% English-only · Spanish 2%
Political lean MEDSL · Sullivan
- 2024 margin
- Solid R (+55.0) · D 22.0% · R 77.0% · Other 1.0%
- 2008→2024 swing
- -13.6pp toward R · 2008: -41.3pp · 2024: -55.0pp
- All cycles
- 2024: R+55.0 2020: R+51.9 2016: R+56.2 2012: R+47.2 2008: R+41.3
Not yet ingested
- Civics
- —
Market trends
- HPI YoY
- ▼ -294.12%
- Current HPI
- 263.38
- Rent YoY
- —
- Metro
- Kingsport-Bristol, TN-VA
- State GDP YoY
- ▲ 2.78%
- F500 in state
- 22
Industry mix (Fortune 500 HQ in TN)
| Industry | F500 HQs | Revenue |
|---|---|---|
| Healthcare | 3 | $91B |
|
||
| Retail | 3 | $72B |
|
||
| Transportation / Logistics | 1 | $88B |
|
||
| Paper / Packaging | 1 | $19B |
|
||
| Insurance | 1 | $13B |
|
||
| Energy | 1 | $12B |
|
||
Price history
+253.8% since first listed7 events — show timeline
- 2026-05-21 Pending — TVRMLS
- 2026-05-12 Price Changed $115,000 TVRMLS
- 2026-05-01 Listed $125,000 TVRMLS
- 2022-07-08 Sold (Public Records) $67,000 Public Records
- 2022-07-08 Listed $69,100 TVRMLS
- 2022-07-08 Sold (MLS) $67,000 TVRMLS
- 1981-02-02 Sold (Public Records) $32,500 Public Records
Property tax history
+5.4%/yrLatest (2025): $928 · +12.9% YoY. Source: county tax records.
Cash-flow waterfall
monthlySold comps — $/sqft
last 12 mo · ≤1 miLoading sold comps…