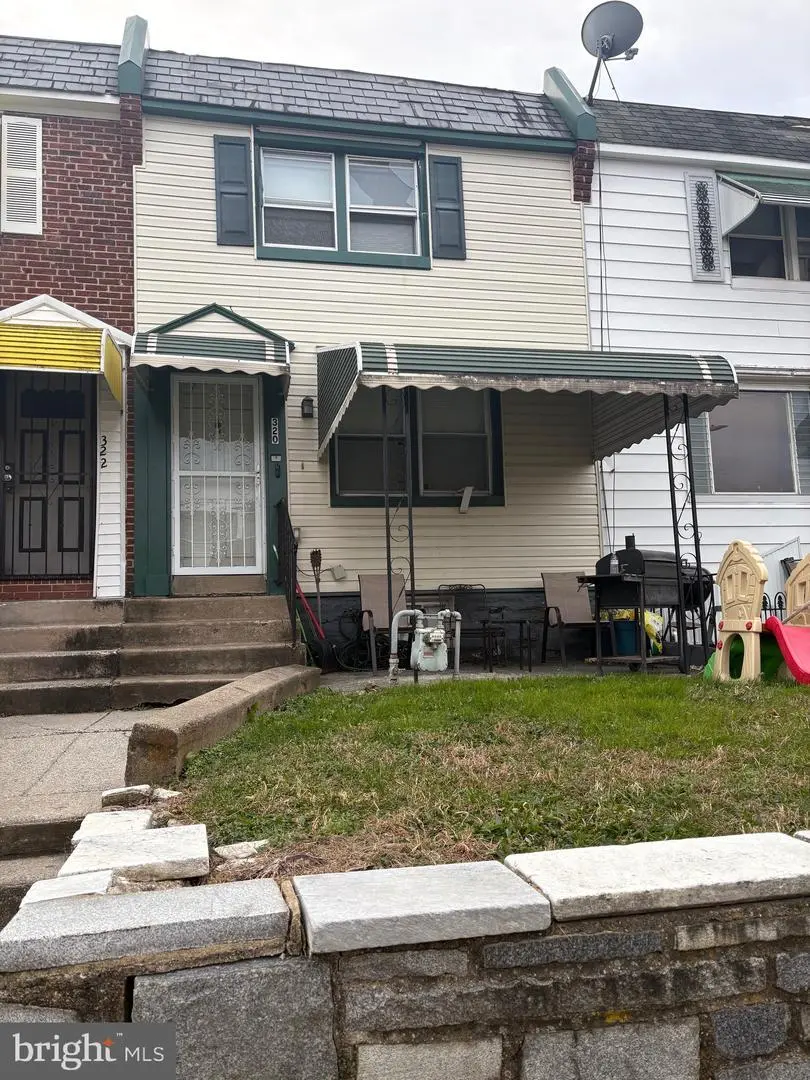
320 Mulberry St · Darby, PA
Flood risk 1/10 · Minimal
- FEMA flood zone
- X (unshaded)
- Chance of flooding over 30 yrs
- 0.0%
- Est. flood insurance / yr
- $473 – $860
Fire risk 1/10 · Minimal
- Est. fire insurance / yr
- $511 – $949
Heat risk 6/10 · Moderate
- Hot days now (above 103°F)
- 7 days/yr
- Hot days in 30 yrs
- 15 days/yr
Wind risk 6/10 · Moderate
- Chance of severe wind over 30 yrs
- 27.0%
Air-quality risk 4/10 · Minor
- Unhealthy air days now
- 3 days/yr
- Unhealthy air days in 30 yrs
- 6 days/yr
Risk factors via First Street. Map © Google.
Why this score? — see what drove the B grade
The composite is a weighted blend of 9 inputs, each scored 0–100. Each bar is that input's sub-score; the figure is the points it added to the 100-point composite (weight × sub-score).
- Cash flow +27.8/30.0
- ARV discount +13.0/15.0
- DSCR +9.8/10.0
- 1% rule +8.4/10.0
- Rent growth +5.0/5.0
- Livability +3.7/5.0
- Condition / age +2.5/5.0
- Schools +1.7/10.0
- Appreciation +0.0/10.0
$125,000
🖨 Deal sheet (PDF) 📄 Offer letter ✓ Due diligence
Listing remarks MLS
Welcome to this Darby 3BR/1BA rowhome offering a value-add opportunity. Property features a full basement and major systems in place including roof and heat. Home needs cosmetic and finishing work and is being sold strictly As-Is. Seller will make no repairs. Inspections welcome for informational purposes only. Occupied—showings by appointment only. Proof of funds or lender pre-approval required with all offers.
Key facts
- Roof
- Heat
- Full basement
Tags
Neighborhood map
What this means for you Summary
Snapshot
- This is a 3-bed/1.0-bath townhouse listed at $125k.
Deal economics
- At list price, monthly cash flow is $382 ($5k/yr) — positive.
- The deal already cash-flows at list — no discount required.
- Meets the 1% rule at list price ($2k rent vs $125k).
- Recommended offer: $114k (9.0% below list) — sets the bar for market timing.
- Cap rate 10.0% vs local median 6.3% in Darby — top-decile yield for the area; either an underpriced asset or a hidden risk that comps aren't pricing in. Stress-test before assuming the spread holds.
Location & tenants
- Location reads 74/100 on livability (#485 in PA, #4,468 nationally) — a middle-class / working-renter tenant base. Strengths: commute A+, cost of living A+, housing A+; Watch: amenities D+, employment D, crime F.
- William Penn SD (suburban): math 11% / reading 28% proficiency, ranked #491 of 539 in PA (top 91%) — low school quality limits family demand, transient renter base, plan for 1-2y turnover; 69% free/reduced lunch — lower-income household profile, screen leases tightly.
- Zoned schools: Park Lane El Sch (math 2% / reading 27%, grade F, #1,323 of 1,518 statewide, top 89%, 312 students, 100% FRL); Penn Wood Ms (math 5% / reading 28%, grade F, #463 of 512 statewide, top 91%, 683 students, 100% FRL); Penn Wood Hs (math 25% / reading 15%, grade F, #387 of 437 statewide, top 89%, 1,170 students, 95% FRL) — zoned schools average 98% FRL vs 69% district-wide (30 pts higher); higher-poverty schools than district average — tighter screening recommended.
- Market conditions: Rents rising fast (+13.1%/yr); 98 active listings in the ZIP; 31 comparable units currently listed for rent nearby; rentals at typical pace (median 20d on market — plan ~3-4 weeks tenant-placement turnaround); 299 units permitted in Delaware County in 2024 (5 in 5+ unit buildings).
- This rent runs 43% of the median local income ($46k/yr) — at the standard rent-burdened threshold; future hikes will face affordability resistance.
Forward outlook
- Local home prices are declining (-3.0%/yr); year-one equity from $864 of loan paydown is wiped out by about $4k of value loss. Plan a longer hold.
- At projected returns (-3.0% appreciation + 8.0% rent growth), your $35k cash investment doubles in ~7 years — after that, you're playing with house money.
Negotiation context
- It's been on market 96 days — a 9% lower offer ($114k) is reasonable based on typical stale-listing flexibility.
- Current owner paid $33k; list at $125k implies a 279% gain — meaningful room to come down on a strong offer.
Risks & watch-outs
- Watch-outs: built in 1945 — expect roof / HVAC / electrical / plumbing capex.
- Climate carrying-cost: major wind risk, 27% chance of damaging wind over 30y; extreme-heat days projected 7→15/yr by 2055 (HVAC capex compounding) — expect insurance premiums to compound above CPI over the hold.
Questions for the listing agent
- It's been on market 96 days. Have you received any prior offers? Is the seller open to a 9% concession, seller financing, or rate buy-down credit?
- Built in 1945 — when were the roof, HVAC, electrical panel, plumbing, and water heater last replaced?
- Why hasn't it sold? Are there any deal-killer items the seller is aware of (foundation, flood, title, zoning, code violations)?
- Is there a deadline driving the sale (1031 exchange, divorce, estate, relocation)? That informs how much negotiation room exists.
- Schools are F-rated, which usually means shorter tenancies and higher turnover. Who's the typical renter profile here, and what's been the actual vacancy rate?
- Crime grade is F in this area — have there been break-ins, vandalism, or insurance claims at this property in the last 3 years? What carrier currently insures it and at what premium?
- What's the average days-on-market for RENTAL listings here right now (not sales)? A rising rental-DOM trend means longer vacancies and softer asking-rent achievability than the comps imply.
- What's the recent tenant-quality profile in this submarket — average credit score on applications, eviction rate, late-payment / NSF rate, and stable-employment percentage? A property-management company in the area should have these aggregated.
- How much new for-sale + rental construction is in the pipeline within 1–3 miles? Heavy new supply typically softens prices + rents 12–24 months out; constrained supply supports both.
Investment metrics
- 1% rule
- 1.34% ✓
- Cap rate
- 9.96%
- Cash-on-cash
- 13.09%
- DSCR
- 1.58
- GRM
- 6.2
CMA / ARV
- ARV (median comp)
- $142,348
- List price
- $125,000
- Delta
- -12.19%
- Verdict
- UNDERPRICED
- Comps
- 20 within 1.0 mi
Show comp detail 12 sales within ~0.75 mi
| Address | Dist | Beds/Ba | Sqft | Sold | Price | $/sf | Match |
|---|---|---|---|---|---|---|---|
| 234 Spring Valley Rd | 0.20mi | 3/1.0 | 1,120 (+3%) | 0mo | $130,000 | $116 | 85 |
| 1232 Edgehill Rd | 0.21mi | 3/1.0 | 1,120 (+3%) | 1mo | $214,000 | $191 | 84 |
| 123 Spring Valley Rd | 0.28mi | 3/1.0 | 1,120 (+3%) | 1mo | $180,000 | $161 | 81 |
| 1339 Park Ln | 0.31mi | 3/1.0 | 1,120 (+3%) | 2mo | $230,000 | $205 | 79 |
| 33 Mermont Cir | 0.43mi | 3/1.0 | 1,120 (+3%) | 0mo | $200,000 | $179 | 74 |
| 1300 Wycombe Ave | 0.25mi | 3/1.0 | 1,190 (+9%) | 1mo | $129,000 | $108 | 72 |
| 902 Maple Ter | 0.19mi | 3/1.0 | 1,234 (+13%) | 0mo | $114,000 | $92 | 68 |
| 217 N 7th St | 0.25mi | 3/2.0 | 1,188 (+9%) | 1mo | $140,000 | $118 | 68 |
| 422 Darby Ter | 0.48mi | 3/1.0 | 1,006 (-8%) | 1mo | $185,000 | $184 | 64 |
| 224 N 2nd St | 0.54mi | 3/1.0 | 992 (-9%) | 2mo | $190,000 | $192 | 59 |
| 4 S 6th St | 0.43mi | 3/1.5 | 1,210 (+11%) | 2mo | $209,000 | $173 | 58 |
| 318 Fern St | 0.46mi | 2/1.0 (-1) | 952 (-12%) | 2mo | $105,000 | $110 | 51 |
Match score weights: distance 35% · size 25% · config 20% · recency 20%. Top-matched comps best support the ARV.
Projected returns pro-forma
-3.0% appreciation · 8.0% rent growth · sell at horizon
- IRR
- 8.9%
- Equity multiple
- 1.37×
- Total profit
- $12,967
- Equity at exit
- $18,638
- IRR
- 22.1%
- Equity multiple
- 3.37×
- Total profit
- $83,106
- Equity at exit
- $10,808
Cash invested: $35,000 (down + closing). Projections, not guarantees.
Landlord ↔ Tenant lean methodology
- Overall (STATE)
- 62 Landlord-Friendly
- State Pennsylvania
- 62 Landlord-Friendly · EVEN
- County
- — inherits STATE
- City
- — inherits STATE
ZIP-level market 19023
- Rents YoY
- 13.1%
- Active inventory
- 98
- Price-to-rent
- 6.2×
Monthly cashflow live
- Estimated rent
- $1,672 high interval (Pro) →
- Mortgage (P&I)
- −$656
- Tax from tax record
- −$231 /mo · $2,777/yr
- Insurance
- −$52
- HOA
- −$0
- Vacancy / Maint / Mgmt
- −$351
- Net cashflow
- $382
Break-even live
Sensitivity live
| Price | -10% $453 | -5% $417 | +0% $382 | +5% $346 | +10% $311 |
|---|---|---|---|---|---|
| Rent | -10% $250 | -5% $316 | +0% $382 | +5% $448 | +10% $514 |
| Rate | -1.0pp $445 | -0.5pp $414 | base $382 | +0.5pp $349 | +1.0pp $316 |
UW: 25.0% down · 7.5% · 30yr · 1.5% tax · 5.0% vac · 8.0% maint · 8.0% mgmt
Financing live
Cash to close
- Down payment
- $31,250
- Closing costs
- $3,750
- Reserves months
- —
- Total cash needed
- —
Loan-product check · same deal, 3 products live
Conventional
25% down · 7.5% · 30yr
- Down + closing
- —
- Monthly P&I
- —
- Monthly cashflow
- —
- DSCR
- —
- Eligible?
- —
Personal DTI + credit; lowest rate.
DSCR
20% down · 8.5% · 30yr
- Down + closing
- —
- Monthly P&I
- —
- Monthly cashflow
- —
- DSCR
- —
- Eligible?
- —
No personal income docs; deal must DSCR.
Hard money
10% down · 12.0% · 12mo
- Down + closing
- —
- Monthly P&I
- —
- Monthly cashflow
- —
- DSCR
- —
- Eligible?
- —
Short-term bridge; refi at stabilization.
Rent comps 31 comps
| Address | Beds | Baths | Sqft | Rent | $/sqft | DOM | Units | Dist |
|---|---|---|---|---|---|---|---|---|
| 935 Maple Ter Darby, PA | 3.0 | 1.0 | 1266 | $1,585 | $1.25 | 12d | 1 | 0.18mi |
| 935 Maple Ter Darby, PA | 3.0 | 1.0 | 1266 | $1,585 | $1.25 | 6d | 1 | 0.18mi |
| 924 Maple Ter Darby, PA | 3.0 | 1.5 | 1190 | $2,000 | $1.68 | 6d | 1 | 0.20mi |
| 106 N 6th St Darby, PA | 2.0 | 1.0 | 1200 | $1,550 | $1.29 | 45d | 1 | 0.36mi |
| 1300 Main St Unit Basement Darby, PA | 2.0 | 1.0 | 1000 | $1,450 | $1.45 | 25d | 1 | 0.43mi |
| 1300 Main St Unit Basement Darby, PA | 2.0 | 1.0 | 800 | $1,450 | $1.81 | 12d | 1 | 0.43mi |
| 69 S 7th St Darby, PA | 3.0 | 2.0 | 1446 | $1,700 | $1.18 | 45d | 1 | 0.47mi |
| 37 Concord Rd Darby, PA | 3.0 | 1.0 | 1120 | $1,795 | $1.60 | 45d | 1 | 0.49mi |
| 909 Springfield Rd Unit D Darby, PA | 4.0 | 1.0 | 900 | $1,600 | $1.78 | 45d | 1 | 0.49mi |
| 209 Hamilton Ave Darby, PA | 4.0 | 1.0 | 1400 | $1,595 | $1.14 | 16d | 1 | 0.56mi |
| 300 N Front St Darby, PA | 2.0 | 1.0 | 850 | $1,395 | $1.64 | 45d | 1 | 0.60mi |
| 810 Rundale Ave Lansdowne, PA | 2.0 | 1.0 | 868 | $1,500 | $1.73 | 25d | 1 | 0.61mi |
| 2 Winthrop Rd Darby, PA | 3.0 | 1.5 | 1224 | $1,900 | $1.55 | 23d | 1 | 0.68mi |
| 700 Pine St Unit 2F Darby, PA | 2.0 | 1.0 | 1100 | $1,250 | $1.14 | 19d | 1 | 0.72mi |
| 504 S Lansdowne Ave Lansdowne, PA | 2.0 | 1.0 | 815 | $1,545 | $1.90 | 0d | 4 | 0.77mi |
| 826 Guenther Ave Lansdowne, PA | 2.0 | 1.0–2.0 | 800 | $1,699 | $2.12 | 25d | 1 | 0.81mi |
| 619 Baily Rd Lansdowne, PA | 3.0 | 1.0 | 1288 | $1,850 | $1.44 | 20d | 1 | 0.82mi |
| 608 Yeadon Ave Unit 1st Floor Yeadon, PA | 2.0 | 1.0 | 1000 | $1,400 | $1.40 | 19d | 1 | 0.83mi |
| 608 Yeadon Ave Unit 2nd Floor Yeadon, PA | 2.0 | 1.0 | 1000 | $1,400 | $1.40 | 14d | 1 | 0.83mi |
| 412 S 2nd St Darby, PA | 3.0 | 1.0 | 1190 | $1,100 | $0.92 | 6d | 1 | 0.90mi |
| 146 S Lansdowne Ave Apt A9 Lansdowne, PA | 2.0 | 1.0 | 950 | $1,469 | $1.55 | 0d | 1 | 0.93mi |
| 417 S 2nd St Darby, PA | 3.0 | 1.0 | 1190 | $1,020 | $0.86 | 6d | 1 | 0.93mi |
| 601 Poplar St Sharon Hill, PA | 1.0–2.0 | 1.0 | 787 | $1,599 | $2.03 | 16d | 5 | 1.00mi |
| 534 S 4th St Darby, PA | 3.0 | 1.0 | 1500 | $1,695 | $1.13 | 0d | 1 | 1.02mi |
| 35 Elberon Ave Unit 2 Lansdowne, PA | 2.0 | 1.0 | 900 | $1,695 | $1.88 | 25d | 1 | 1.13mi |
| 118 Felton Ave Darby, PA | 3.0 | 1.0 | 1152 | $1,750 | $1.52 | 23d | 1 | 1.19mi |
| 112 Juliana Ter Darby, PA | 3.0 | 1.0 | 1020 | $2,450 | $2.40 | 25d | 1 | 1.23mi |
| 112 Juliana Ter Darby, PA | 3.0 | 1.0 | 1020 | $2,350 | $2.30 | 46d | 1 | 1.23mi |
| 101 W Baltimore Ave Unit B04 Lansdowne, PA | 2.0 | 1.0 | 925 | $1,469 | $1.59 | 25d | 1 | 1.38mi |
| 101 W Baltimore Ave Unit H4 Lansdowne, PA | 2.0 | 1.0 | 925 | $1,449 | $1.57 | 23d | 1 | 1.38mi |
| 124 Lexington Ave Unit 2 Lansdowne, PA | 2.0 | 1.0 | 1000 | $1,500 | $1.50 | 4d | 1 | 1.38mi |
Listing history 17 events
-
2026-06-21days on market $125,000 Active 96 DOM
-
2026-06-18days on market $125,000 Active 93 DOM
-
2026-06-17days on market $125,000 Active 92 DOM
-
2026-06-16days on market $125,000 Active 91 DOM
-
2026-06-15days on market $125,000 Active 90 DOM
-
2026-06-13days on market $125,000 Active 88 DOM
-
2026-06-13days on market $125,000 Active 87 DOM
-
2026-06-09days on market $125,000 Active 84 DOM
-
2026-06-08days on market $125,000 Active 83 DOM
-
2026-06-07days on market $125,000 Active 82 DOM
-
2026-06-04days on market $125,000 Active 79 DOM
-
2026-06-03days on market $125,000 Active 78 DOM
-
2026-06-02days on market $125,000 Active 77 DOM
-
2026-06-01days on market $125,000 Active 76 DOM
-
2026-05-31days on market $125,000 Active 75 DOM
-
2026-03-17$125,000 Active 421-char remark
Show marketing remark (421 chars)
Welcome to this Darby 3BR/1BA rowhome offering a value-add opportunity. Property features a full basement and major systems in place including roof and heat. Home needs cosmetic and finishing work and is being sold strictly As-Is. Seller will make no repairs. Inspections welcome for informational purposes only. Occupied—showings by appointment only. Proof of funds or lender pre-approval required with all offers.
-
1984-07-19soldstatus $33,000
ⓘ Source: listings_history table (triggers on properties + properties_extension) + one-shot
backfill from property_details.listing_events for pre-trigger history.
Tax reassessment forecast PA · Partial reset (capped growth)
- Current annual tax
- $2,777 · $231/mo
- Projected year-2 tax
- $2,777 · $231/mo
- Expected delta
- $0/yr ($0/mo · 0.0%)
ⓘ Screening estimate from a state-policy table — verify with the county assessor before closing.
Climate risk First Street
- Flood 1/10 Low FEMA zone X (unshaded) · 0% chance over 30 yrs
- Wildfire 1/10 Low
- Heat 6/10 Major 7 d/yr ≥103°F today · 15 d/yr by 30 yrs out
- Wind 6/10 Major 27% chance of damaging wind over 30 yrs
- Air quality 4/10 Moderate 3 unhealthy d/yr today · 6 by 30 yrs out
Nearby sold comps map
Loading sold comps map…
Walkable amenities ~0.75 mi
Loading nearby amenities…
Taxation est. · year 1
- Rental income
- $20,063
- − Mortgage interest
- −$7,002
- − Property taxes
- −$2,777
- − Insurance
- −$625
- − Repairs & maintenance
- −$1,605
- − Management
- −$1,605
- − Depreciation
- −$3,636
- Taxable income
- $2,812
- Est. tax owed @ 24.0%
- −$675
- After-tax cash flow
- $3,906/yr
For passive investors: Depreciation is non-cash, so a rental often shows a tax loss while cash-flowing — sheltering income. Rental losses are passive: they offset passive income freely, and up to $25,000/yr can offset ordinary (W-2) income if you actively participate and your MAGI is under $100k (phasing out to $0 by $150k); unused losses carry forward. On sale, claimed depreciation is recaptured at up to 25%, and gains may owe capital-gains tax (a 1031 exchange can defer both). Figures are a year-1 estimate at your 24.0% rate — not tax advice; consult a CPA.
Schools (NCES district)
- District
- William Penn SD
- NCES district ID
- 4226390
- Math proficiency
- 11% ▼ -3.00%
- Reading proficiency
- 28% ▼ -7.00%
- Median HH income
- $48,543
- Composite
- 17.29/100
- National rank
- #9086
- State rank
- #491 of 539 in PA
Livability — Darby
- Score
- 74/100
- State rank
- #485
- US rank
- #4468
Category grades
Schools grade is shown separately in the Schools card above.
Census & demographics
- Census place
- Darby, PA
- County
- Delaware County · 399,863 people
- Metro
- Philadelphia-Camden-Wilmington, PA-NJ-DE-MD
- Population (ZIP)
- 22,247
- Household income
- $46,463
- Rent vs Own
- Severe rent burden
- 1468.0
Population outlook (Delaware County) Hauer SSP2
- Today (2025)
- 577,490 people
- By 2030
- 581,243 · +0.6%
- By 2040
- 584,700 · +1.2%
- By 2050
- 586,581 · +1.6%
- By 2075
- 598,706 · +3.7%
- By 2100
- 590,823 · +2.3%
Race, ethnicity, and origin ACS 2023
- Neighborhood character
- Predominantly Black (76%)
- Race & ethnicity
- Black 76% White 15% Two or more races 5% Hispanic / Latino 3% Asian 2%
- Common ancestry
- Swiss 5% Hispanic 1% Romanian 1%
- Foreign-born
- 18% · Canada
- Languages at home
- 84% English-only · French/Haitian/Cajun 4% Spanish 3% Other Asian/Pacific 1%
Political lean MEDSL · Delaware
- 2024 margin
- Strong D (+23.7) · D 61.4% · R 37.6% · Other 1.0%
- 2008→2024 swing
- +2.3pp toward D · 2008: 21.4pp · 2024: 23.7pp
- All cycles
- 2024: D+23.7 2020: D+26.7 2016: D+22.0 2012: D+21.8 2008: D+21.4
Not yet ingested
- Civics
- —
Market trends
- HPI YoY
- ▼ -190.50%
- Current HPI
- 277.7034
- Rent YoY
- ▲ 13.10%
- Metro
- Philadelphia-Camden-Wilmington, PA-NJ-DE-MD
- State GDP YoY
- ▲ 1.68%
- F500 in state
- 34
Industry mix (Fortune 500 HQ in PA)
| Industry | F500 HQs | Revenue |
|---|---|---|
| Healthcare | 2 | $309B |
|
||
| Insurance | 2 | $27B |
|
||
| Telecommunications / Media | 1 | $124B |
|
||
| Industrial Distribution | 1 | $22B |
|
||
| Financial Services | 1 | $20B |
|
||
| Chemicals / Materials | 1 | $18B |
|
||
Price history
+278.8% since first listed2 events — show timeline
- 2026-03-17 Listed $125,000 BRIGHT MLS
- 1984-07-19 Sold (Public Records) $33,000 Public Records
Property tax history
+0.9%/yrLatest (2026): $2,777 · -0.5% YoY. Source: county tax records.
Cash-flow waterfall
monthlySold comps — $/sqft
last 12 mo · ≤1 miLoading sold comps…